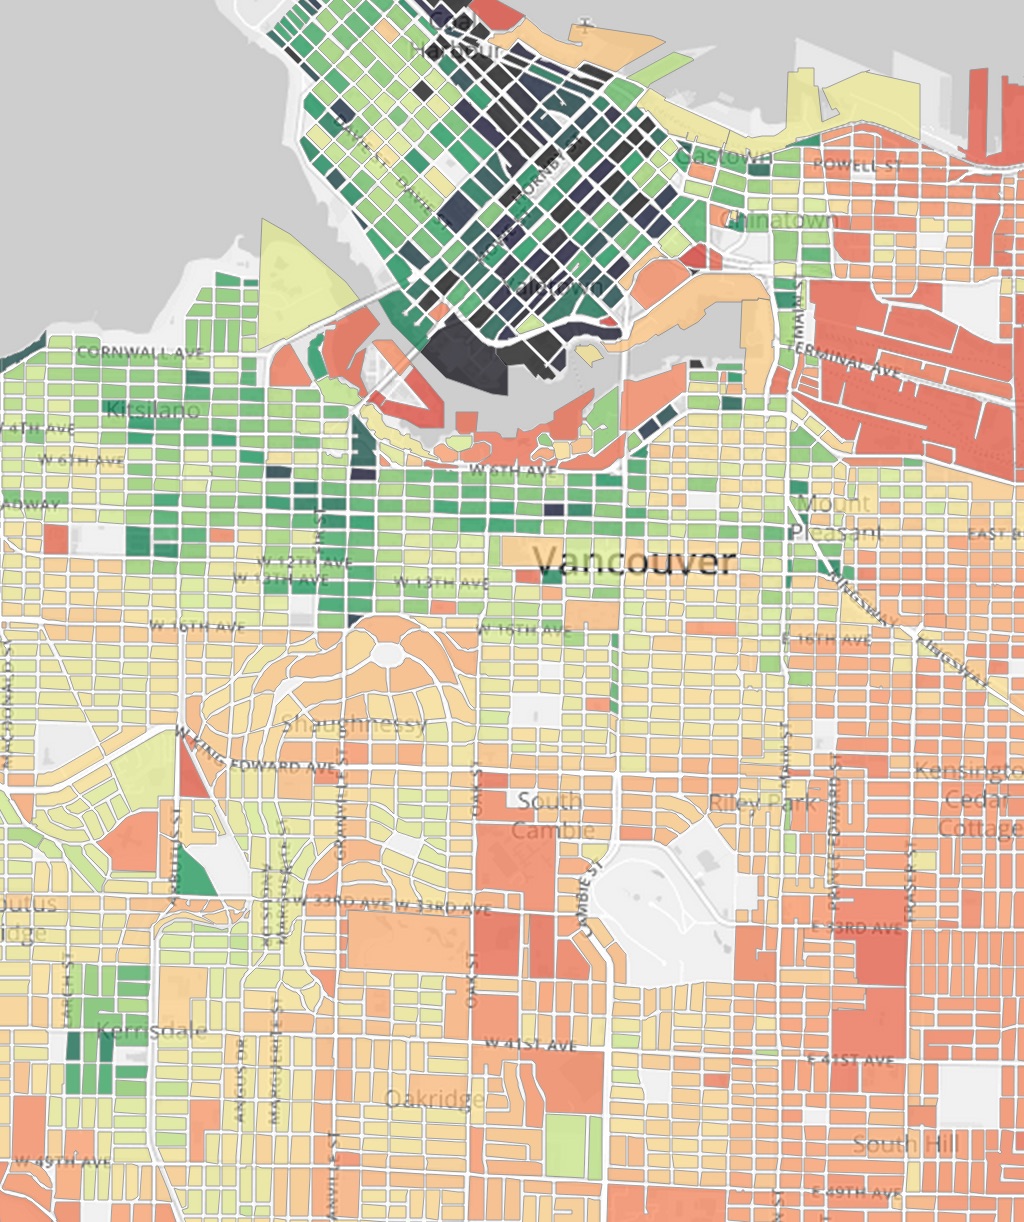
The City of Vancouver has recently updated their open data catalogue with historic tax data. We figured that would be a good time to take our previous rather clumsy attempts to map tax data and polish that up a bit.
This time we put in a couple of evenings to build a more responsive map with multiple options of what to map. Head straight for ‘the map’ or read on for some background information, including some methodology on data cleaning and interpolation.
Our previous ‘teardown map’ and ‘high value map’ suffered from being a static websites, and they loaded large amounts of data all at once, 30,000 properties for the teardown map, and display the all at once. Options were limited for displaying more detailed data when selecting individual properties. For the viewer this resulted more in an exercise of patience than in an ‘interactive’ experience.
We decided to remedy this by importing the CoV data into a database and chop the data up dynamically and serve it as vector tiles. For smaller zoom levels we aggregated data at the block level. There are lots of blocks in Vancouver, 4444 that contain properties with tax information to be precise. So again the map is a little sluggish on mobile devices and slower machines when zoomed out, but things get much faster as we zoom in.
Moreover, we now have the ability to easily display more detailed information once the use selects an individual property or block aggregate. We can display a graph with the development of land and building values and other details. And we integrated google streetview for good measure.
One issue that came up is that CoV historical data has lots of gaps. For example, when a particular property was re-developed it gets a new tax number. The tax information for the old property is lost and cannot be connected to the geographic site using the information provided by CoV. So when we display data showing ‘value change’ between 2006 and 2014 we color these properties in grey. This problem persists when we aggregate information at the block level. To avoid greying out lots of blocks we extrapolate the missing data by using citywide averages on growth rates of land and building values for the properties in question. This will likely underestimate the aggregate growth in building and land value, but will not have a big impact at the block level if the individual property value in question was comparatively small. But this was not always the case. Better analysis could solve some of these issues, so does zooming in to the individual property level.
Another issue is that CoV does not provide historic zoning information. It would be interesting to get historic zoning and development permit information. Some of this data is already available, albeit not in an easily consumable form.
Other than that a big thanks to the folks maintaining the CoV open data catalogue!
Reuse
Citation
@misc{vancouver-assessment-data.2015,
  author = {{von Bergmann}, Jens},
  title = {Vancouver {Assessment} {Data}},
  date = {2015-03-23},
  url = {https://doodles.mountainmath.ca/posts/2015-03-23-vancouver-assessment-data/},
  langid = {en}
}

