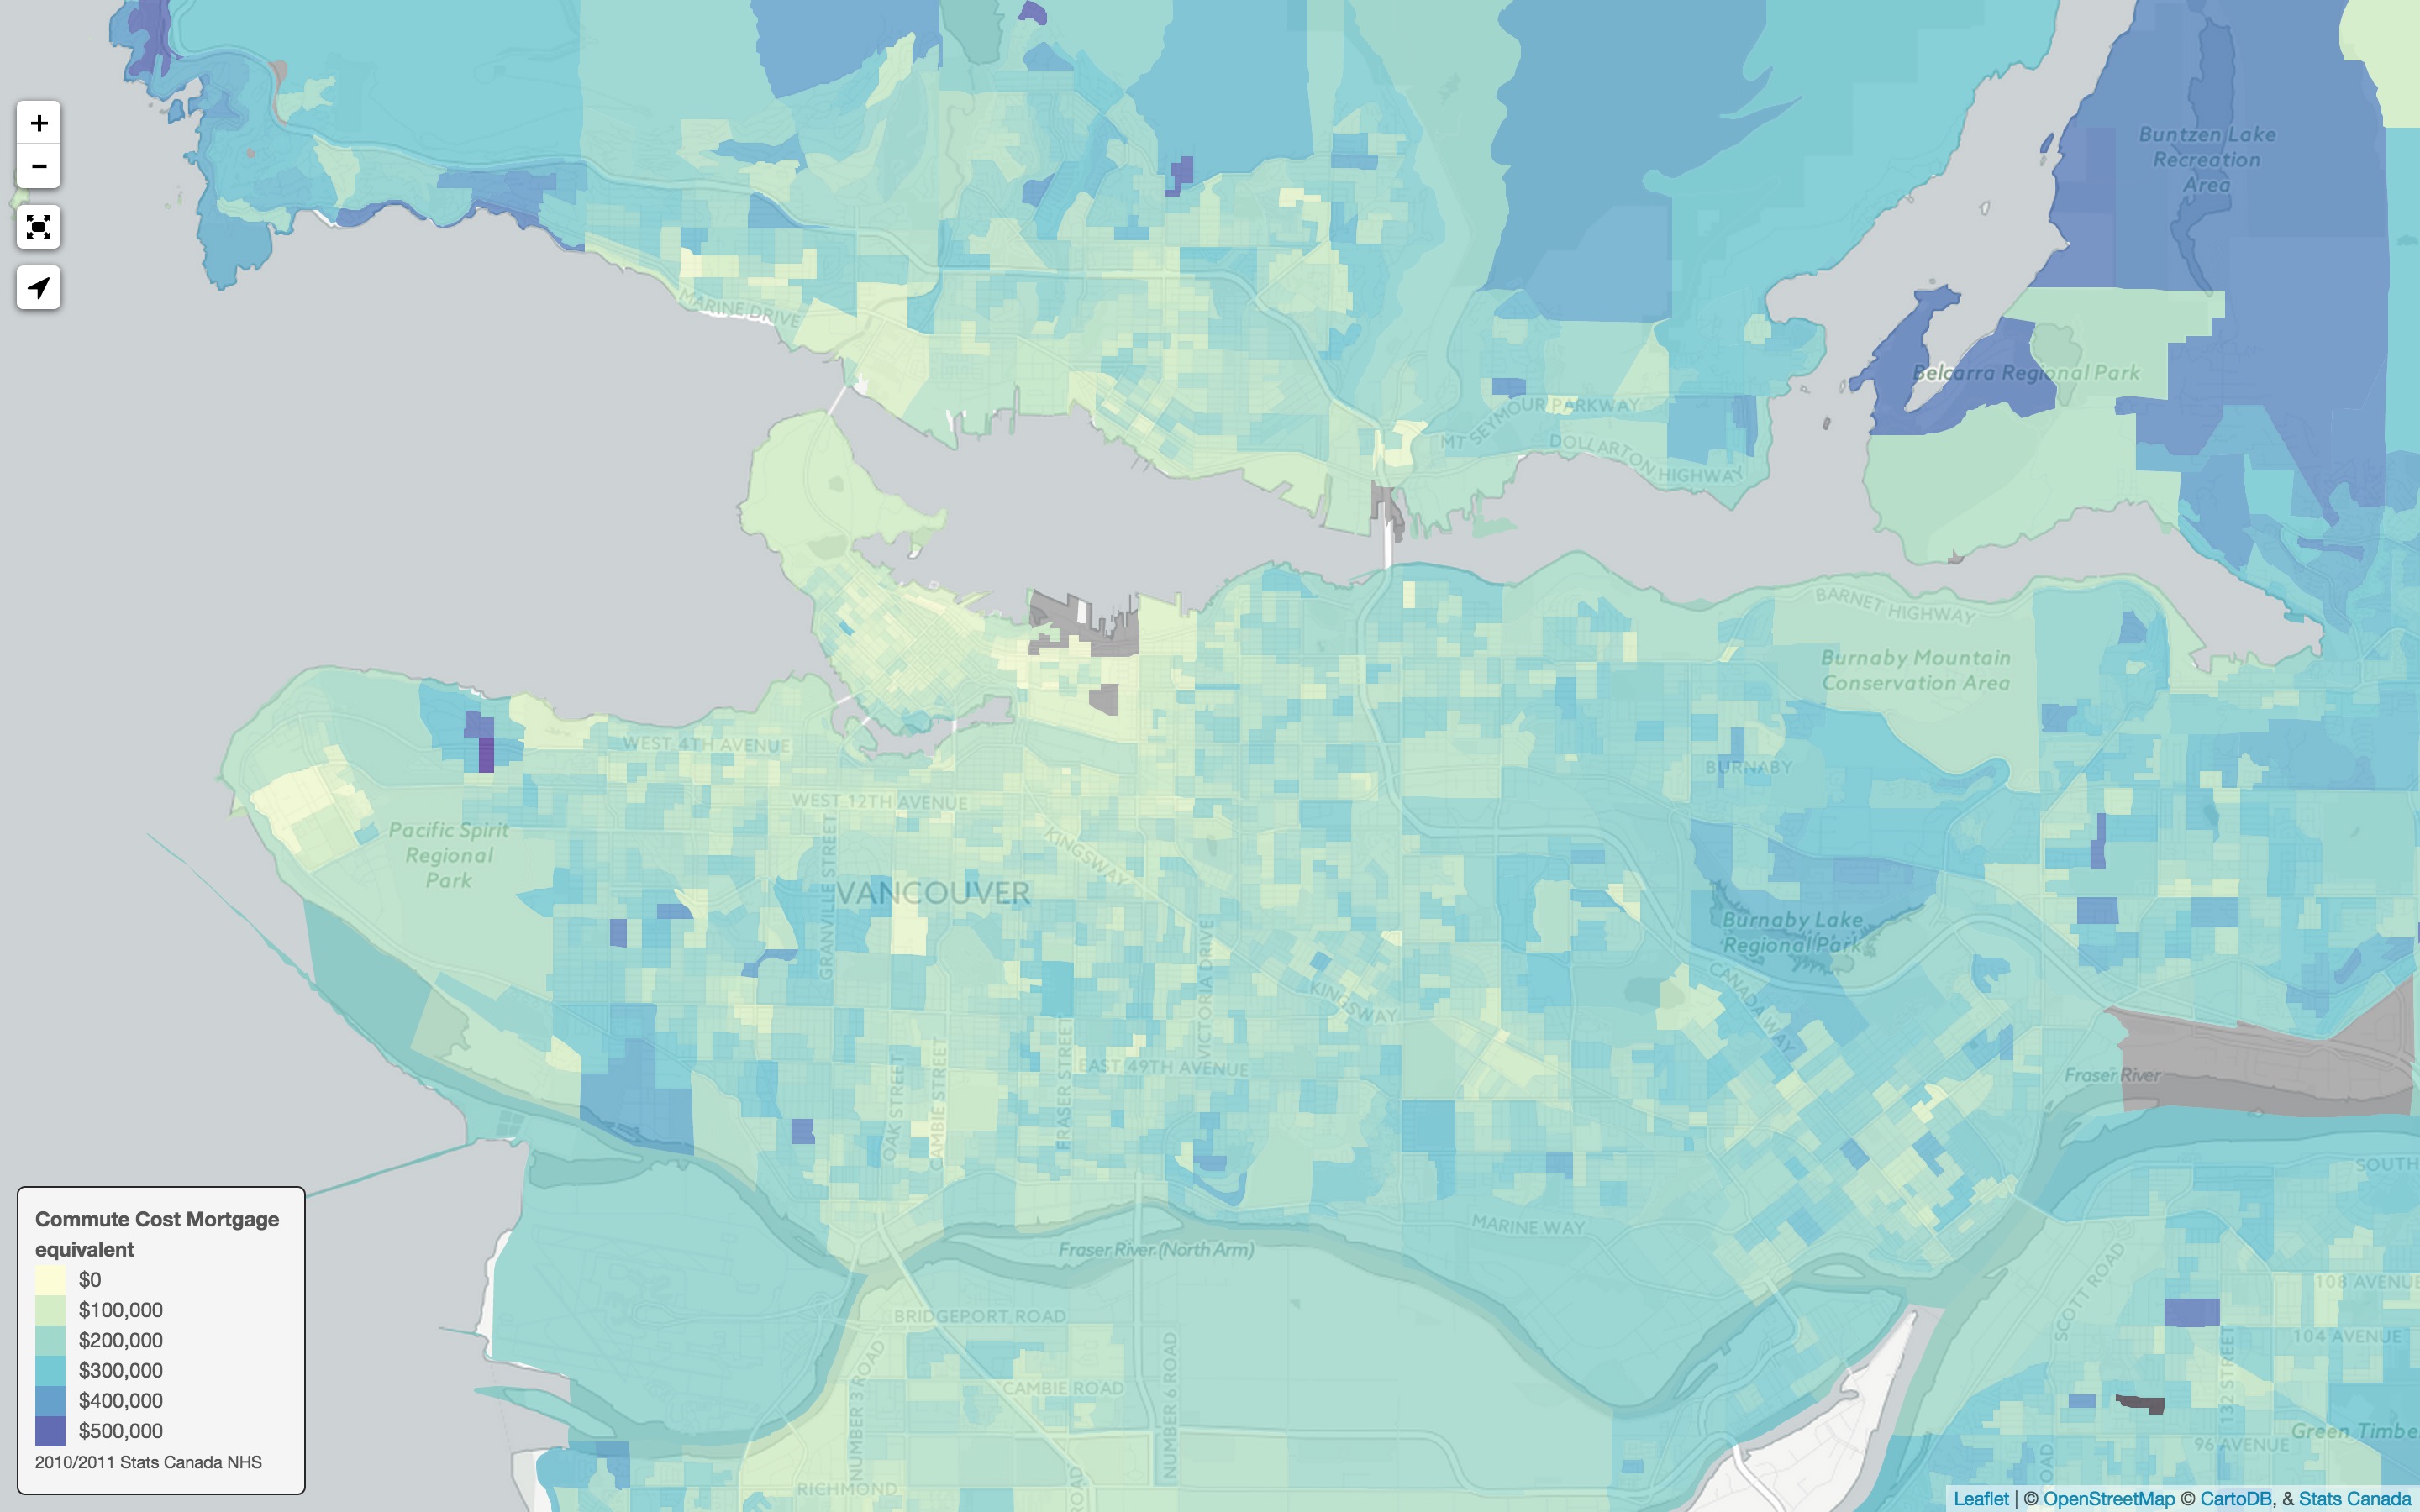
Some months ago I did a little side project and put some Census Canada data for Vancouver on an interactive map online. After it generated quite some interest, to a large part due to Ian Young’s reporting utilizing some of the data in the South China Morning Post, I talked to my friend Alejandro and we decided to set up a Census Mapper that allowes laymen to map any census variables of their choosing Canada wide.
Since this is only a side project, it will take some time to set this up properly. In the meantime, I get to have some fun to play with census data and map some variables of my choosing.
For a sneak preview of what the Census Mapper will be able to do read below the fold. No interaction, no chosing your own variables and panning around Canada yet. Just some screenshots with a story to tie them together.
Census Mapper Sneak Preview
One of my many pet pieves has been the Drive Until You Qualify phrase. The idea is that you buy the house closest to your place of work for which the bank will aprrove a loan. The obvious problem with this is that your commuting costs will go up the further away from work you live – and you disposable income goes down accordingly. But the bank does not seem to be bothered by that at all and often does not get much attention by househunting families either.
The fix? Easy. The cost of commuting and housing should not be separated by viewed in concert with one another. People househunting right will have to do this based on their individual parameters, but let’s take a look at what choices people have made in the past based on Census Canada’s 2011 NHS data.
Dwelling Value
In mapping terms, let’s start with the map of Median Dwelling Values around Vancouver, taken from the NHS. Although a little dated, it still serves to make the basic point.
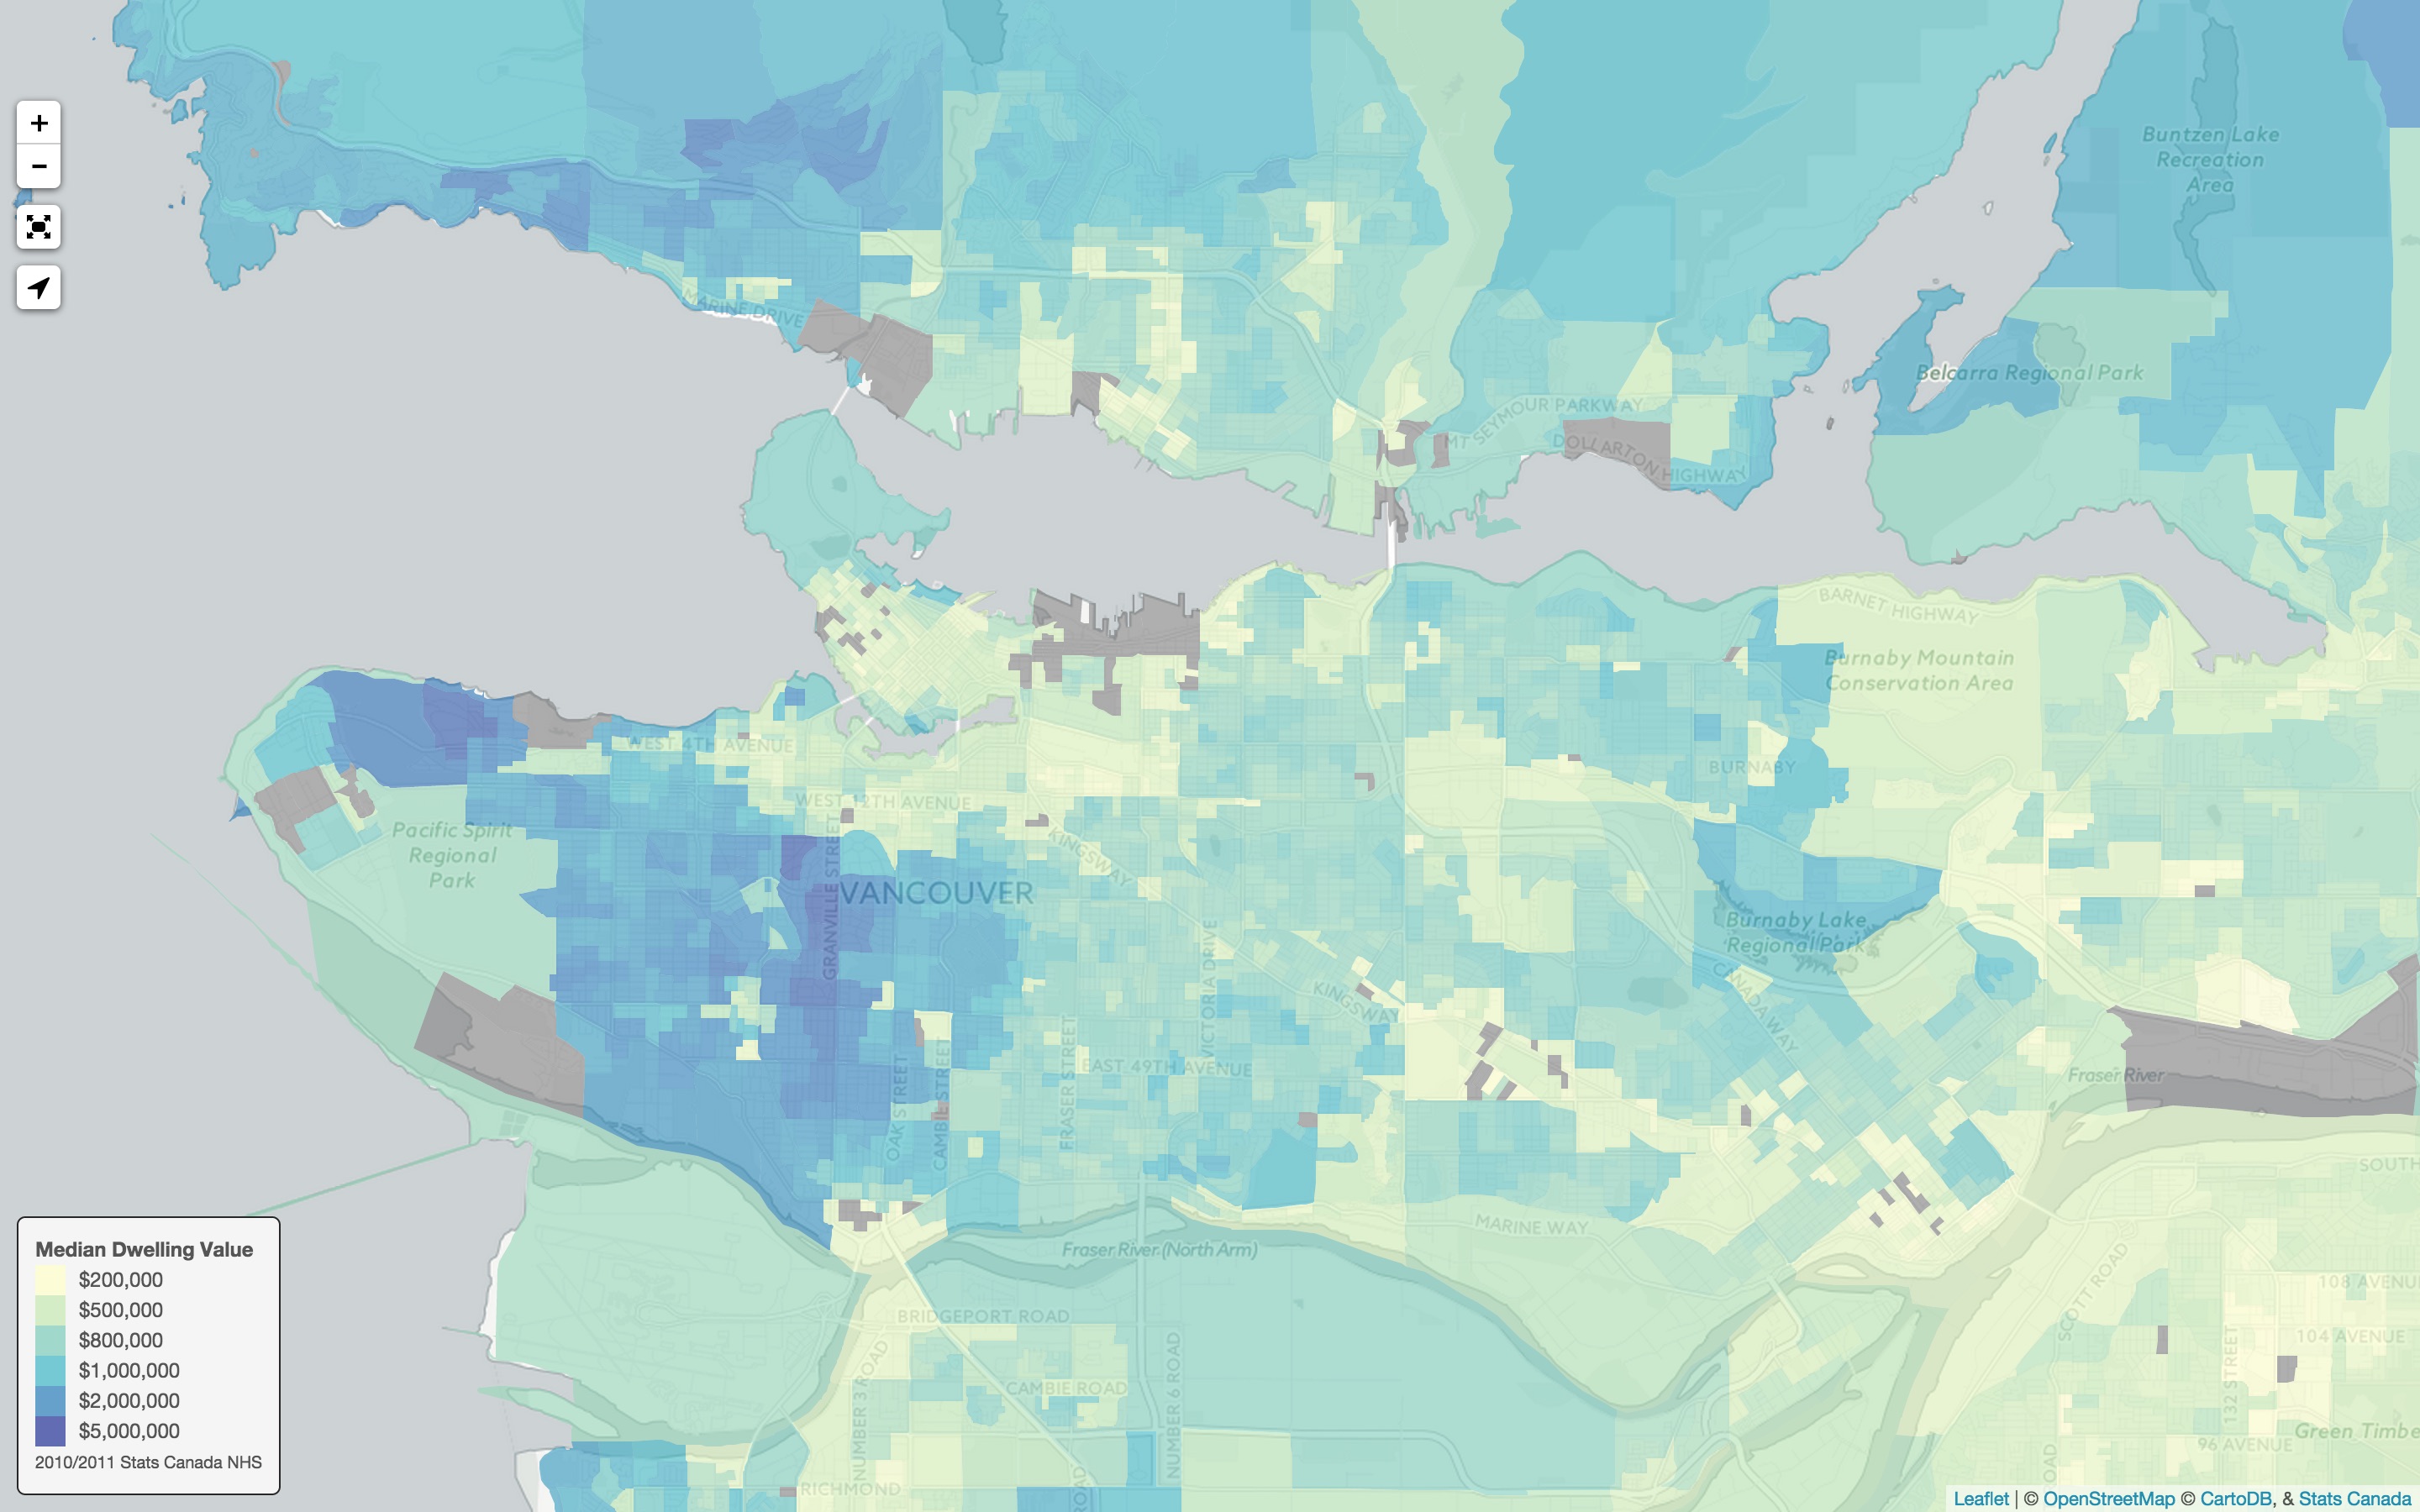
The image is the familiar one, homes are expensive on the west side, a little less so toward the east. In Vancouver proper the downtown area is somewhat affordable with prices dipping below $300,000 for the median dwelling. We are considering the whole range, one bedroom condos all the way up to single family homes.
Commute Time
Next up, how much time to these people spend commuting? The NHS got you covered.
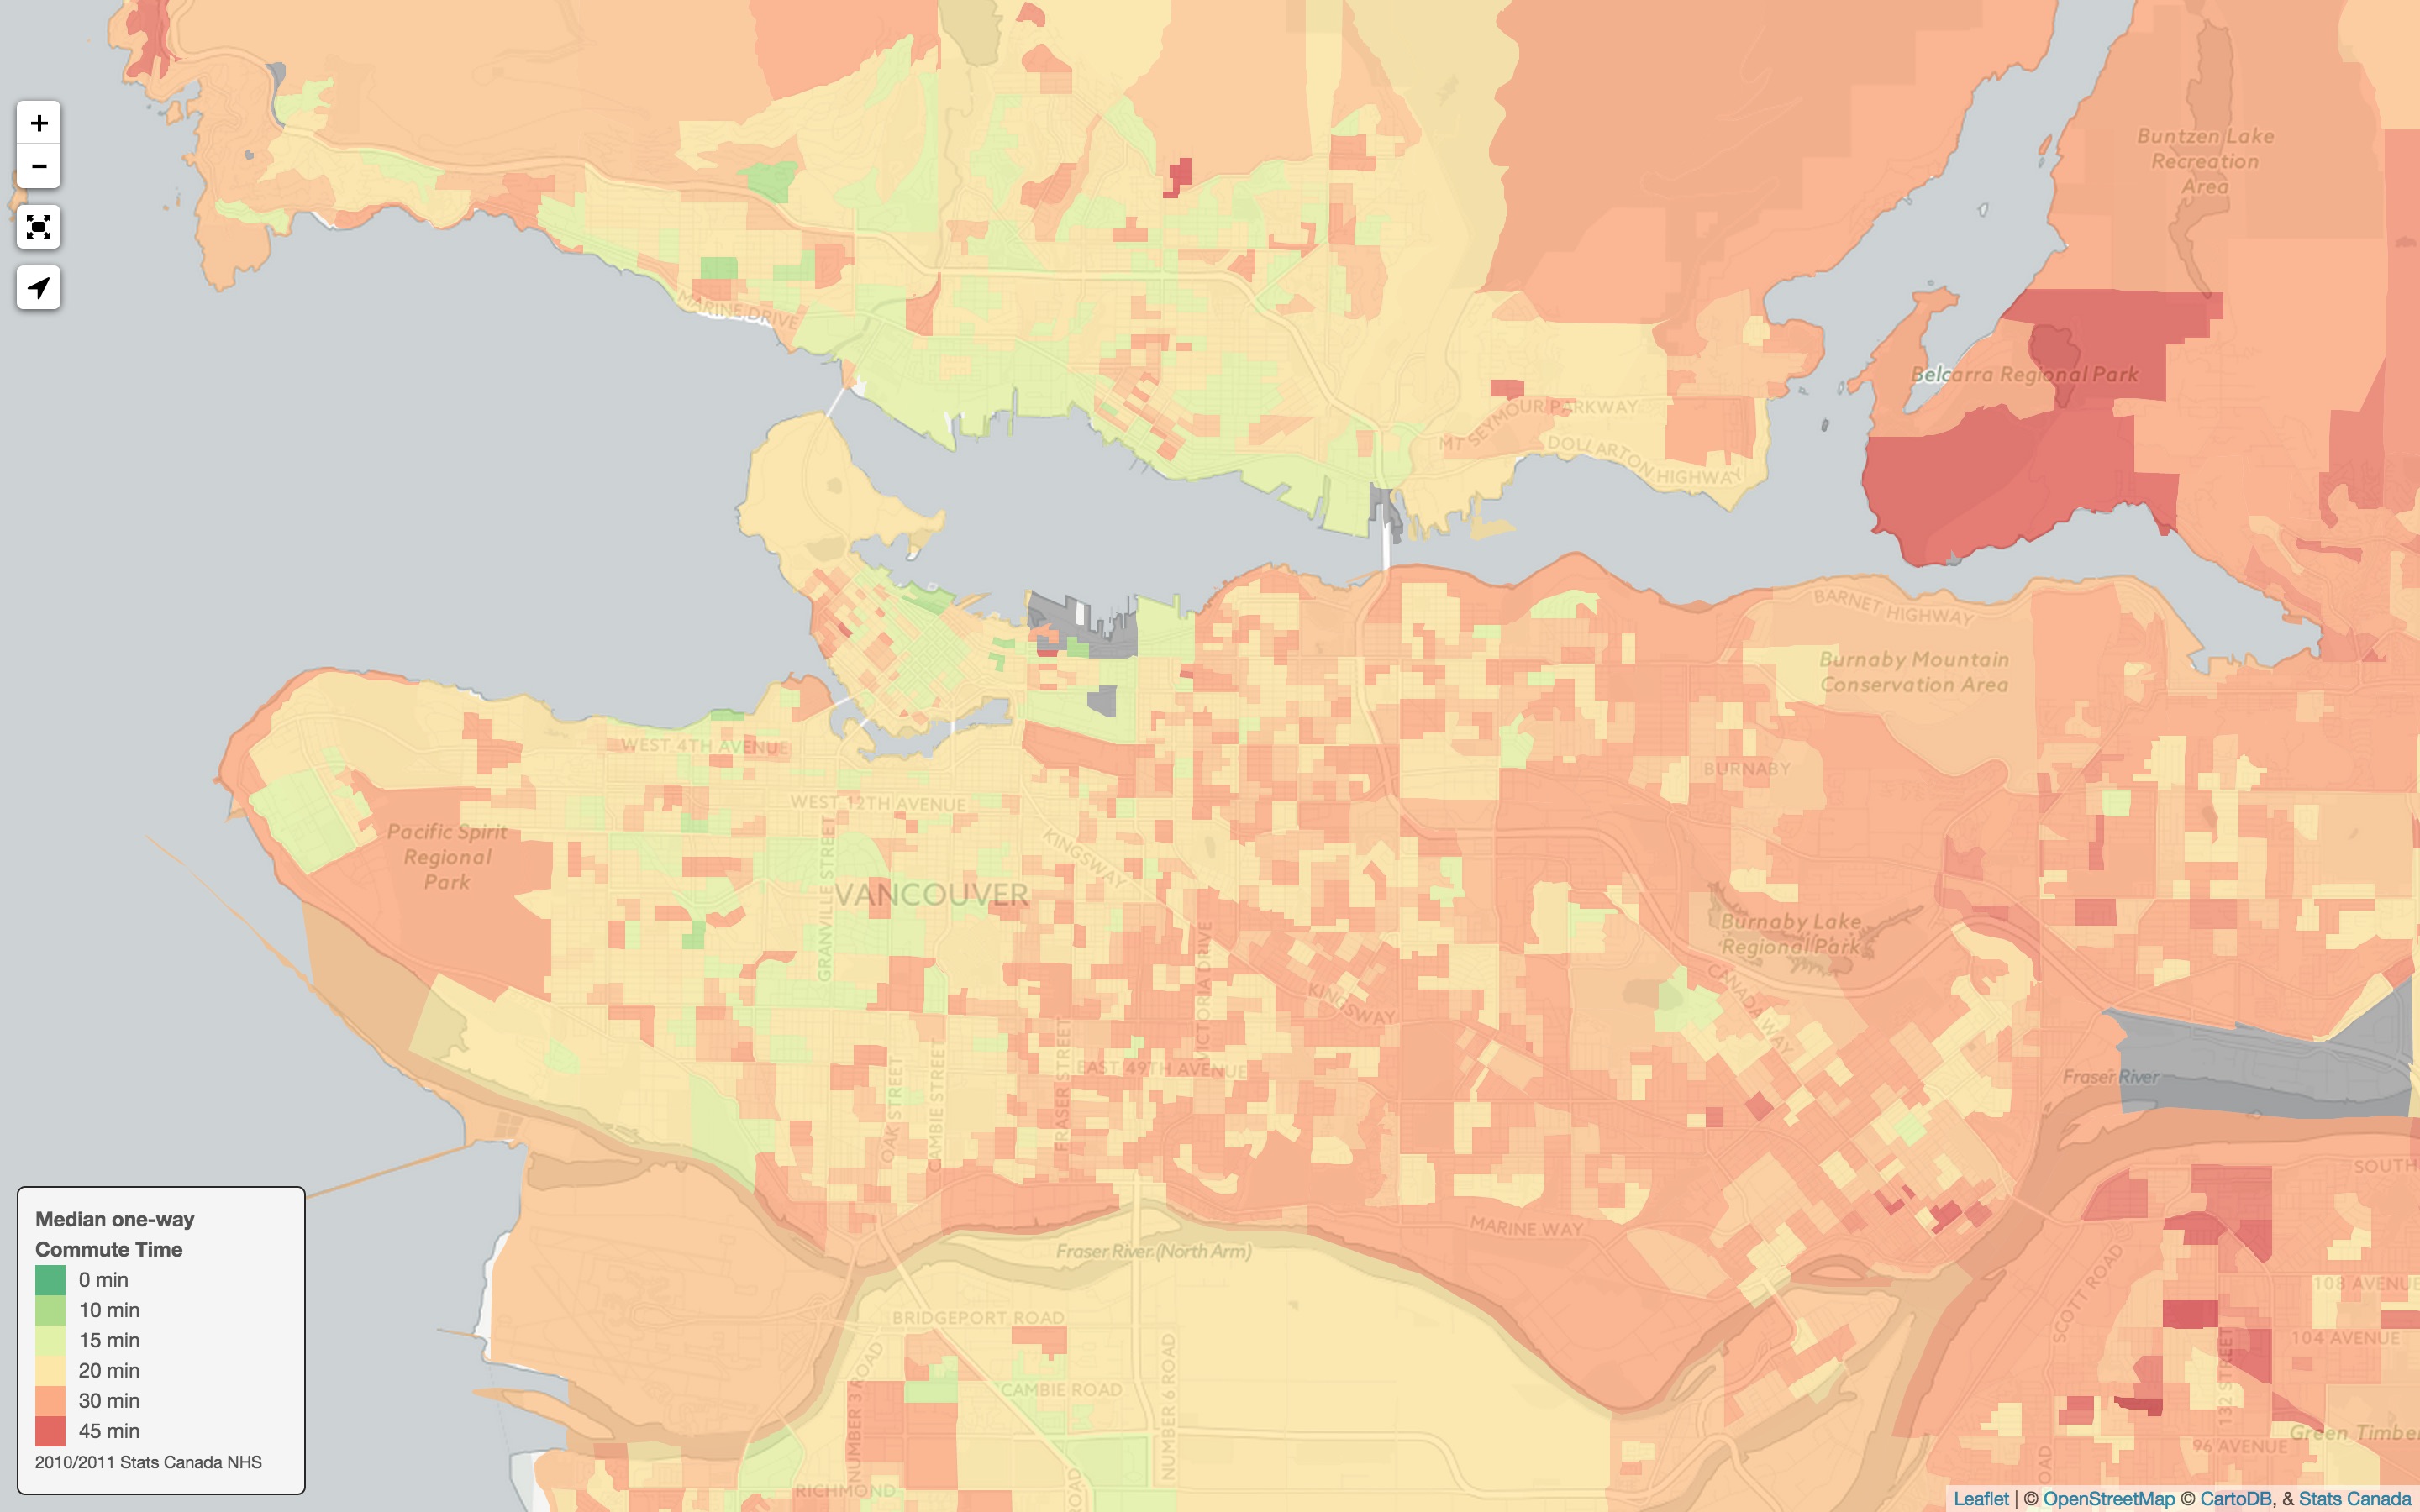
The median one-way commute time give us a picture of how much time people spend to go to work. And we will assume they spend the same time coming back.
How much does it cost to commute. We will think of the commute cost as being made up of two components. The money spent to get to and from work and the dollar value of the time. That leaves us with two more questions. How much money do people spent and how much is their time worth.
Transportation Cost
Luckily, again the NHS has something to say about this. To figure out the money spent on the commute we look at the mode of transport. NHS tell us how many people drive, are passengers, take transit, cycle or walk to work. To keep things simple we will compute the ‘median commute cost’ by setting transit cost at $120 per month (roughly the price for a 2-zone transit pass) and for driving we set the car2go rate of 41c/min (which is quite generous, most people will spent more if they own a car, and pay for gas, insurance, parking themselves and spent time to maintain it). For simplicit we set the cost for passengers, cyclists and pedestrians at zero. So we sum over the number of drivers and transit users and divide by the total number of commuters in each dissemination area to estimate that cost. Generally speaking it turns out to be much smaller than the ‘time cost’ calculated next.
Time Cost
To compute the ‘time cost’ of commuting for the average person in each dissemination area we need to know what people’s time is worth. The NHS has a simple answer for that, the Median After Tax Household Income.
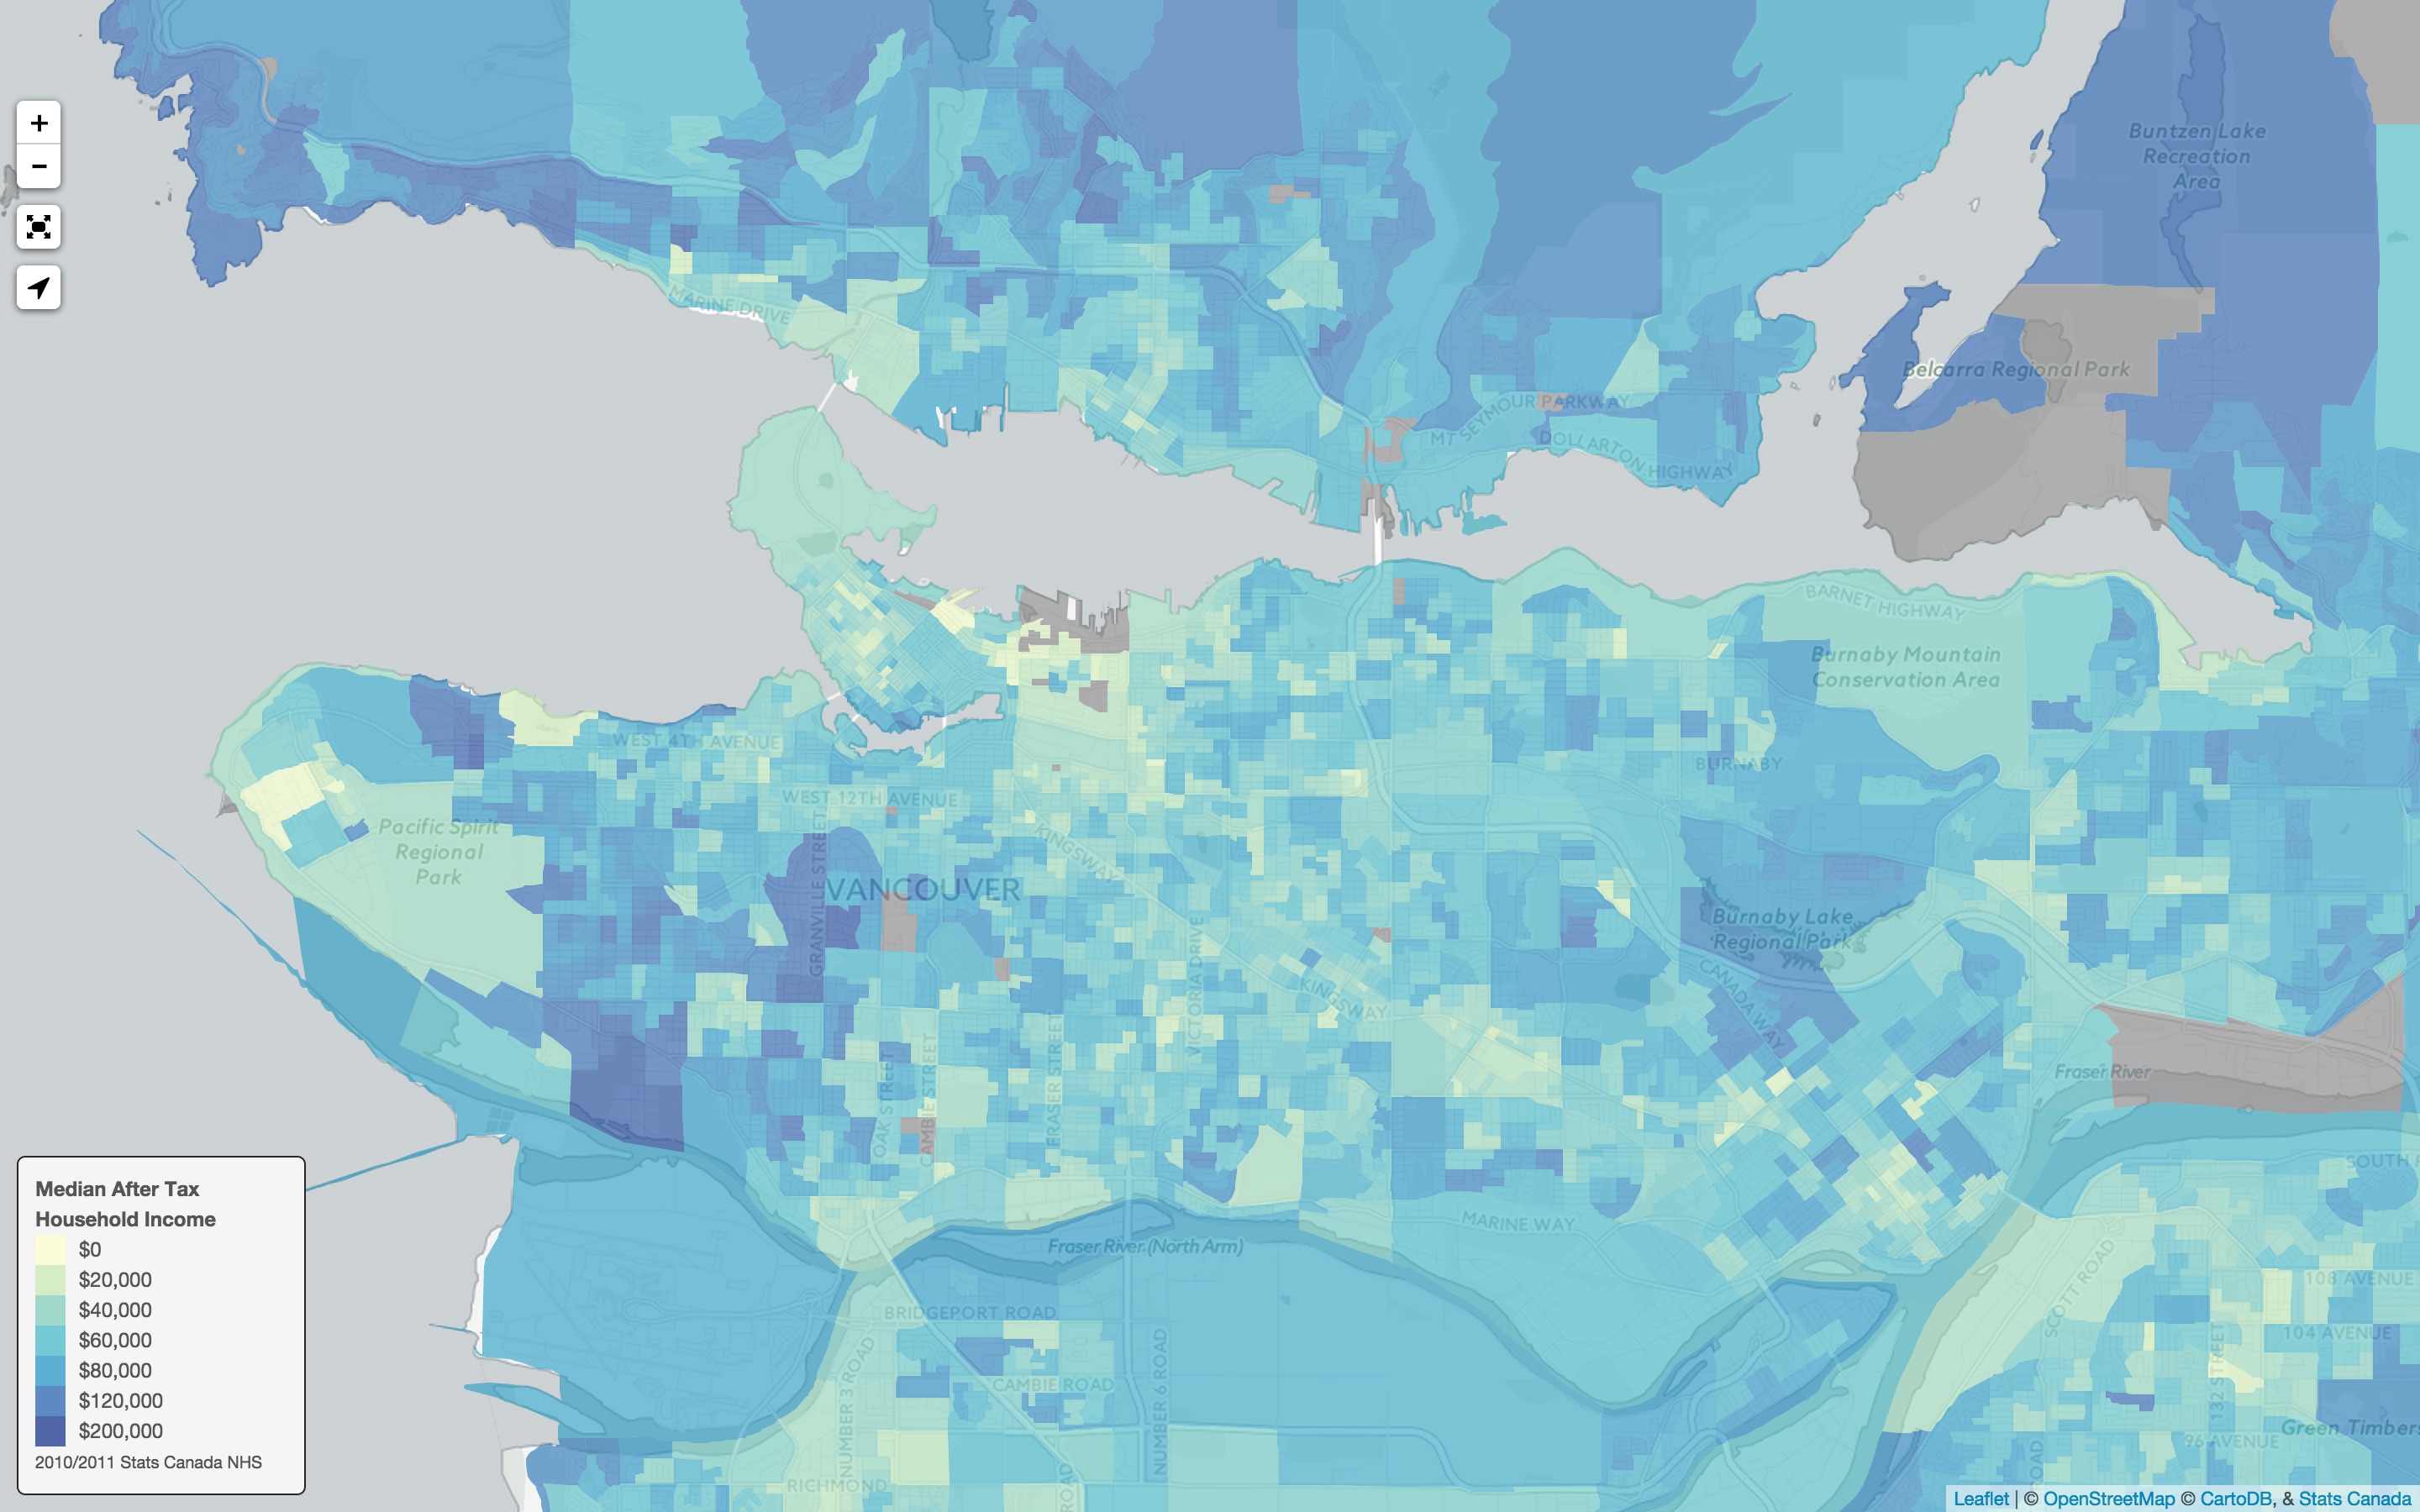
We estimate the median annual time cost of the commute by taking the ratio of the daily commute time to the daily work time, assumed to be eight hours, and multiplying it by the annual after tax income. That’s more or less the money the average person in that dissemination area makes in the time the person spent commuting. If there are several people in the household contributing to the income, there will be several people spending time commuting, so that effect roughly cancels out.
Annual Commute Cost
Putting it together we get the annual cost of the commute map.
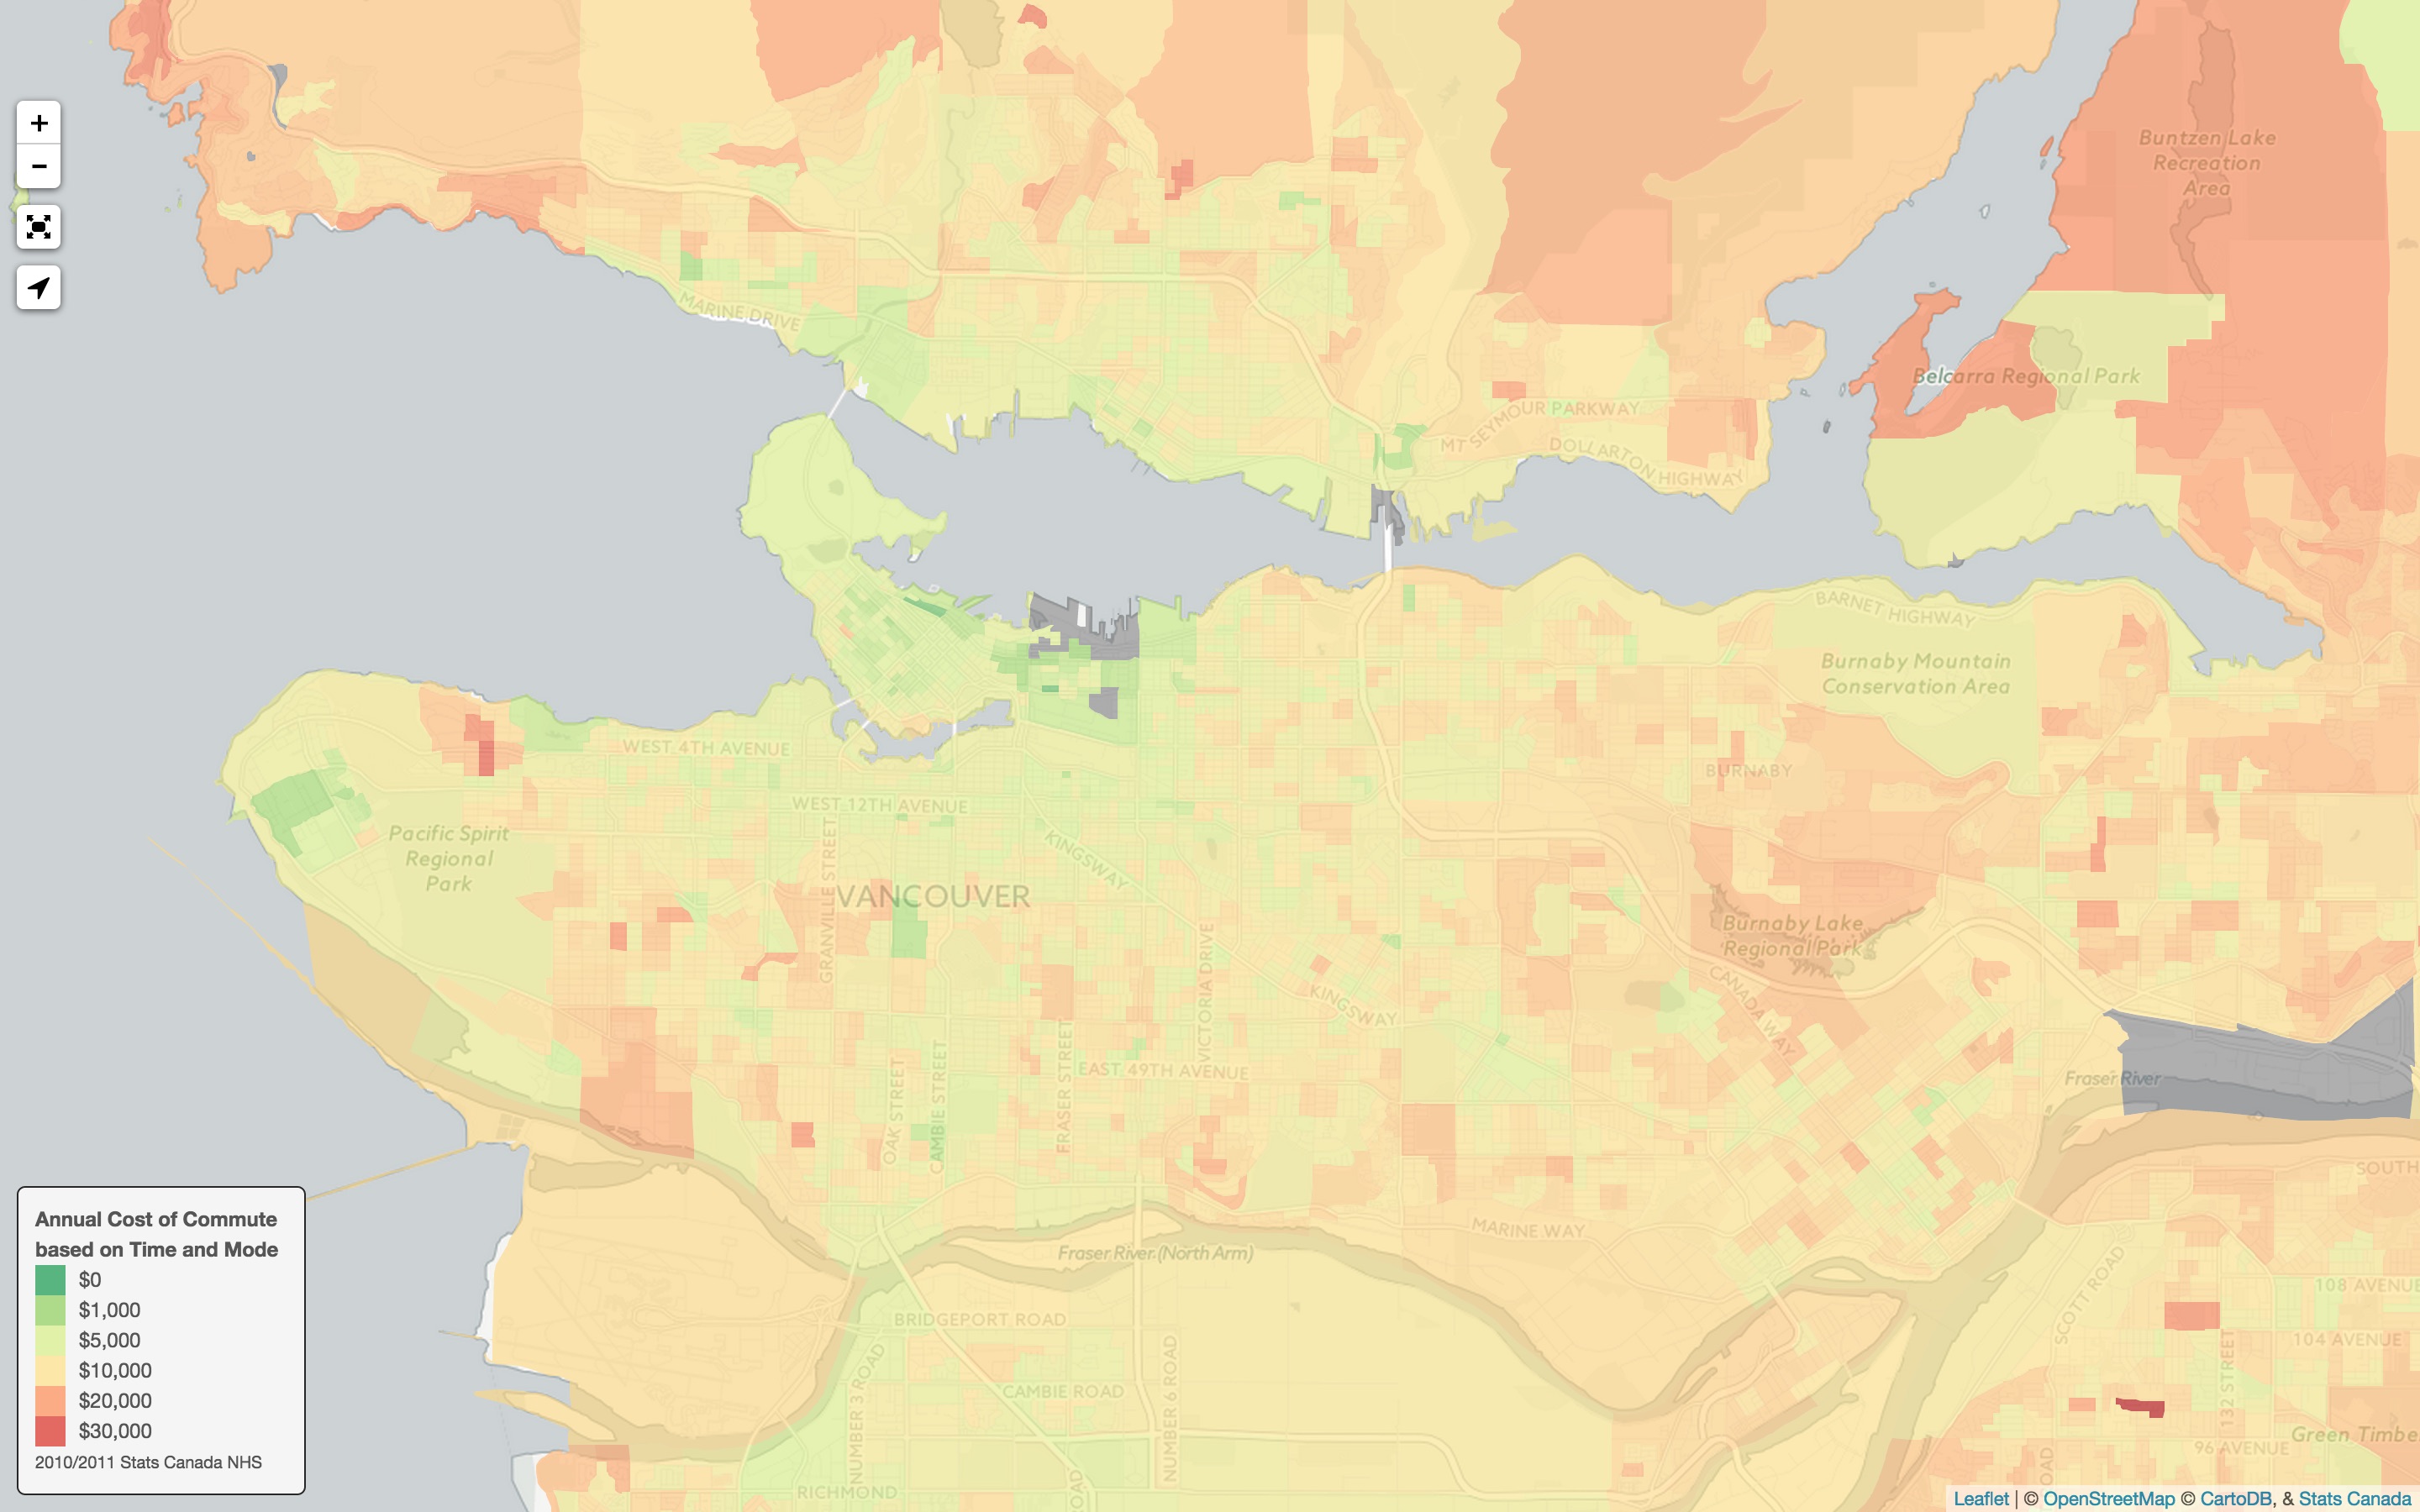
This is only an estimate. From a technical perspective we probably should have been working with averages instead of median values, but the result is very similar. Translating between time and money is inherintly tricky, most people can’t easily scale up or down the time they spent working to translate time into money. The easiest way to think of this is someone who tries to work less hours (and get less pay) in order to spend more time with their family. One way to do exactly that is to cut down on commute time.
Combined Dwelling Value and Commute Cost
Finally we have all we need for the end result. The Combined Dwelling Value and Commute Time/Mode Value Map where we simply add the estimated commute mortgage cost onto the dwelling value.
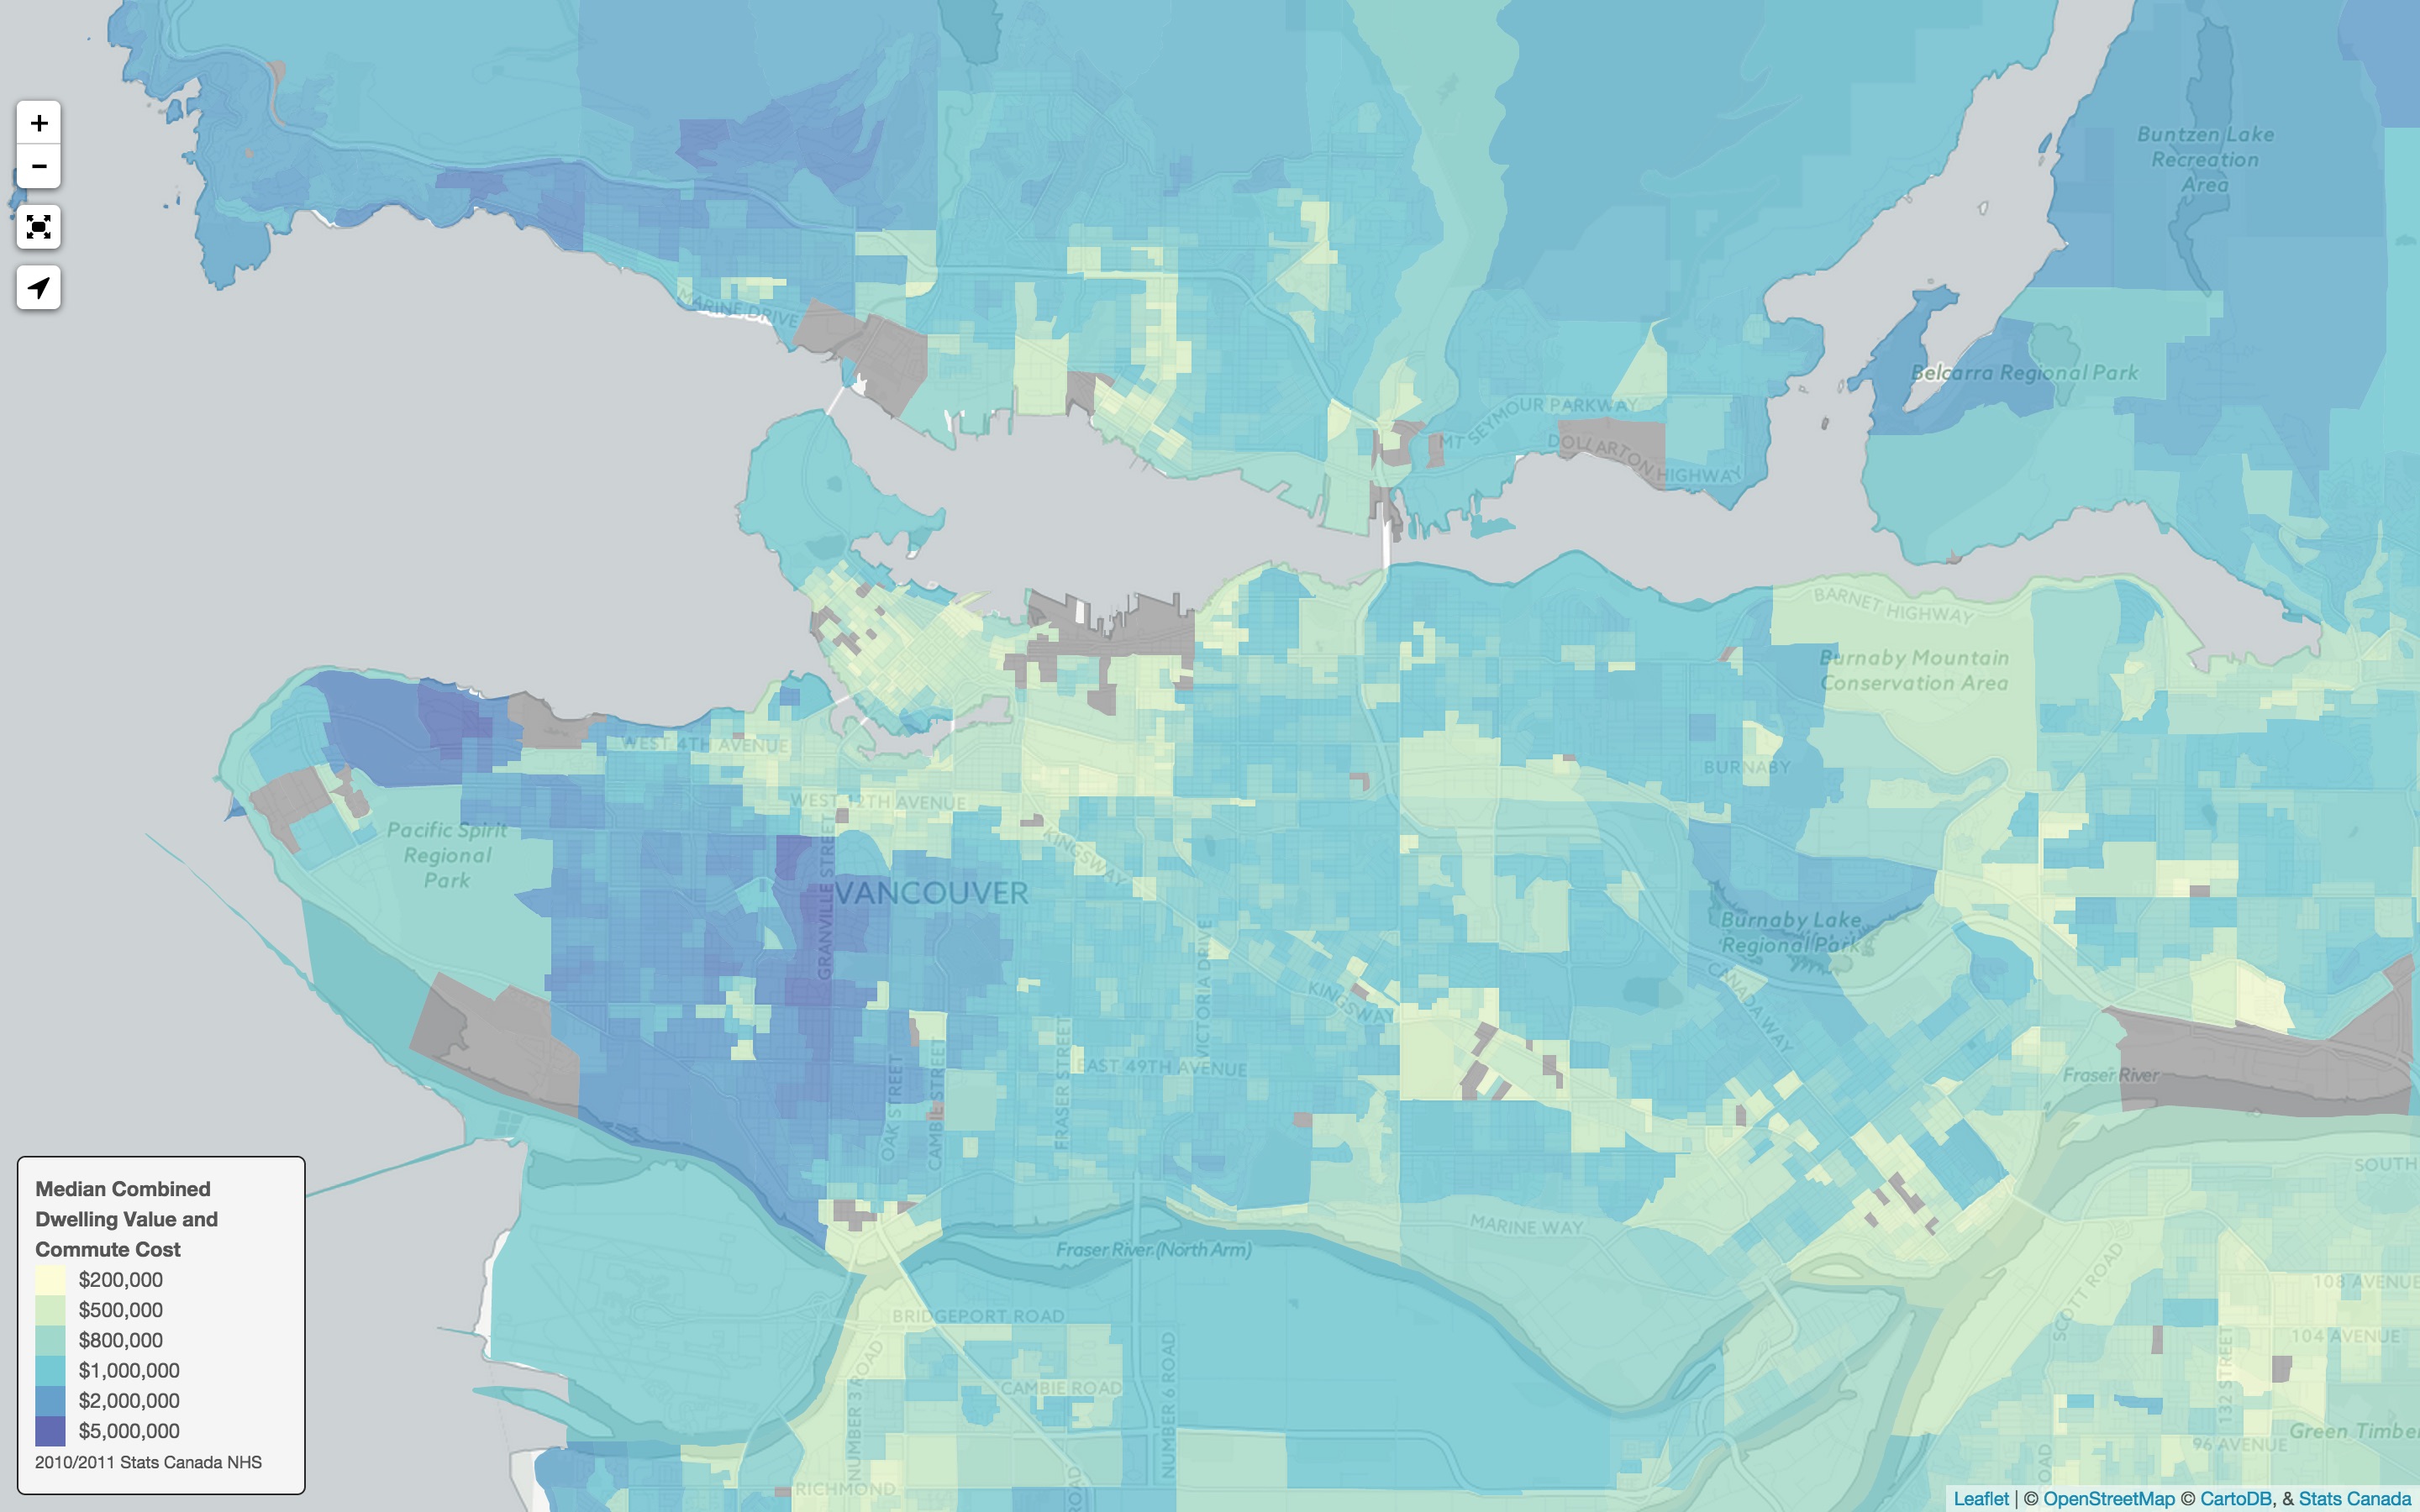
It does not look radically different from the dwelling value map. It’s almost the same around downtown where commute time tends to be low and more expensive further out, where the ‘hidden mortgage’ of commute time can add up to half a million dollars.
Using Census Data can only help illustrate the hidden mortgage that people are already paying. It can only highlight some general trends and ideas, it cannot make any statement about particular individual households, nor can the genral reasoning used to derive the numbers apply to everyone. Or maybe even most people. The estimates are quite rough, likely underestimating commute costs for drivers, not taking into account the well understood health benefits of active transportation nor the negative health implications of driving. The commute time to money computation is very rough and will have to be adjusted if applied to real-world examples. But this is only meant to illustrate ageneral point.
The takeaway should be that the ‘hidden mortgage’ is real, and it’s huge. And often overlooked.
Reuse
Citation
@misc{the-hidden-mortgage.2015,
  author = {{von Bergmann}, Jens},
  title = {The {Hidden} {Mortgage}},
  date = {2015-08-25},
  url = {https://doodles.mountainmath.ca/posts/2015-08-25-the-hidden-mortgage/},
  langid = {en}
}

