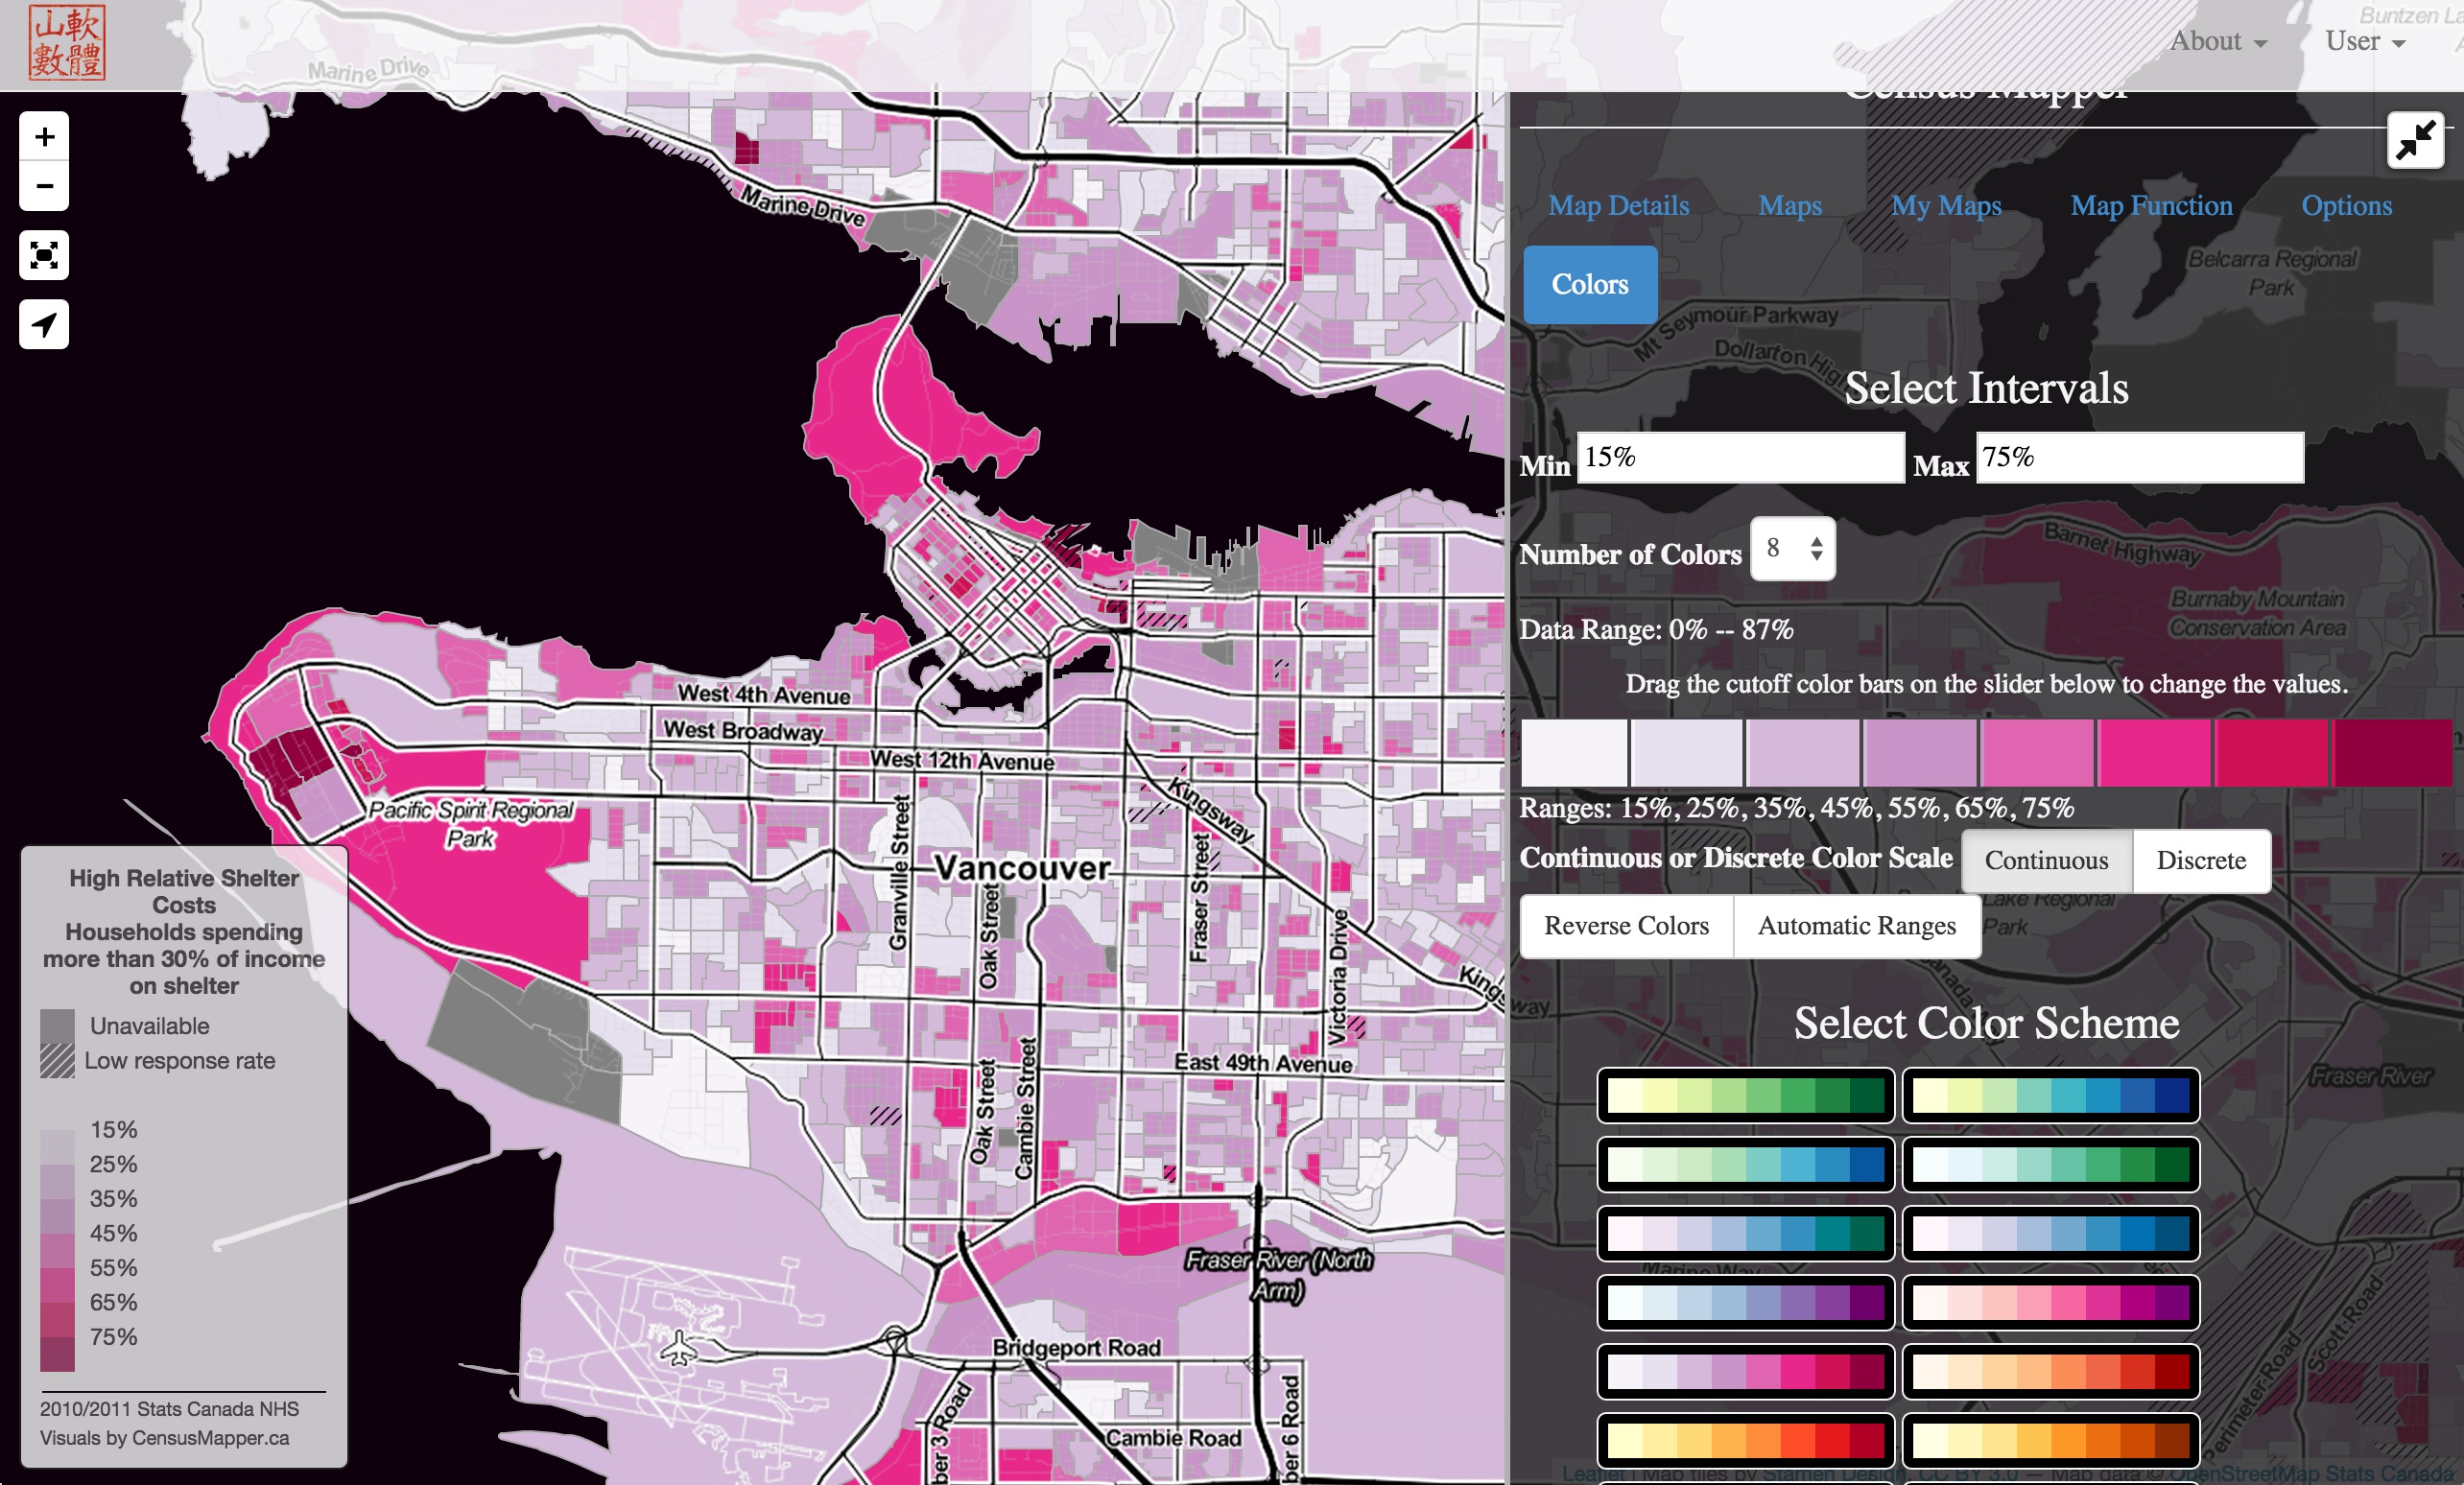
We are excited to announce CensusMapper public beta launch!
The project on mapping census data for Canada is entering the next stage. We are now mapping 3875 different variables from the 2011 census, or any combination of them, across 67215 geographic regions covering all of Canada.
We are opening up the Census Mapper to a limited public beta. Limited means that anyone can view maps created in CensusMapper, but we are only opening up the map creation tools to selected beta users.
Be aware that the web app makes use of modern web technology and renders large amount of data. It will only work on modern browsers, best viewed in Chrome or Safari. Firefox works ok, Internet Explorer might grind to a halt and should be avoided.

We are a little restrictive on creating maps right now for the simple reason that census data is somewhat tricky to understand and at this point we don’t have a comprehensive guide explaining all the variables and warning against many of the pitfalls. We are planning to slowly integrate this and open up the map creation tools to the general public.
Why CensusMapper?
Census Canada data is extremely rich and useful in many cirumstances, but it is not being widely used. There are many reasons for this, the somewhat unmanageable amount of data being one of them, the difficulty of accessing and standardizing the in principle freely available datasets is another.
Census data is inherently geographic in nature, working with the data without proper visualization tools can be challenging too. And even for people that have good access to the data and that are well-versed in mapping geographic data, it can still take quite a bit of time to generate maps visualizing the data. CensusMapper greatly speeds up this process by allowing straightforward mapping of any function derived from census variables through all geographic aggregation levels Canada wide.
Storytelling
Census mapper does more than just mapping census data. It is designed as a storytelling tool. Few maps are so crisp and clear that they are self-explanatory. A map of population density might fall into that category. But most census variables are sufficiently complex that maps derived from them warrant narration. We think of CensusMapper as a storytelling tool that allows ‘readers’ of the map to interact with it, zoom in, zoom out, pan around, and jump to other maps linked in the story provided by the mapmaker.
Directions
There are many ways to expand on this. On the map creation side we can offer more diverse coloring tools, allowing user input and user defined map locations to be used in the mapping function, add data from previous census. We could allow limited upload of user data to be integrated with census data, statistical and spacial analysis tools, custom mapping projects.
Reuse
Citation
@misc{census-mapper.2015,
  author = {{von Bergmann}, Jens and Cervantes, Alejandro},
  title = {Census {Mapper}},
  date = {2015-09-28},
  url = {https://doodles.mountainmath.ca/posts/2015-09-28-census-mapper/},
  langid = {en}
}
