Next steps in CensusMapper
The Census Mapper Project is moving along slowly, public beta unearthed some bugs and we gathered feedback (thanks to everyone reporting back!). There are still a couple of steps that need to be taken care of before we can unleash the full map making power to all users. We feel that the complexity of census data requires more guidance than the current map making system is providing. Anyone who does not mind getting there hands dirty and having to look up census variable definitions by themselves when making maps is welcome to contact us and we will hook you up with a beta mapmaking account.
In the meantime we added one important feature to the CensusMapper.
Content Drilldown
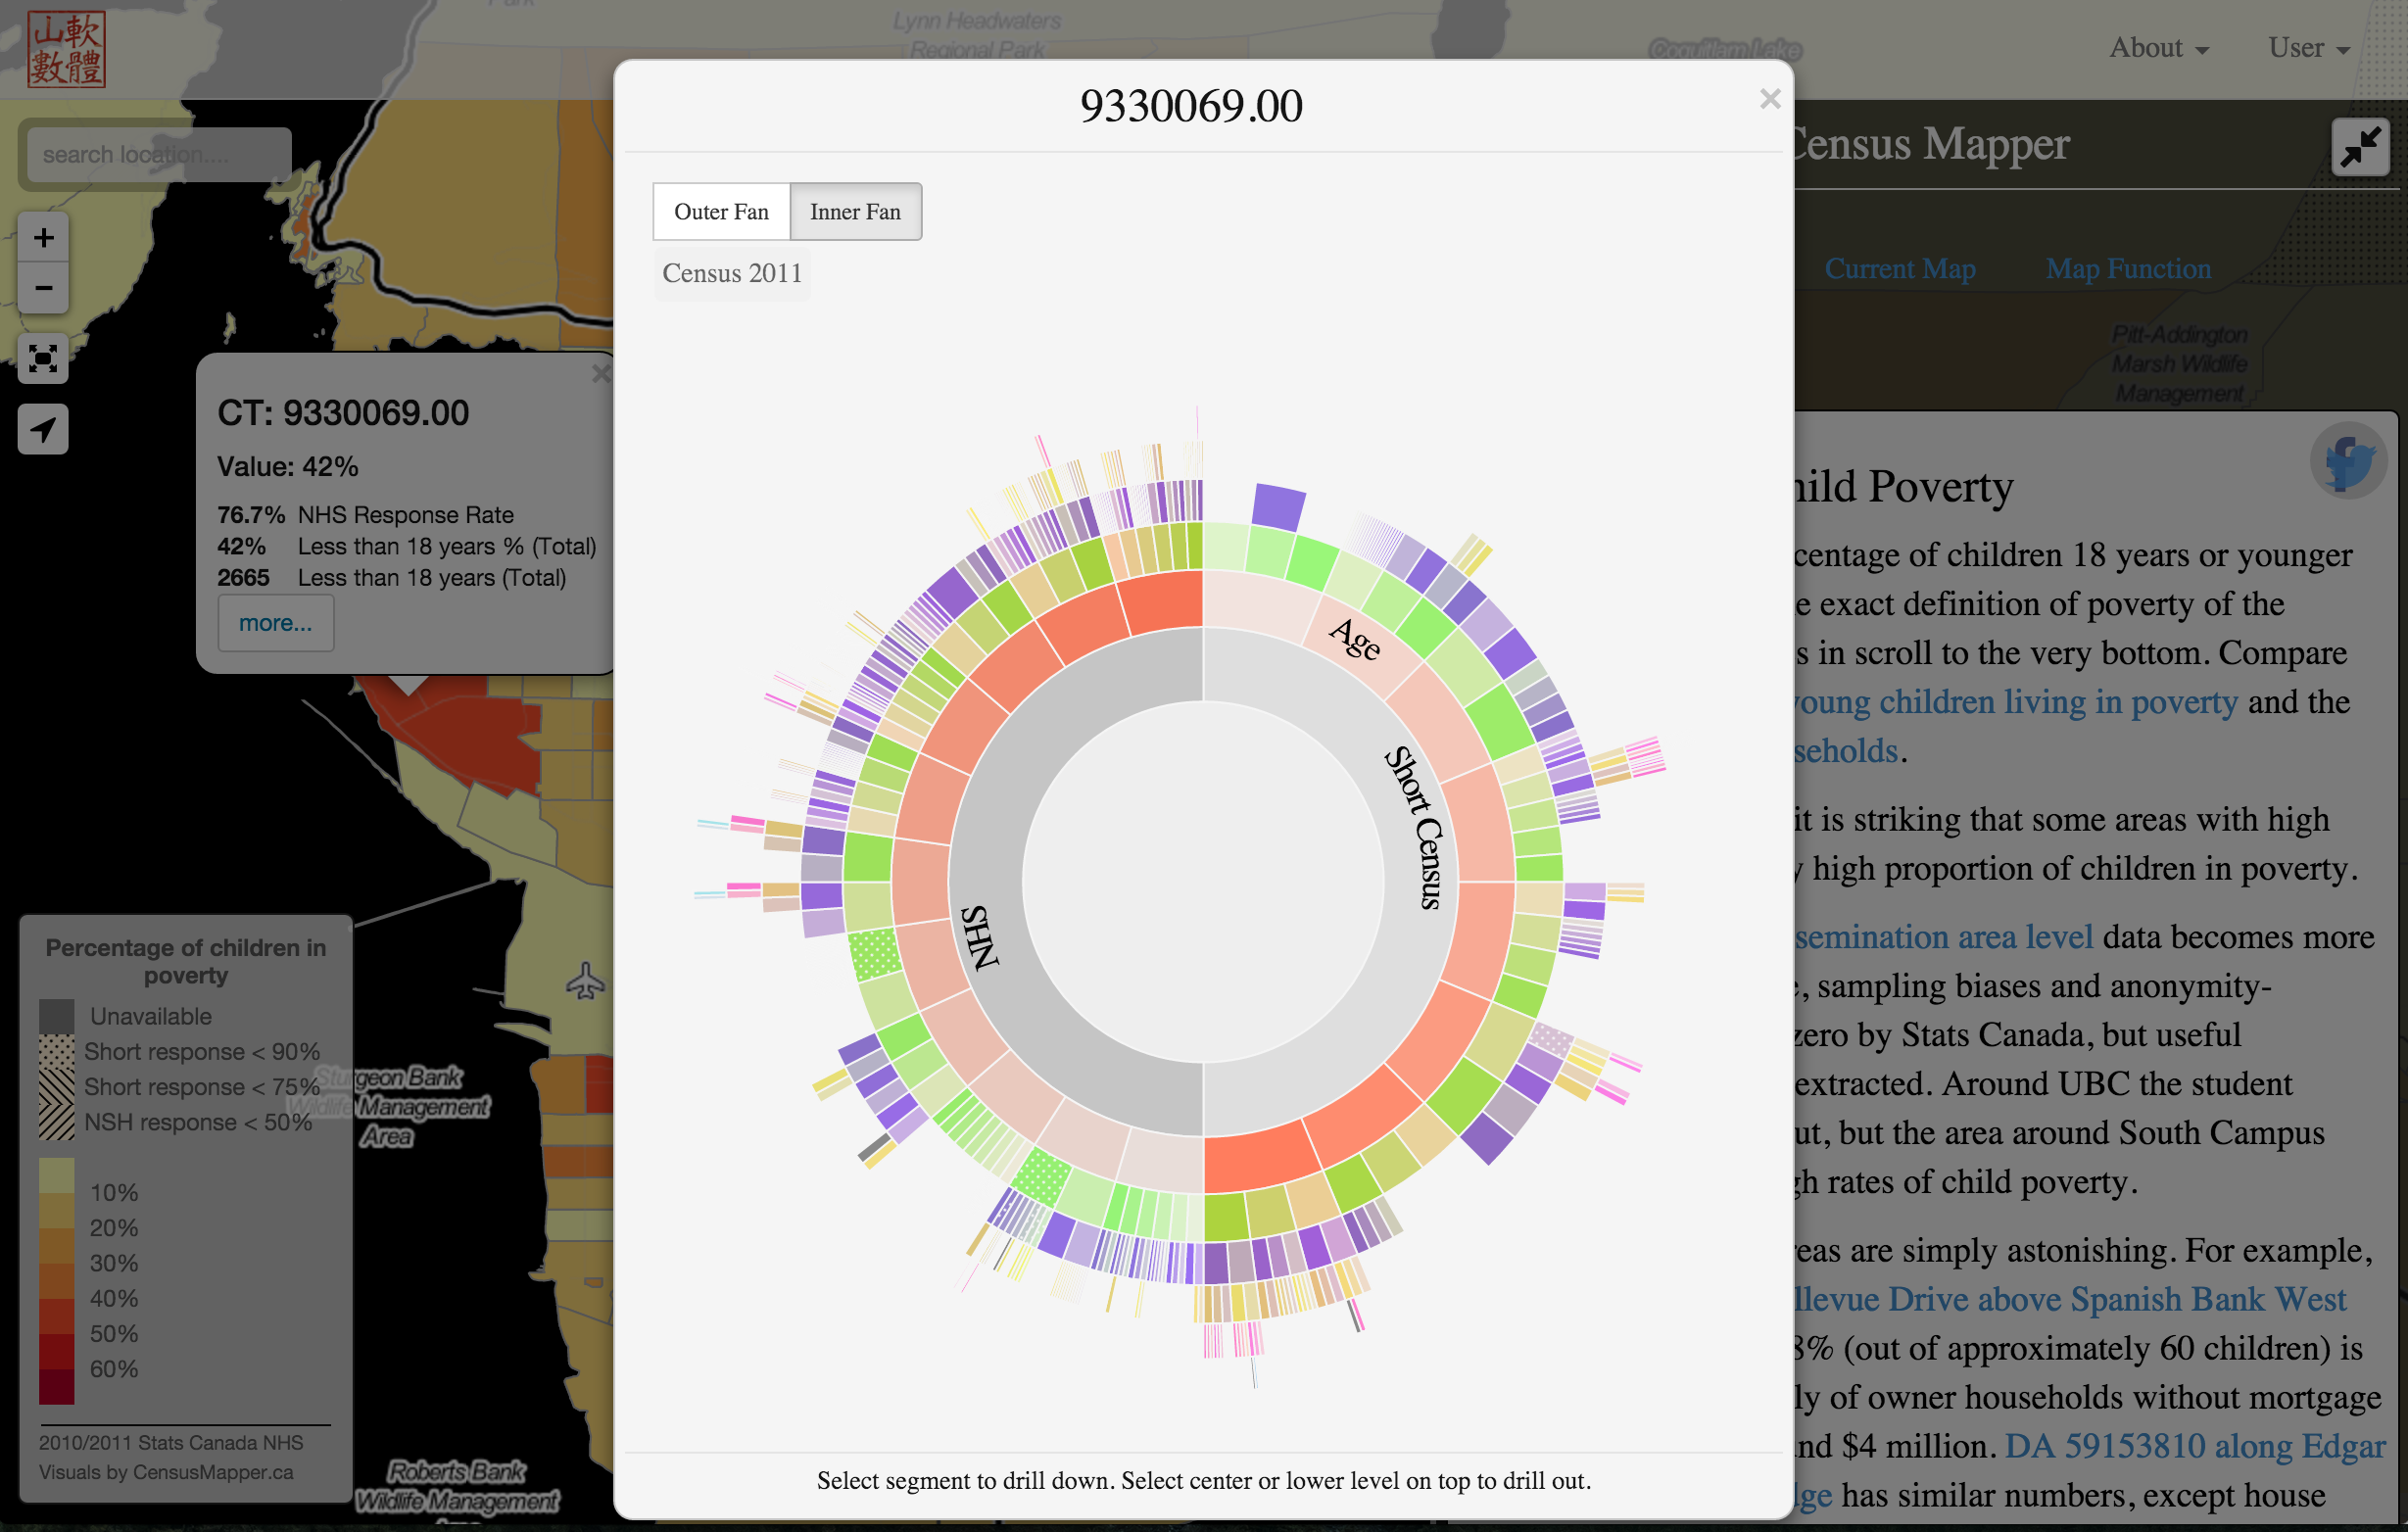
CensusMapper is a great way to explore single census variables (or a single function built out of census variables) across many geographic regions and aggregation levels. But sometimes we would like to do the opposite: Drill down into a specific census region and explore other census variables. We have now added an easy way to do this. To access it simply select the “more” button in the basic popup when you select a census region. This brings up the census wheel, which is our way to navigate through census data. 
Try it out right away on CensusMapper or read on for details on how this works.
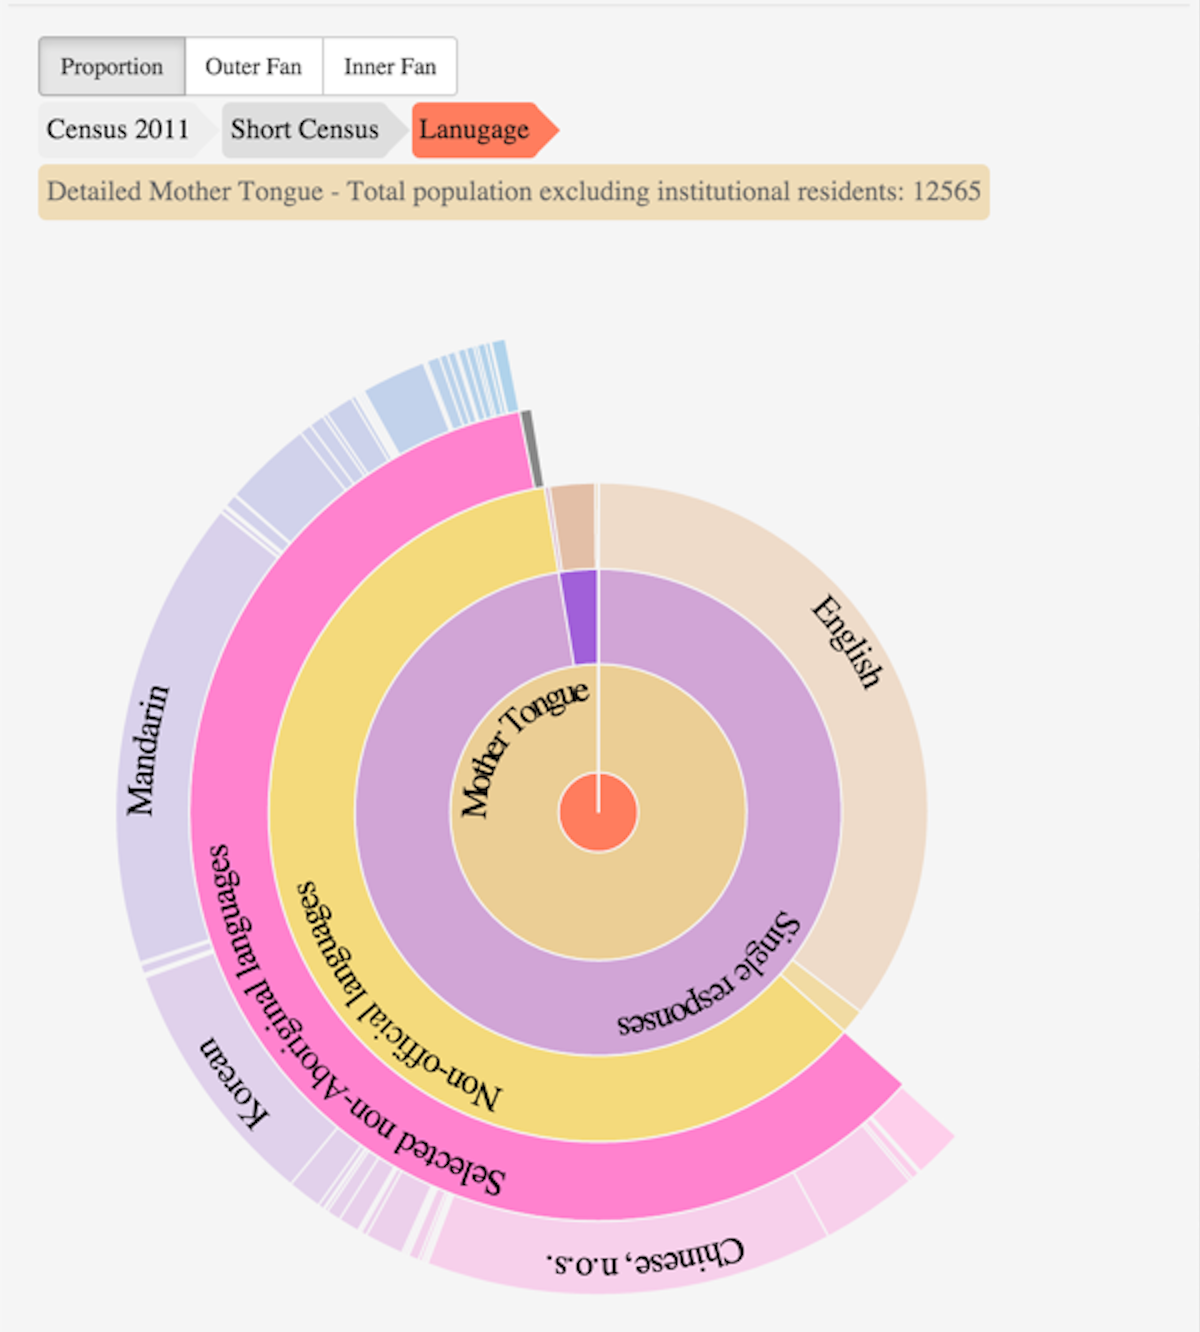
There are almost 4,000 census variables available, right now we do not offer to split up by gender, which reduces the available variables to 1,429. To further simplify things we throw out all variables with zero values for the give geographic area, still leaving a sizeable number of variables to browse through.  Each arc in the census wheel represents a variable, or a category of variables. Selecting an arc will zoom into that arc and turn it into the “center” of the wheel, collapsing all other components. That’s the content drilldown process. Once it makes sense to display data as proportions, we switch to the proportional view which shows the data as hierarchical pie chart.
This gives a visual representation of the proportions of each of the variables. Hovering (or touching) an arc will display more detailed information, selecting one will drill down further. To reverse that process either select the center or us the content breadcrumbs at the top that were created during the drilldown process.
#Data Problems
Census data is messy. Now that all census data for each region is generally accessible in CensusMapper we need to explain some of the inherent data problems.
##Rounding
Census Canada will round (almost) all data to preserve anonymity and don’t create false impressions of accuracy that the data does not achieve. Data is generally reported in increments of 5, rounding includes randomness to preserve anonymity. The value of the measured value is within 4 of the reported one. And remember that even the measured variable is only an estimate of the actual value of the variable. Rounding may lead to situations where, for example, the sum of all people listed by age bracket will not add up to the total number of people. Generally, this difference will be small and we ignore it in our visualization.
##Omitted Data
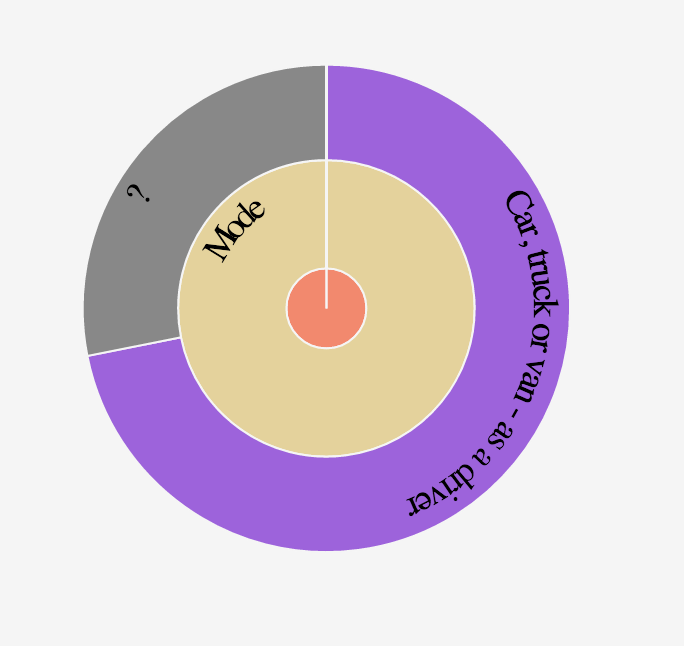
Census Canada will at times not report data. This could be due to very low return rates or other problems that make data so unreliable that it is better not reported at all. Or it could be that releasing the information could compromize the anonymity of the census data for some people in that area. The latter can take the form of Census Canada not reporting any data for the region, or Census Canada zeroing out specific variables that “are too low to be reported”.  We have not been able to find clear guidelines how the “zeroing” works, but often this will leave detectable traces in the data. Looking at the example in the image, looking at “Mode of Transport” to work only “Driving” has non-zero values, the other options “Passenger”, “Transit”, “Bike”, “Walk” and “Other” are all zero. There were 160 people getting to work, 115 are listed as “Driver”, leaving 45 unaccounted for. This is outside of the range that could be explained by the rounding of variables. We alert the user by adding in a grey area for the missing 45. This also ensures that the visual representation remains accurate.
##Multiple Responses
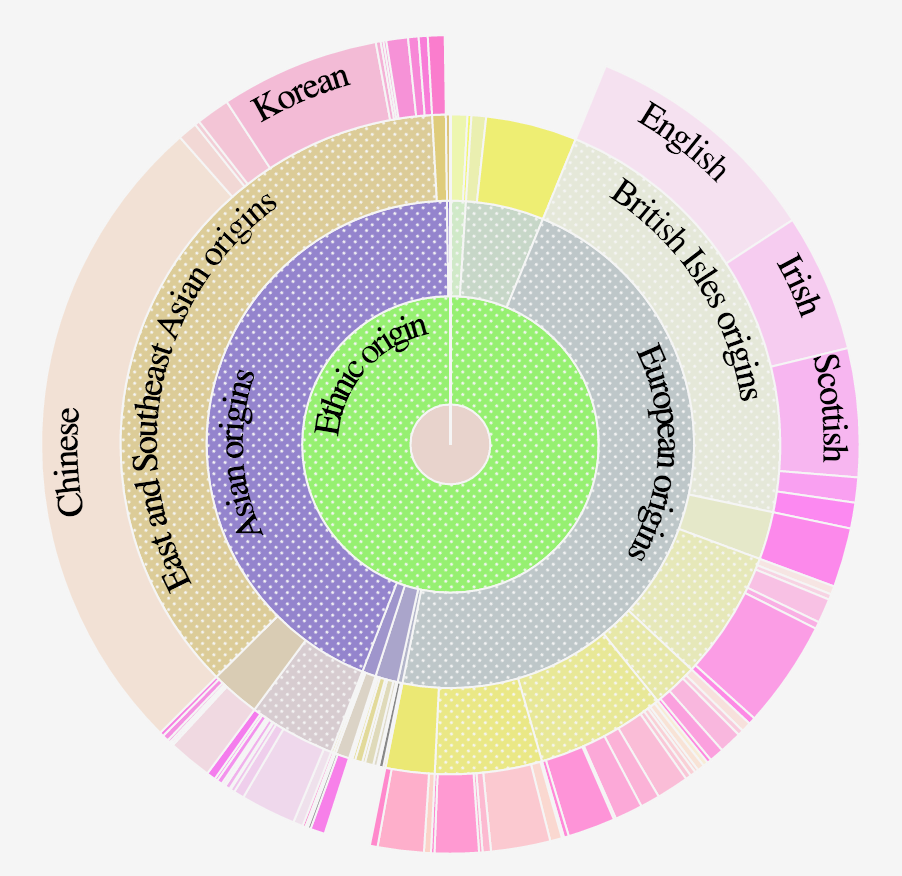
Some census questions allow for multiple responses. For exaple “Language Spoken Most Often At Home”. In this particular case the census variable breaks out single responses and multiple responses and is very transparent to the user. In other cases, for example “Ethnicity”, single and multiple responses are not reported separately but responses are all added up. This leads to the sum of lower level variables being higher than the base variable. We alert the user to this by overlaying small white dots on the base variable.  In this particular case the total for for “Ethnic Origin” was 12,140 people. But there were 1,430 more responses at the next level, so up to 1,430 people had given multiple responses to this question listing more than one of the aggregate (mostly continent level) origins, some possibly listing more than two. The same patter repeats at different ethnic origin aggregation levels, for example 2,565 people claimed at least one of the “British Island origins”, but many listed more than one resulting in the sum of the individual regions with the British Islands exceeding the British Island count by 1,445. Again, we alert the user by overlaying dots over the “British Island origins” arc. Hovering over the arg will display the exact numbers of the “overcounting” due to multiple responses.
In these cases where mulitple repsonses are not broken out the dots will aler the user that the proportional representation in the hierarchical pie chart does not represent proportions out of a total given by the value of the variable at the centre (or lower level), but as a proportion of all responses which exceeds the value of the lower level variable.
##Basic Census
The Basic Census is generally speaking quite reliable, every single person is required to fill it out and return rates are generally above 95%. Serious problems will only occur if response rates are very low. We alert the user by shading geographic regions is this has been the case.
##NHS
The National Household Survey is quite different in nature, it was only sent out to a smaller portion (~30%) of society and return rates were much lower (~69%). Even with 100% return rates there are likely to be geographic regions where the results severely misrepresent reality in that region due to sampling bias. For each region that bias is small, but the probability for bias grows as the number of people in the geographic region declines. So this is mostly a problem for Dissemination Areas. But even there, the probability of severe sampling bias in each region is small, but there are many regions and the probability that some of these regions suffer from sever sampling bias is quite large.
On top of this basic statistical sampling bias, we also have self selection bias due to some deomgraphics being more likely to return the survey than others. This bias is a product of the decision of scrapping the madatory ‘long form census’ and replacing it with the voluntary NHS. The return rates can give some indication of the likelyhood of self-selection bias, we shade regions with a non-return rate lower than 50%, the cutoff Census Canada set for reliability of the NHS. It is especially problematic when trying to detect change in variables (for example poverty) from one census to another as the differences in the variable over time are often small and similar in magnitude to possible self-selection bias.
The 50% cutoff we highlight in CensusMapper is just a guideline, the exact return rates are displayed on hover or when selecting regions and should always to be taken into account when interpreting results, especially at the Dissemination Area level.
If all this information did not turn you off, head over to CensusMapper and drill down into some geographic areas.
Reuse
Citation
@misc{census-drilldown.2015,
  author = {{von Bergmann}, Jens and Cervantes, Alejandro},
  title = {Census {Drilldown}},
  date = {2015-10-24},
  url = {https://doodles.mountainmath.ca/posts/2015-10-24-census-drilldown/},
  langid = {en}
}
