 The friendly folks at Vancouver Open Data just updated their property assessment data with the fresh 2016 property tax assessments. Time to run the script to update the Vancouver Assessment Map with the new data. And for good measure I pasted over some of the thematic map engine from CensusMapper to improve the mapping performance.
Maps
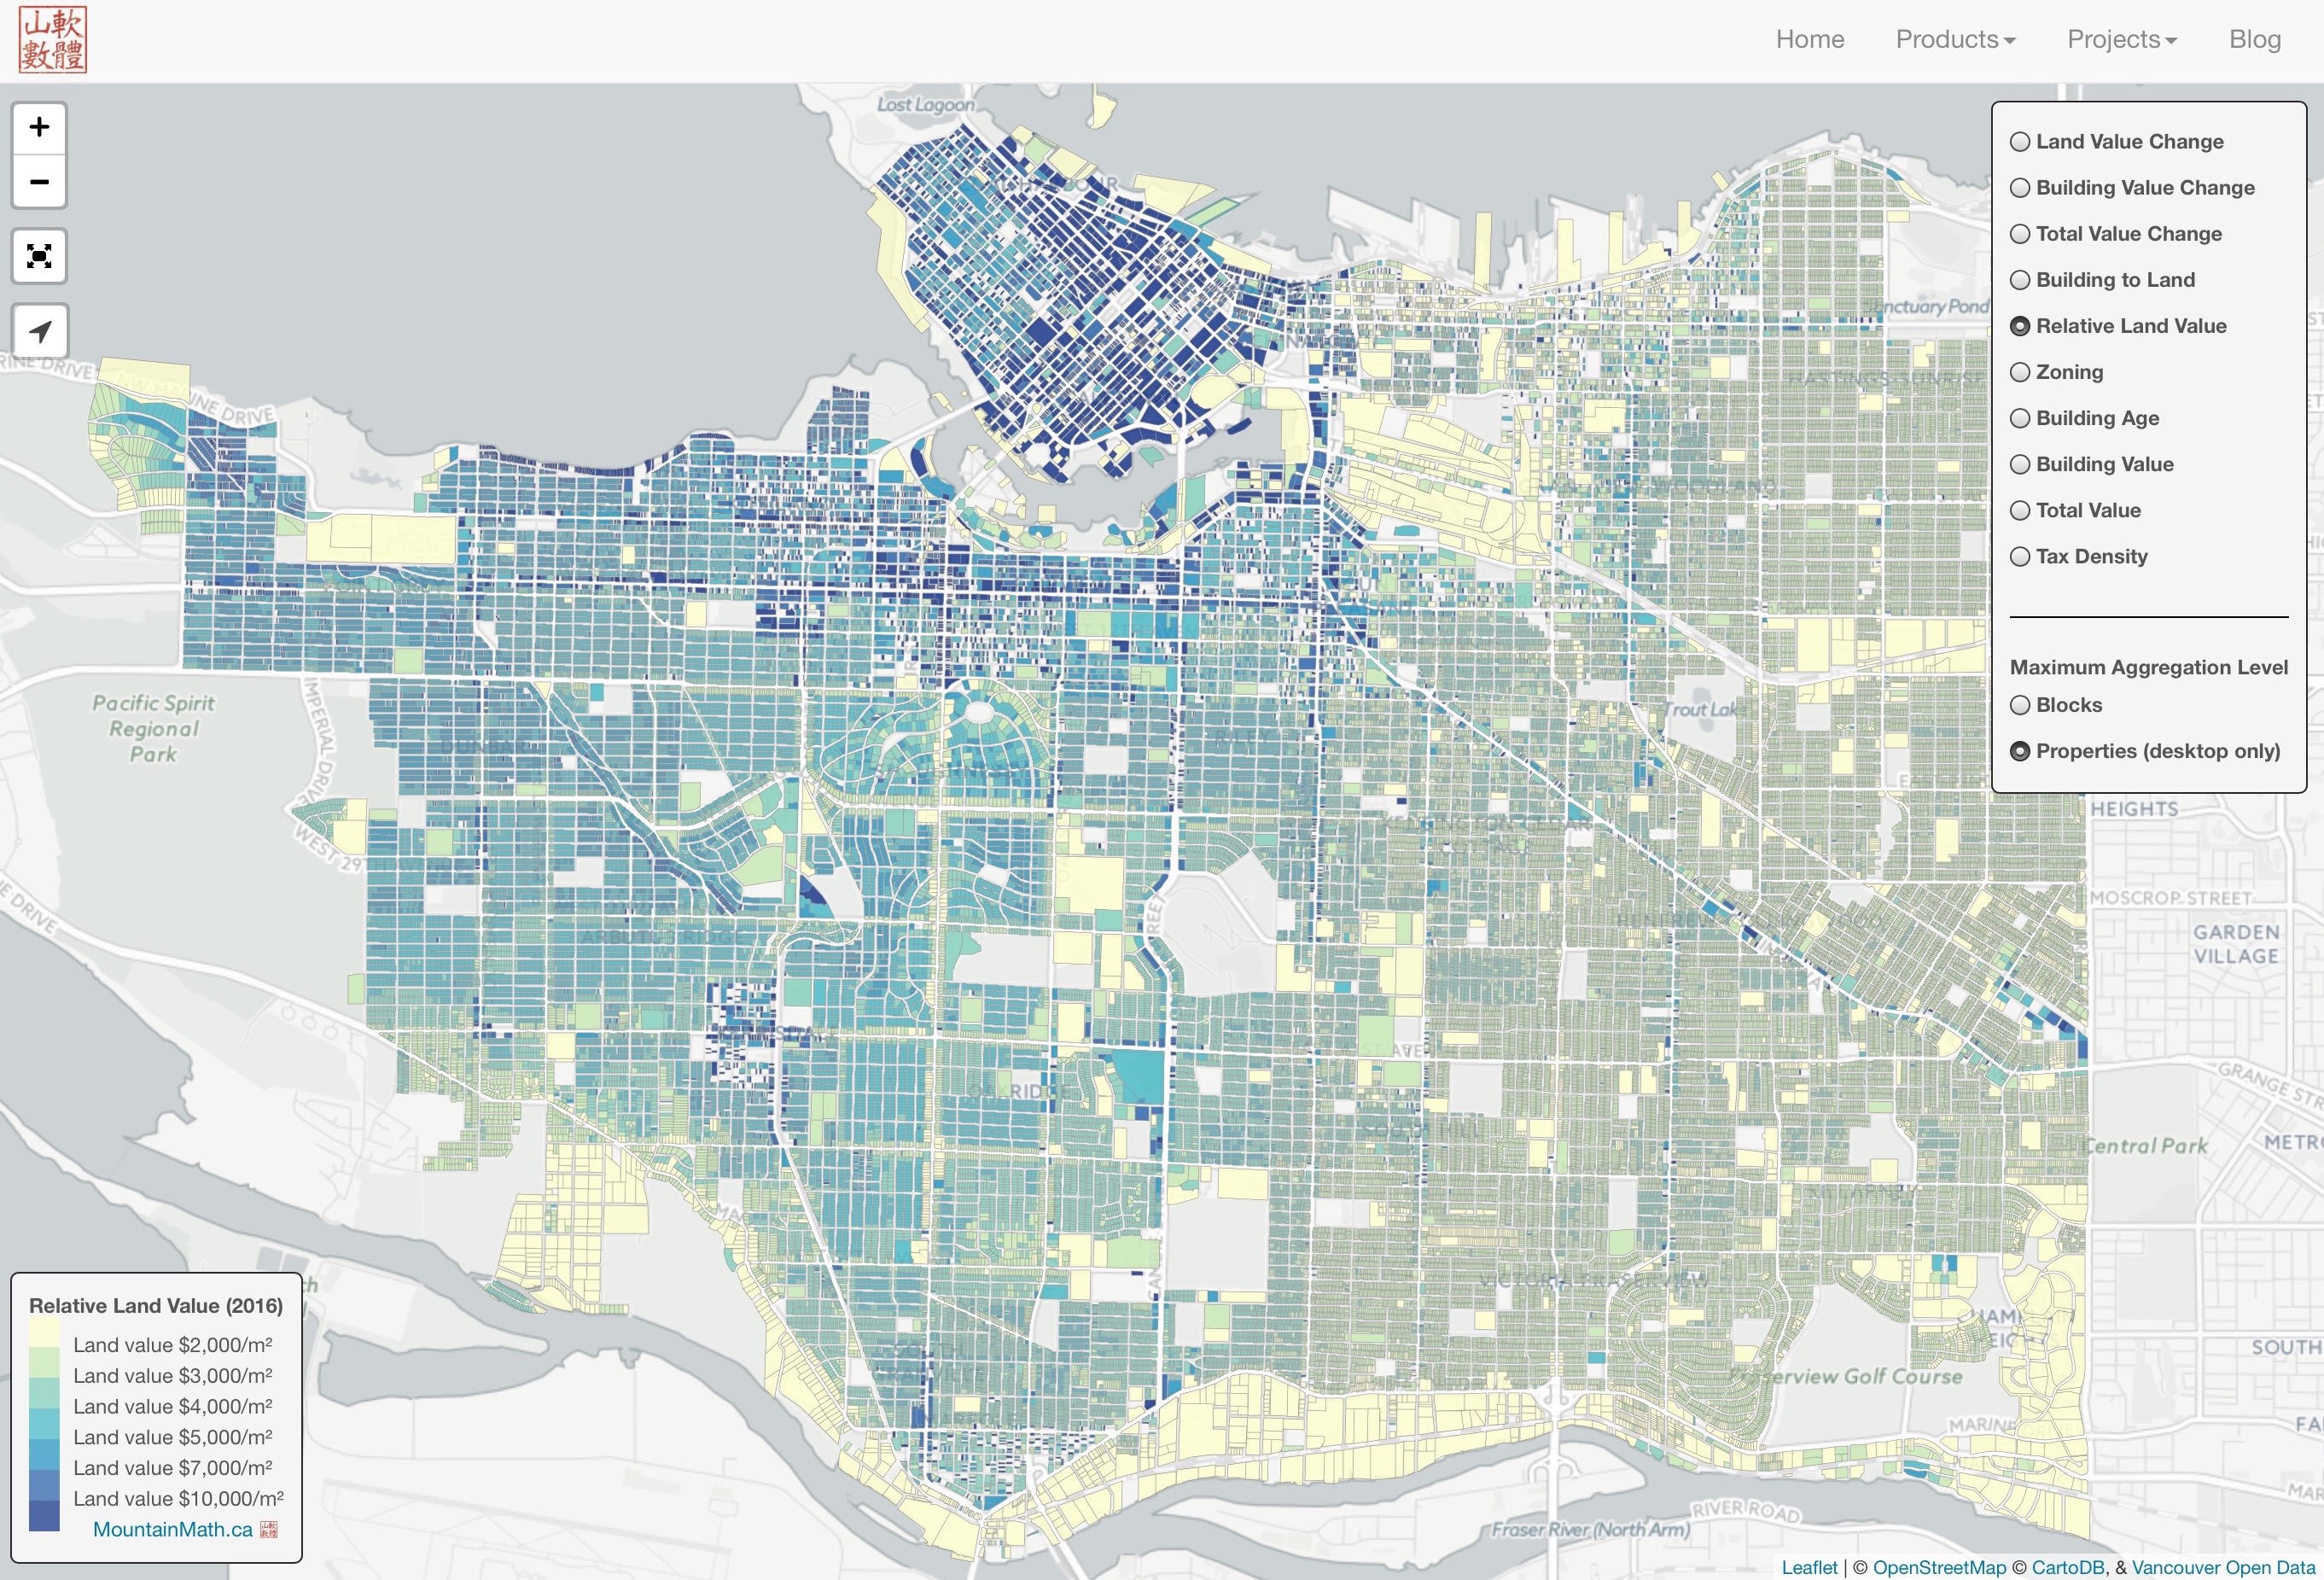
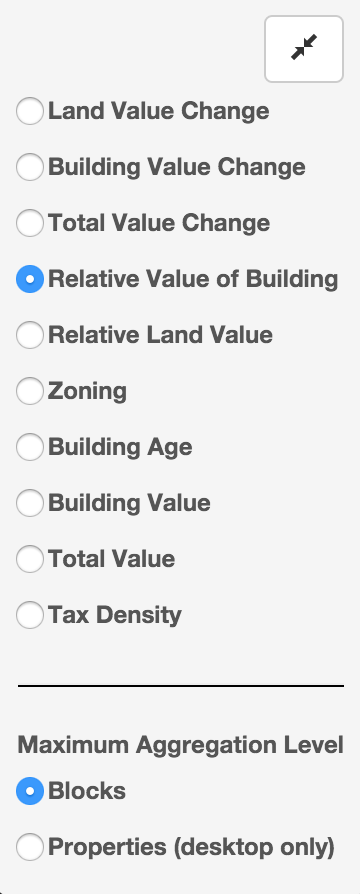
 The interactive assessment map offers several views. In the panel on the top right we can select how to view the data. It offers standard thematic maps for value change, total value, building value and building age and zoning. And there are some options that warrant more explanation:
- Relative Land Value: The colours on the map show each property by the land value per m². We can immediately spot the east-west land gradient, as well as how zoning affects land value. When zooming in we also see the effect of lot size on land value.
- Tax Density: This map looks at the tax dollars collected by the city by area. It tells us the relative rate at what each property is contributing to city services. We can again observe the impact of exclusionary zoning.
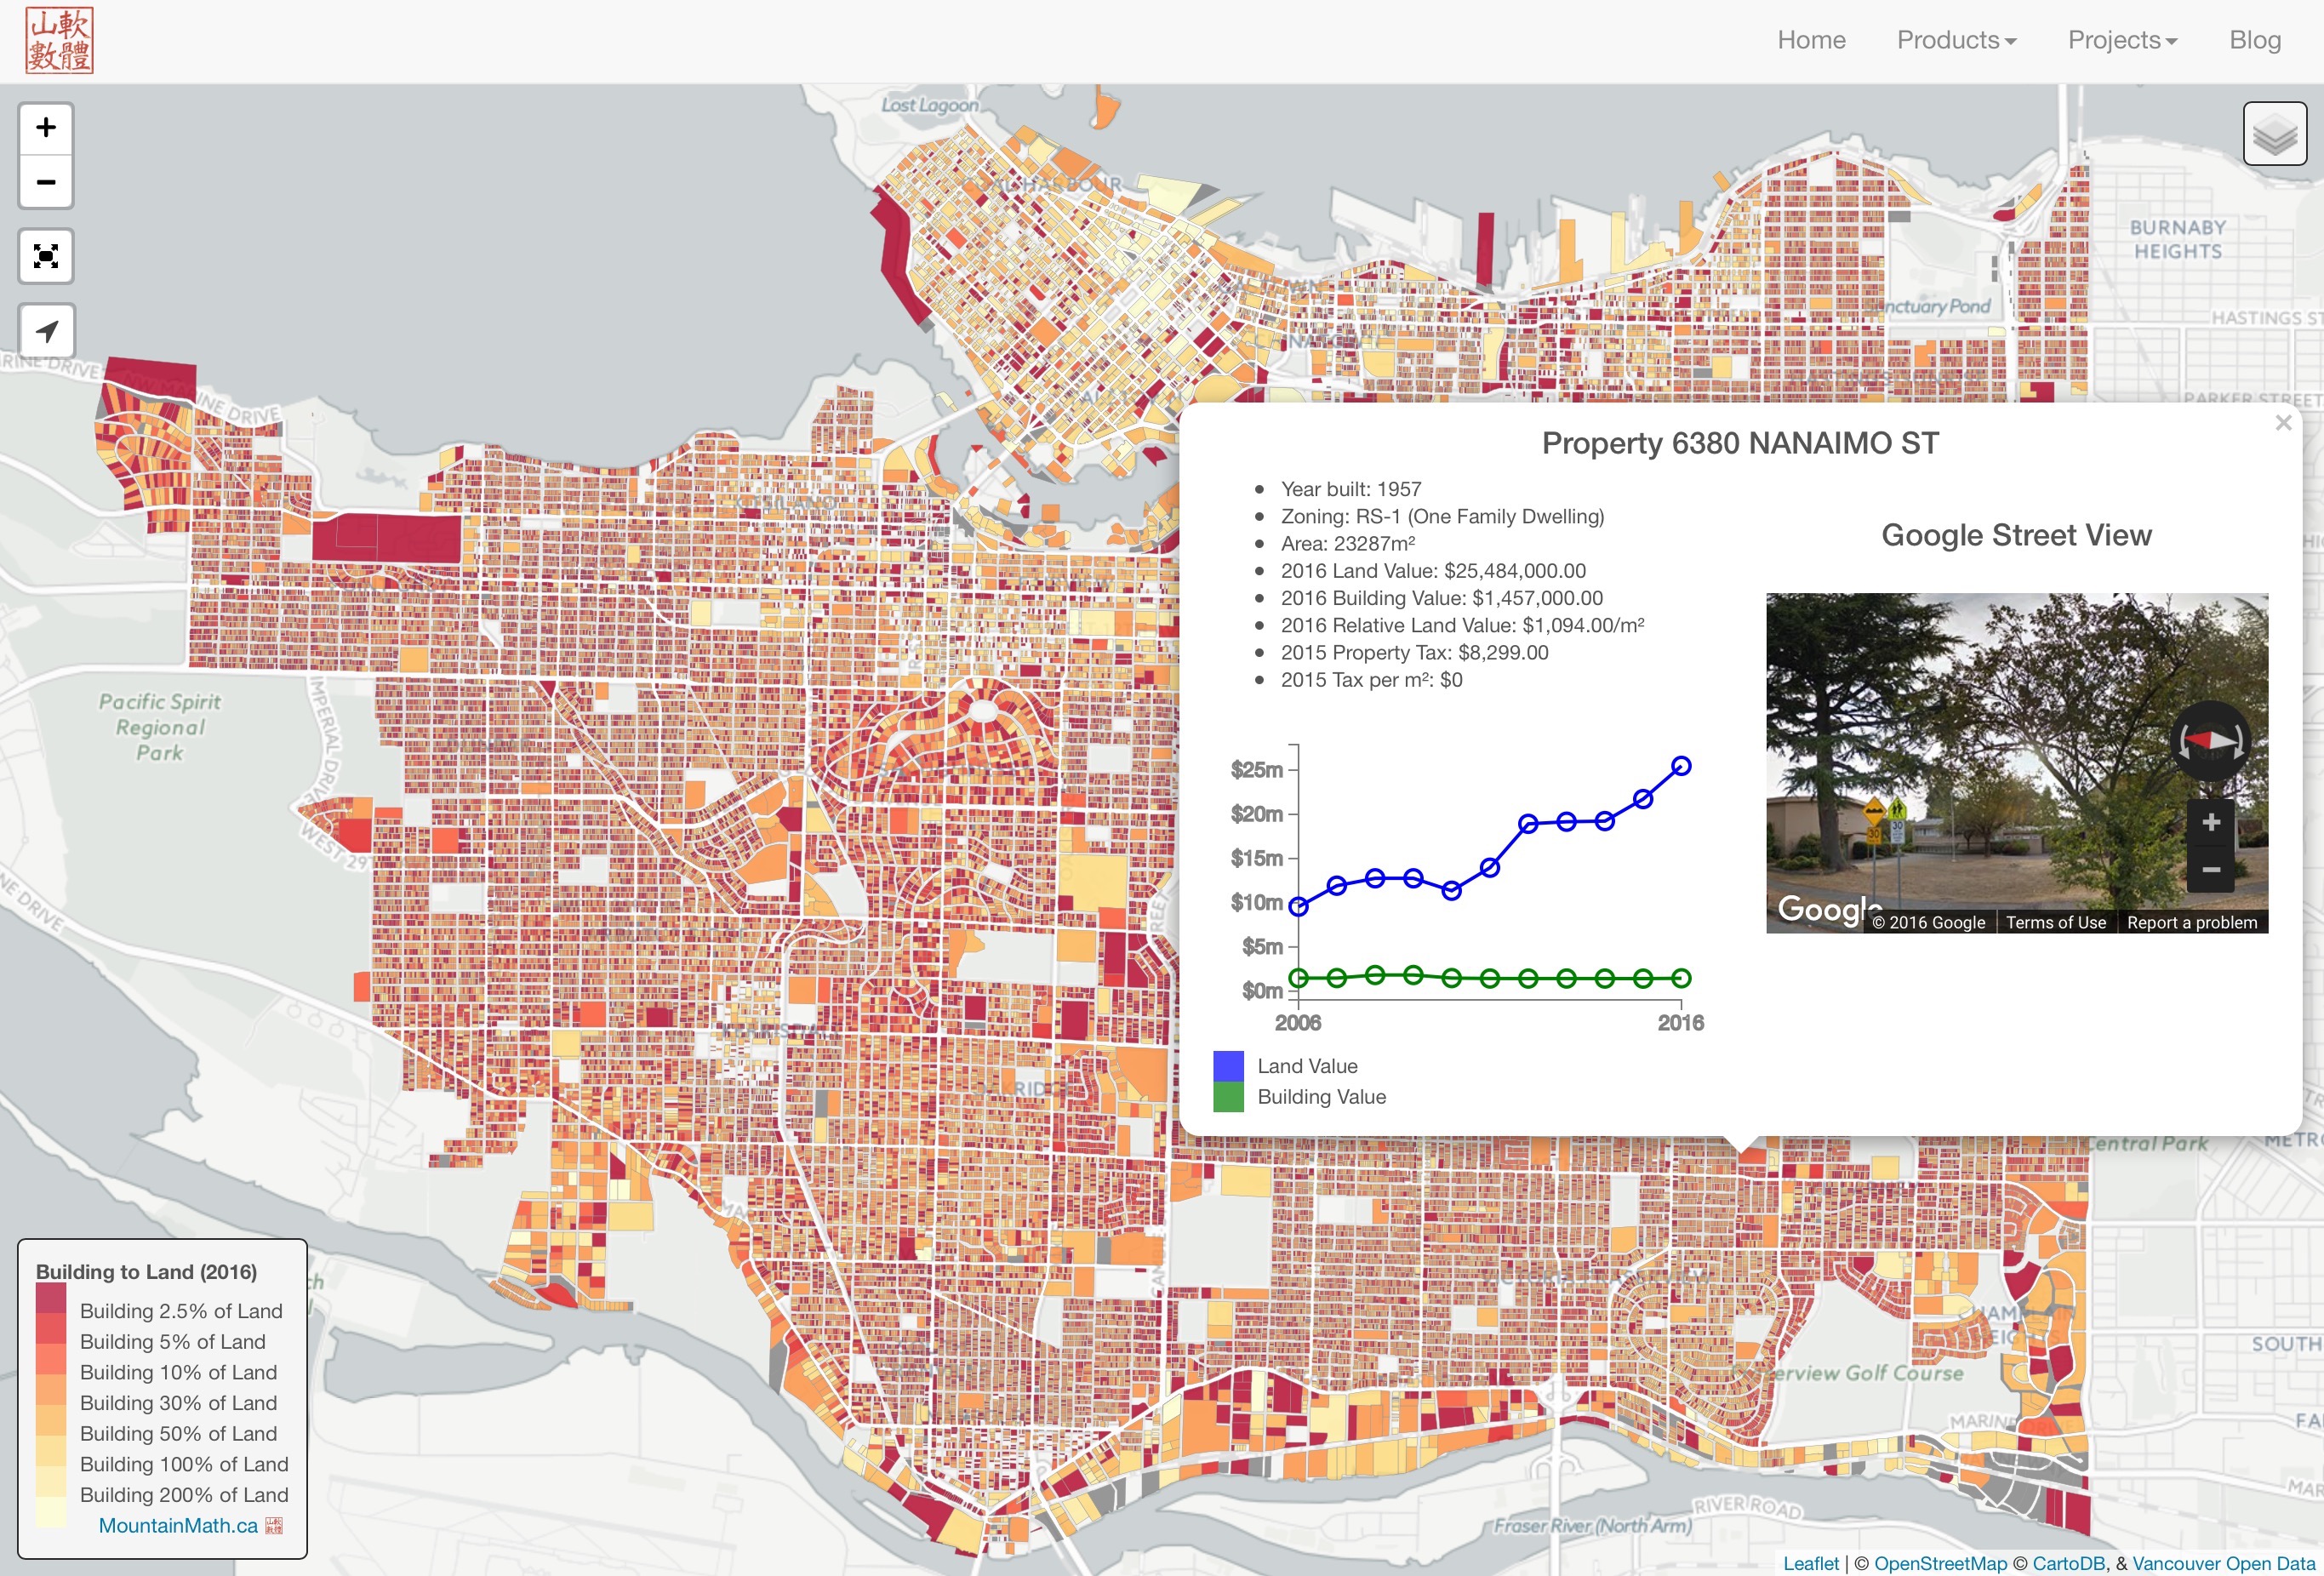
- Relative Value of Building:
 This map simply divides the building value by the total property value. There are many ways to interpret this map, my favourite is to use this as a “Teardown Predictor”. Essentially, as the percentage of the building value approaches zero the probability that it will get torn down in the near future increases. Imagine someone spending $1.5m to buy a property with a house valued at $37k. Many people don’t mind living in a house worth $37k, but someone who is spending $1.5m would probably prefer to buy a different property with a higher quality house. Or spend more money to upgrade the house. How will it be upgraded? Renovating is in most cases economically unsound, most people will choose to tear down and rebuild. In fact, the teardown threshold is likely higher than the 2.5% in the example given. The percentage of properties in Vancouver where the building value is less than 2.5% of the total value has slightly decreaed in the last year from 17.9% to 17.8%, but the percentage of properties with building value less than 5% of the total value has increased from 32% to 33.5% during the last year.
The Data
The data originates with BC Assessment, which estimates land and building values of each property based on recent sales of comparable properties. The assessment was done in summer 2015 and is based on sales before that, so at this point in time the data lags the market by about one year. Values for individual properties may well be off, depending how well renovations and improvements were reported and how well the BC Assessment estimates work for the given property. On average they should reflect the market about half a year to one year ago.
Sadly, BC Assessment does not give out their data with a license that would allow mapping it the way I do, so we have to rely on municipalities to release it through their open data portals. The format of the data from each municipality is different, so lazy me is only importing data from City of Vancouver, although some other nearby municipalities are also releasing there data.
The motivation behind the map was to understand the building stock. Some effort was made to filter out parks, but the algorithm is far from perfect and will often includes parks that host building structures, as well as marinas with structures on them.
The new city dataset does not include the 2016 tax levy, so we still only show the 2015 tax levies until CoV updated their dataset.
History
Here is a quick history of the overall land and building values aggregated for Vancouver between 2006 and 2016.Land Value
Building Value
When looking at all properties in the city, the increase in land value year over year was 21.4% ($45.2bn), while overall building values increased by 7.3% ($5bn). Hover, click or touch the points in the graph to get the values for the corresponding year.
Neighbourhoods
Lastly a quick overview over the neighbourhoods. Land and building values have not increased evenly throughout in the year. I aggregated all tax data by neighbourhood and split it into land value and building value increases. These numbers should be used as guidance only, they mix lots of different types of properties and include parks.
Here is the breakdown by neighbourhood:
- Renfrew-Collingwood: Land: 30.6% ($1.2bn), Building: 5.8% ($46.0m)
- Sunset: Land: 26.6% ($1.6bn), Building: 5.9% ($74.2m)
- Oakridge: Land: 17.6% ($1.2bn), Building: 12.6% ($207.4m)
- Downtown: Land: 16.9% ($0.8bn), Building: 3.2% ($91.2m)
- Kerrisdale: Land: 18.7% ($1.3bn), Building: 3.3% ($54.1m)
- Victoria-Fraserview: Land: 28.0% ($1.5bn), Building: 5.6% ($65.2m)
- Grandview-Woodland: Land: 24.9% ($1.7bn), Building: 0.7% ($17.4m)
- West End: Land: 22.6% ($2.5bn), Building: 3.5% ($188.4m)
- Hastings-Sunrise: Land: 25.1% ($1.1bn), Building: 4.9% ($63.8m)
- Killarney: Land: 17.8% ($0.3bn), Building: 14.1% ($241.6m)
- Marpole: Land: 17.8% ($0.3bn), Building: 14.1% ($241.6m)
- Kitsilano: Land: 21.6% ($3.3bn), Building: 4.3% ($134.5m)
- Shaughnessy: Land: 18.6% ($1.7bn), Building: 7.4% ($117.7m)
- West Point Grey: Land: 20.2% ($2.3bn), Building: 5.2% ($88.3m)
- Fairview: Land: 19.4% ($2.0bn), Building: -1.0% (-$52.4m)
- Downtown Eastside: Land: 21.9% ($2.6bn), Building: 4.9% ($194.9m)
- Kensington-Cedar Cottage: Land: 24.9% ($1.7bn), Building: 0.7% ($17.4m)
- Riley Park: Land: 26.4% ($1.0bn), Building: 4.0% ($40.2m)
- Mount Pleasant: Land: 21.9% ($2.6bn), Building: 4.9% ($194.9m)
- South Cambie: Land: 20.9% ($1.5bn), Building: 21.4% ($268.1m)
- Strathcona: Land: 21.9% ($2.6bn), Building: 4.9% ($194.9m)
- Dunbar Southlands: Land: 21.8% ($1.0bn), Building: 11.2% ($126.6m)
- Arbutus Ridge: Land: 21.4% ($1.6bn), Building: 1.1% ($17.3m)
It becomes immediately clear that the increase in property values is mostly driven by land, note that total value increases for land and buildings are reported in billions and millions, respectively. The building stock does not have time to catch up, with the exception of South Cambie. Fairview stands out with declining overall building values.
Reuse
Citation
@misc{updated-vancouver-assessment-data.2016,
  author = {{von Bergmann}, Jens},
  title = {Updated {Vancouver} {Assessment} {Data}},
  date = {2016-01-17},
  url = {https://doodles.mountainmath.ca/posts/2016-01-17-updated-vancouver-assessment-data/},
  langid = {en}
}
