Today the City of Vancouver released their report on unoccupied dwelling units in the city. I watched part of the presentation and read through the report, and from all that I can see the methodology used is very solid.
I have seen some confusion and even some incorrect reporting on this, so I thought it would be worthwhile to look into the report in detail.
The Data
Smart meter data can be used to determine very accurately which units are occupied and which ones are not. In theory at least, in practice this is quite difficult because of the sheer magnitude of the data. That’s why this is best left to companies who specialize in this kind of analysis, which is exactly what the city has done.
The only problem is that not all units have smart meters. I don’t know how far BCHydro has come with their rollout, but most condo units should have smart meters by now, as do newer single family units. So what to do about the housing that does not have smart meters? That’s where things get tricky. Some studies I have seen use cutoffs for monthly electricity consumption to determine which are unoccupied. The problem is to find the right cutoff. Typically these studies report rates computed using several cutoffs to address that uncertainty. The problem is that different cutoffs give very different results. For example, this study looked at 75kWh and 100kWh as monthly consumption cutoffs and reported 5.5% and 8.5% unoccupancy rate, respectively. I checked my condo unit when it was unoccupied for two months one summer, my two fridges pushed me well above the 100kWh threshold. So my unoccupied unit would have been counted as occupied in this study.
So how did the new study deal with this problem. We did not hear technical details, but during the presentation it was explained that smart meter data was used to “train” a model to use dumb meter data. That’s exactly the right approach. Going by the fact that everything was done right I am reasonably comfortable to assume that this part was also done in a way to give accurate aggregate numbers.
I am hoping that the technical report will still come out so we can be confident that the details were taken care of properly. In particular I would like to know how the model dealt with different housing types, and how the housing type was tied to the electricity bill. What ratio of dwellings of each housing type had smart meter data available? And most importantly, what are the uncertainty estimates on the numbers presented?
Bottom line on data: Solid.
Results
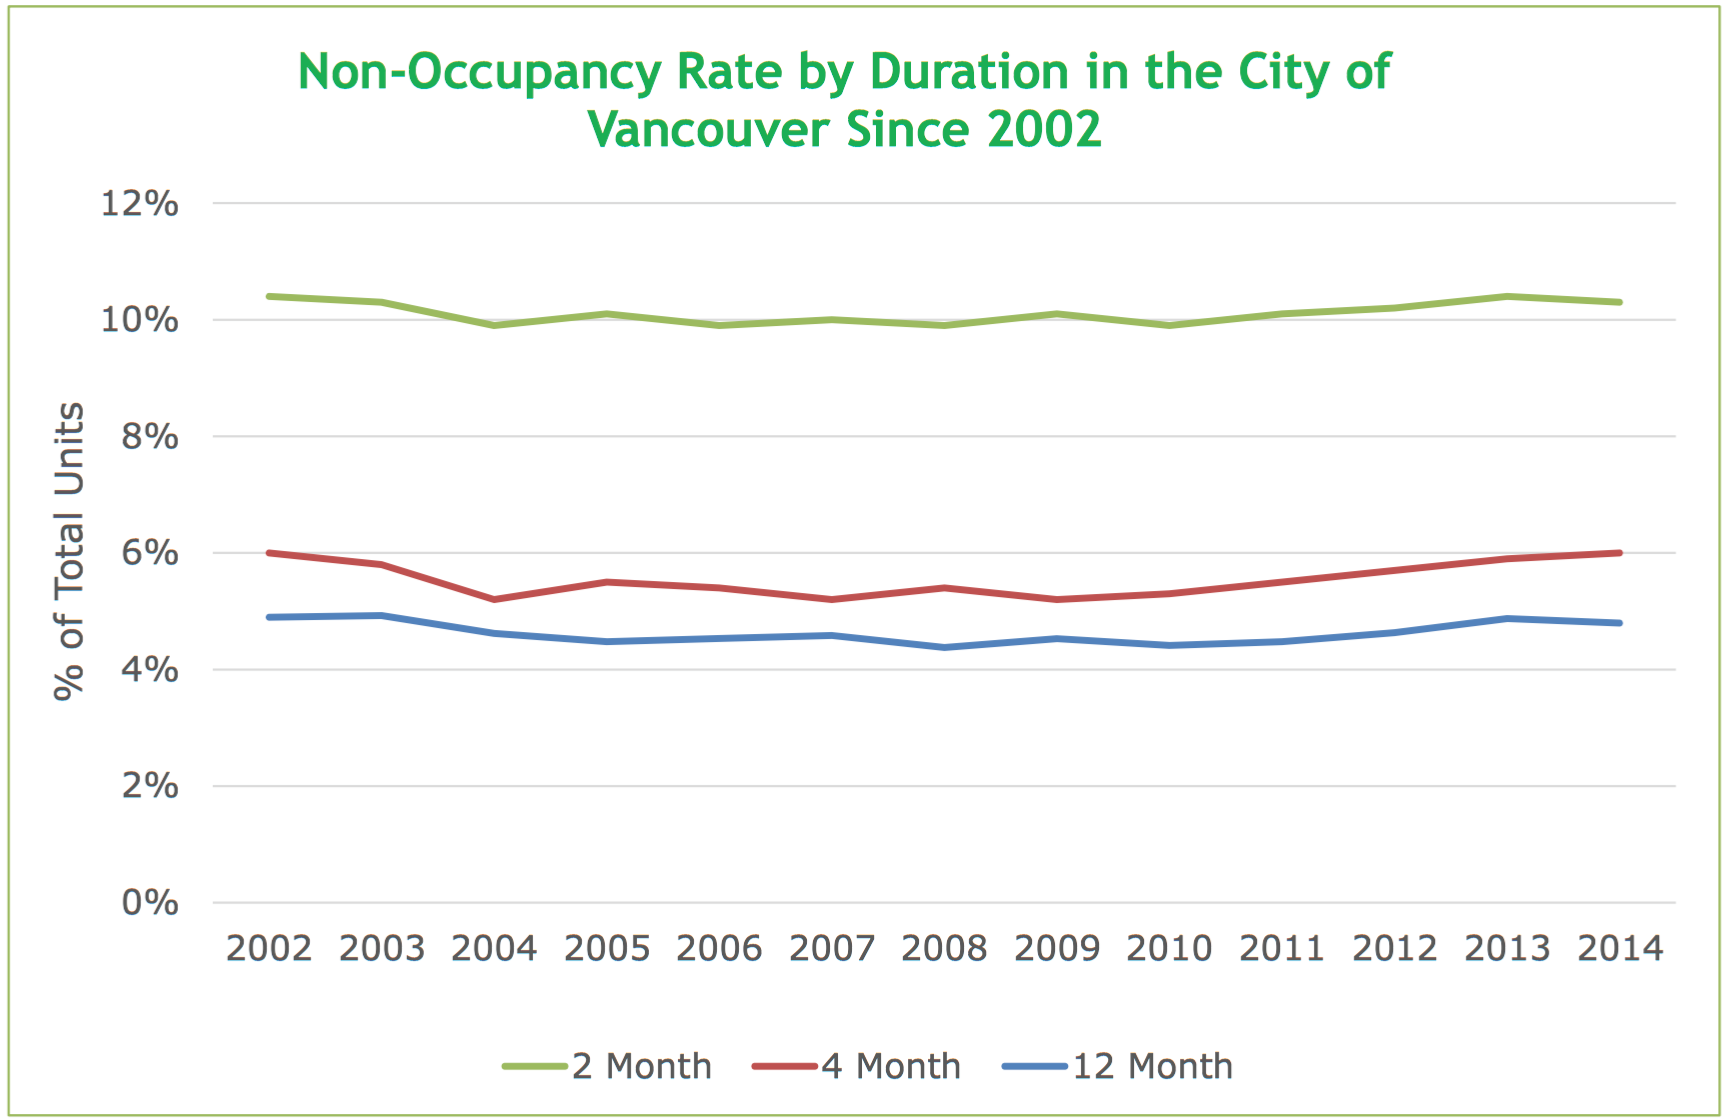
The big takeaway is this one graph:
 It shows that no matter what timeframe is used to define “unoccupied”, the rate stayed flat over time. In context of the current affordability discussion this means that this is unlikely a driving factor of Vancouver’s skyrocketing real estate prices. But the absolute numbers are still quite large and there is a lot of untapped potential. While some people have argued that supply has not been the main part of the cause of the price hike in Vancouver, it is clear that it must be a big part of any solution. Finding effective ways to get this untapped supply online should be a priority, it is easier and more efficient than building new housing in NIMBY-zoned Vancouver.
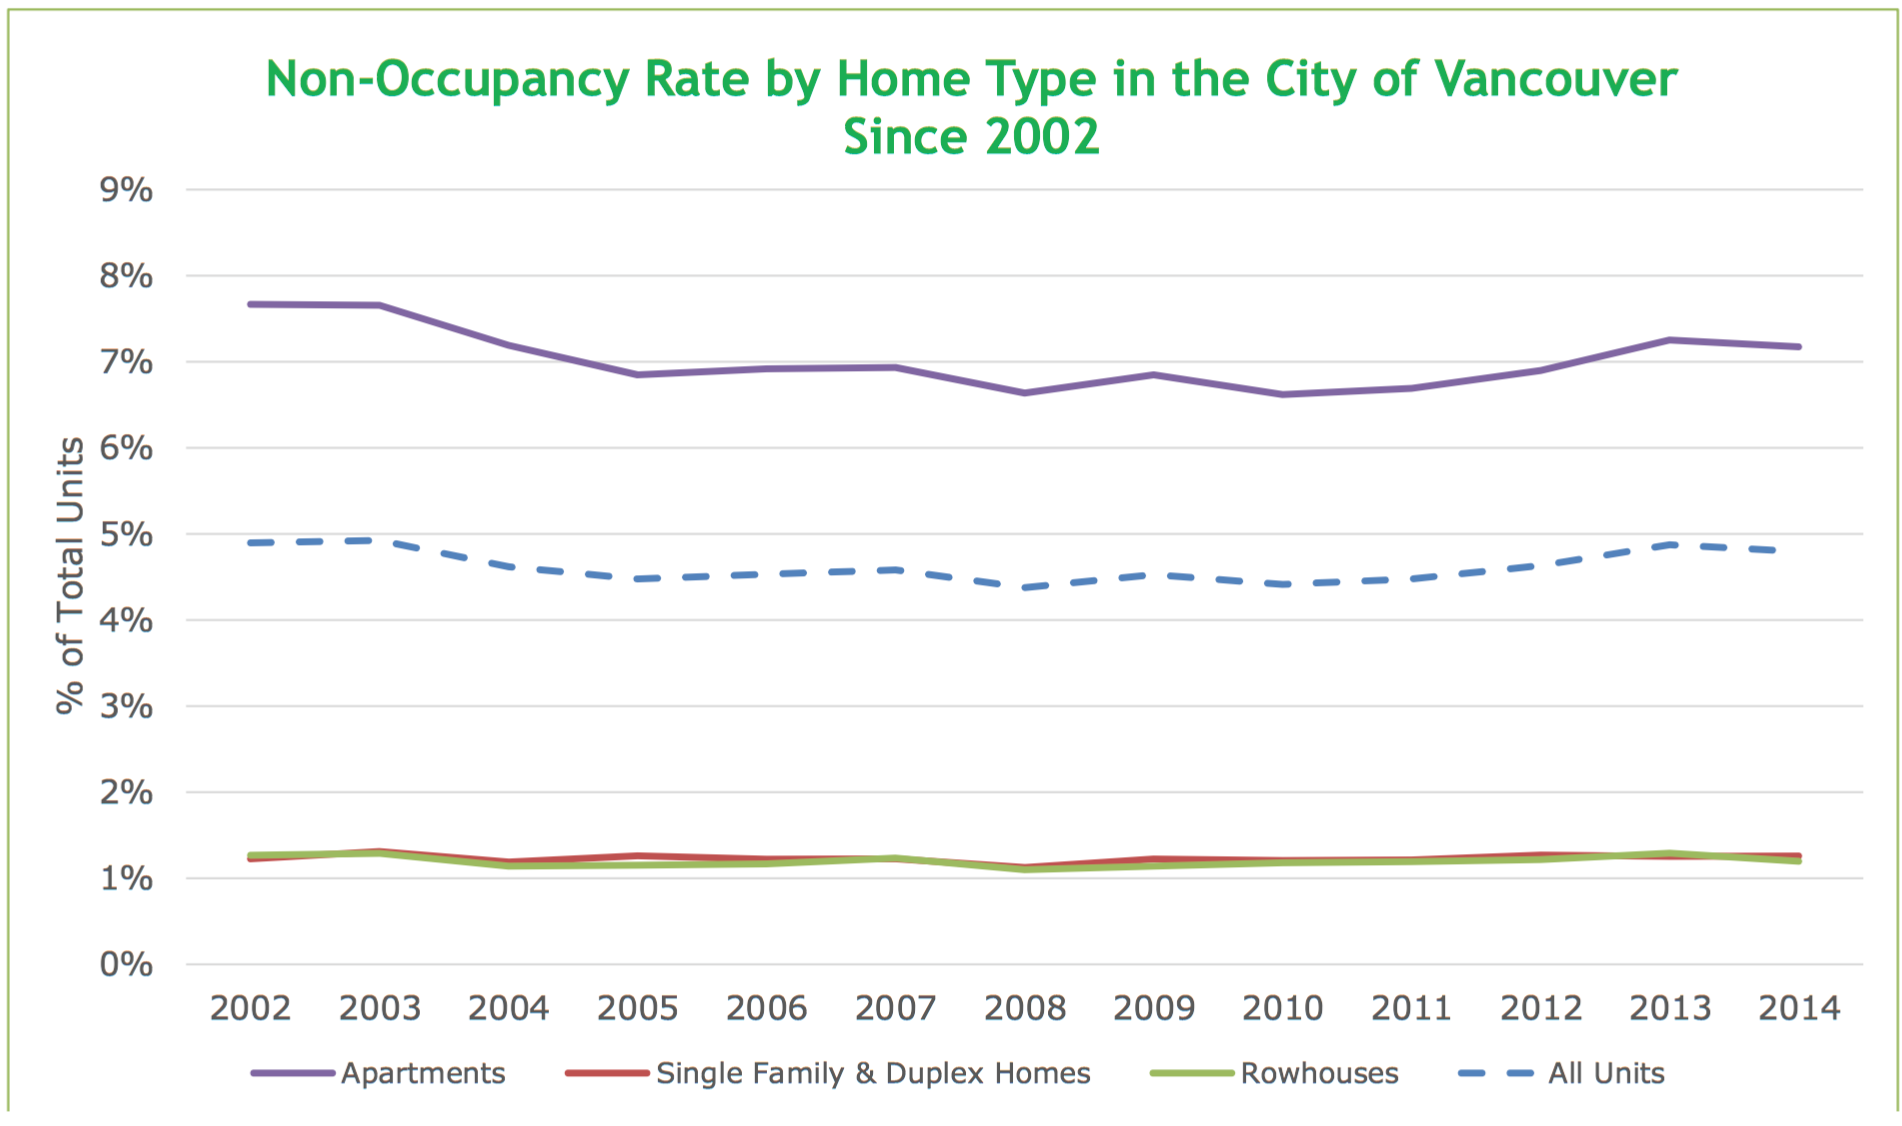
The other takeaway is that unoccupied units are dominated by condos.
 The graph shows the rate for apartments, which also includes purpose built rentals. As the report points out, if we take out the purpose-built rentals, which have vacancy rates well below 1% at any given time and are extremely unlikely to stay vacant for two or more months, we arrive at a rate of about 12.5% of condos that are unoccupied in the City of Vancouver. As should be expected, that’s significantly higher than what the non-smart meter studies picked up.
Are rates in Vancouver higher than elsewhere?
That depends exactly on what the question asks. And this is where, in my opinion, the city report fails to give a good answer.
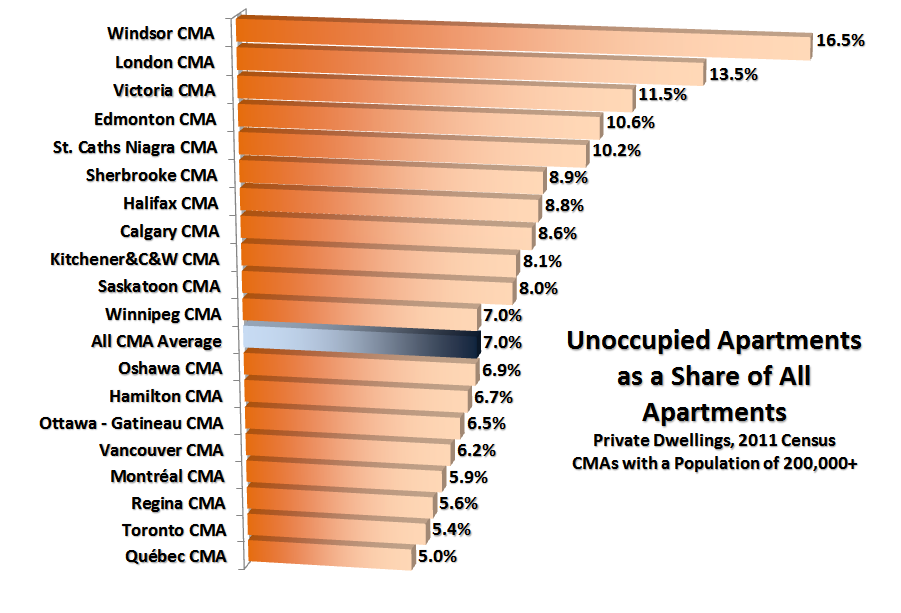
 The City implied, and newspapers now report that Vancouver numbers are “in line” with other comparable cities. That claim is based on this graphic, which is included in the report and stems from a study by Urban Futures. The study shows that the Metro Vancouver’s rate of unoccupied apartments is not much different from other Metro regions.
The problem is that this study is read as giving the overall occupancy rates are similar across metro regions, which is not the case. This is a fine point and a little technical, let’s take a look at the actual rates of unoccupied dwellings in the larges metro areas.
We took these numbers from a CMHC report that looked into this question and used the same data and methodology as Urban Futures, except they based it on all dwelling units instead of just apartments. This difference is quite stunning, and it can be explained by the fact that e.g. Metro Vancouver’s housing units are to 41% apartments, vs 20% for Metro Calgary. And that various reports showed that the rate of unoccupied units is much higher in condos, so we can’t substitute comparisons for unoccupied apartments for comparisons of unoccupied dwellings overall.
So what do the numbers look like when comparing the City of Vancouver to other cities in the region and across Canada. In short, I do not know. Without going into too much details, the number of unoccupied dwelling units is derived by taking the number of units that are “not occupied by usual residents”, which is part of the standard release of the census data, and subtracting the “unusual residents”, that is foreign or temporary residents. So residents that have a permanent address abroad or elsewhere in Canada and on Census day occupied in a dwelling unit that is not their primary residents. Think students in a dorm room. Or someone in his vacation home. Or someone that works far from home and has a second unit close to work.
And to get the number of foreign or temporary residents requires a custom tabulation, which costs some time and money. But overall not that much compared to the scope of the study the city just undertook, so it is not clear why they did not do this and settle this question properly.
Why do I see so many different unoccupancy rates?
Again, that depends exactly on the question asked. The report offers a variety of different rates, using the definition of unoccupied for 2 months, 6 months or 12 months. Each one gives a different rate. Then there is also the definitions used by Stats Canada, the building being unoccupied on census day (and the questionnaire was not returned). Again resulting in a differnt number. Then we can throw in the “unusual residents”, getting yet another number. Confused? You should be! Difficult questions often don’t have an easy answer.
The most important thing is to be consistent when comparing these numbers. Has the problem gotten worse? Use numbers that were derived using the same methodology at different times. Is is worse here than elsewhere? Use numbers derived using the same methodology across geographies.
Geographic distribution
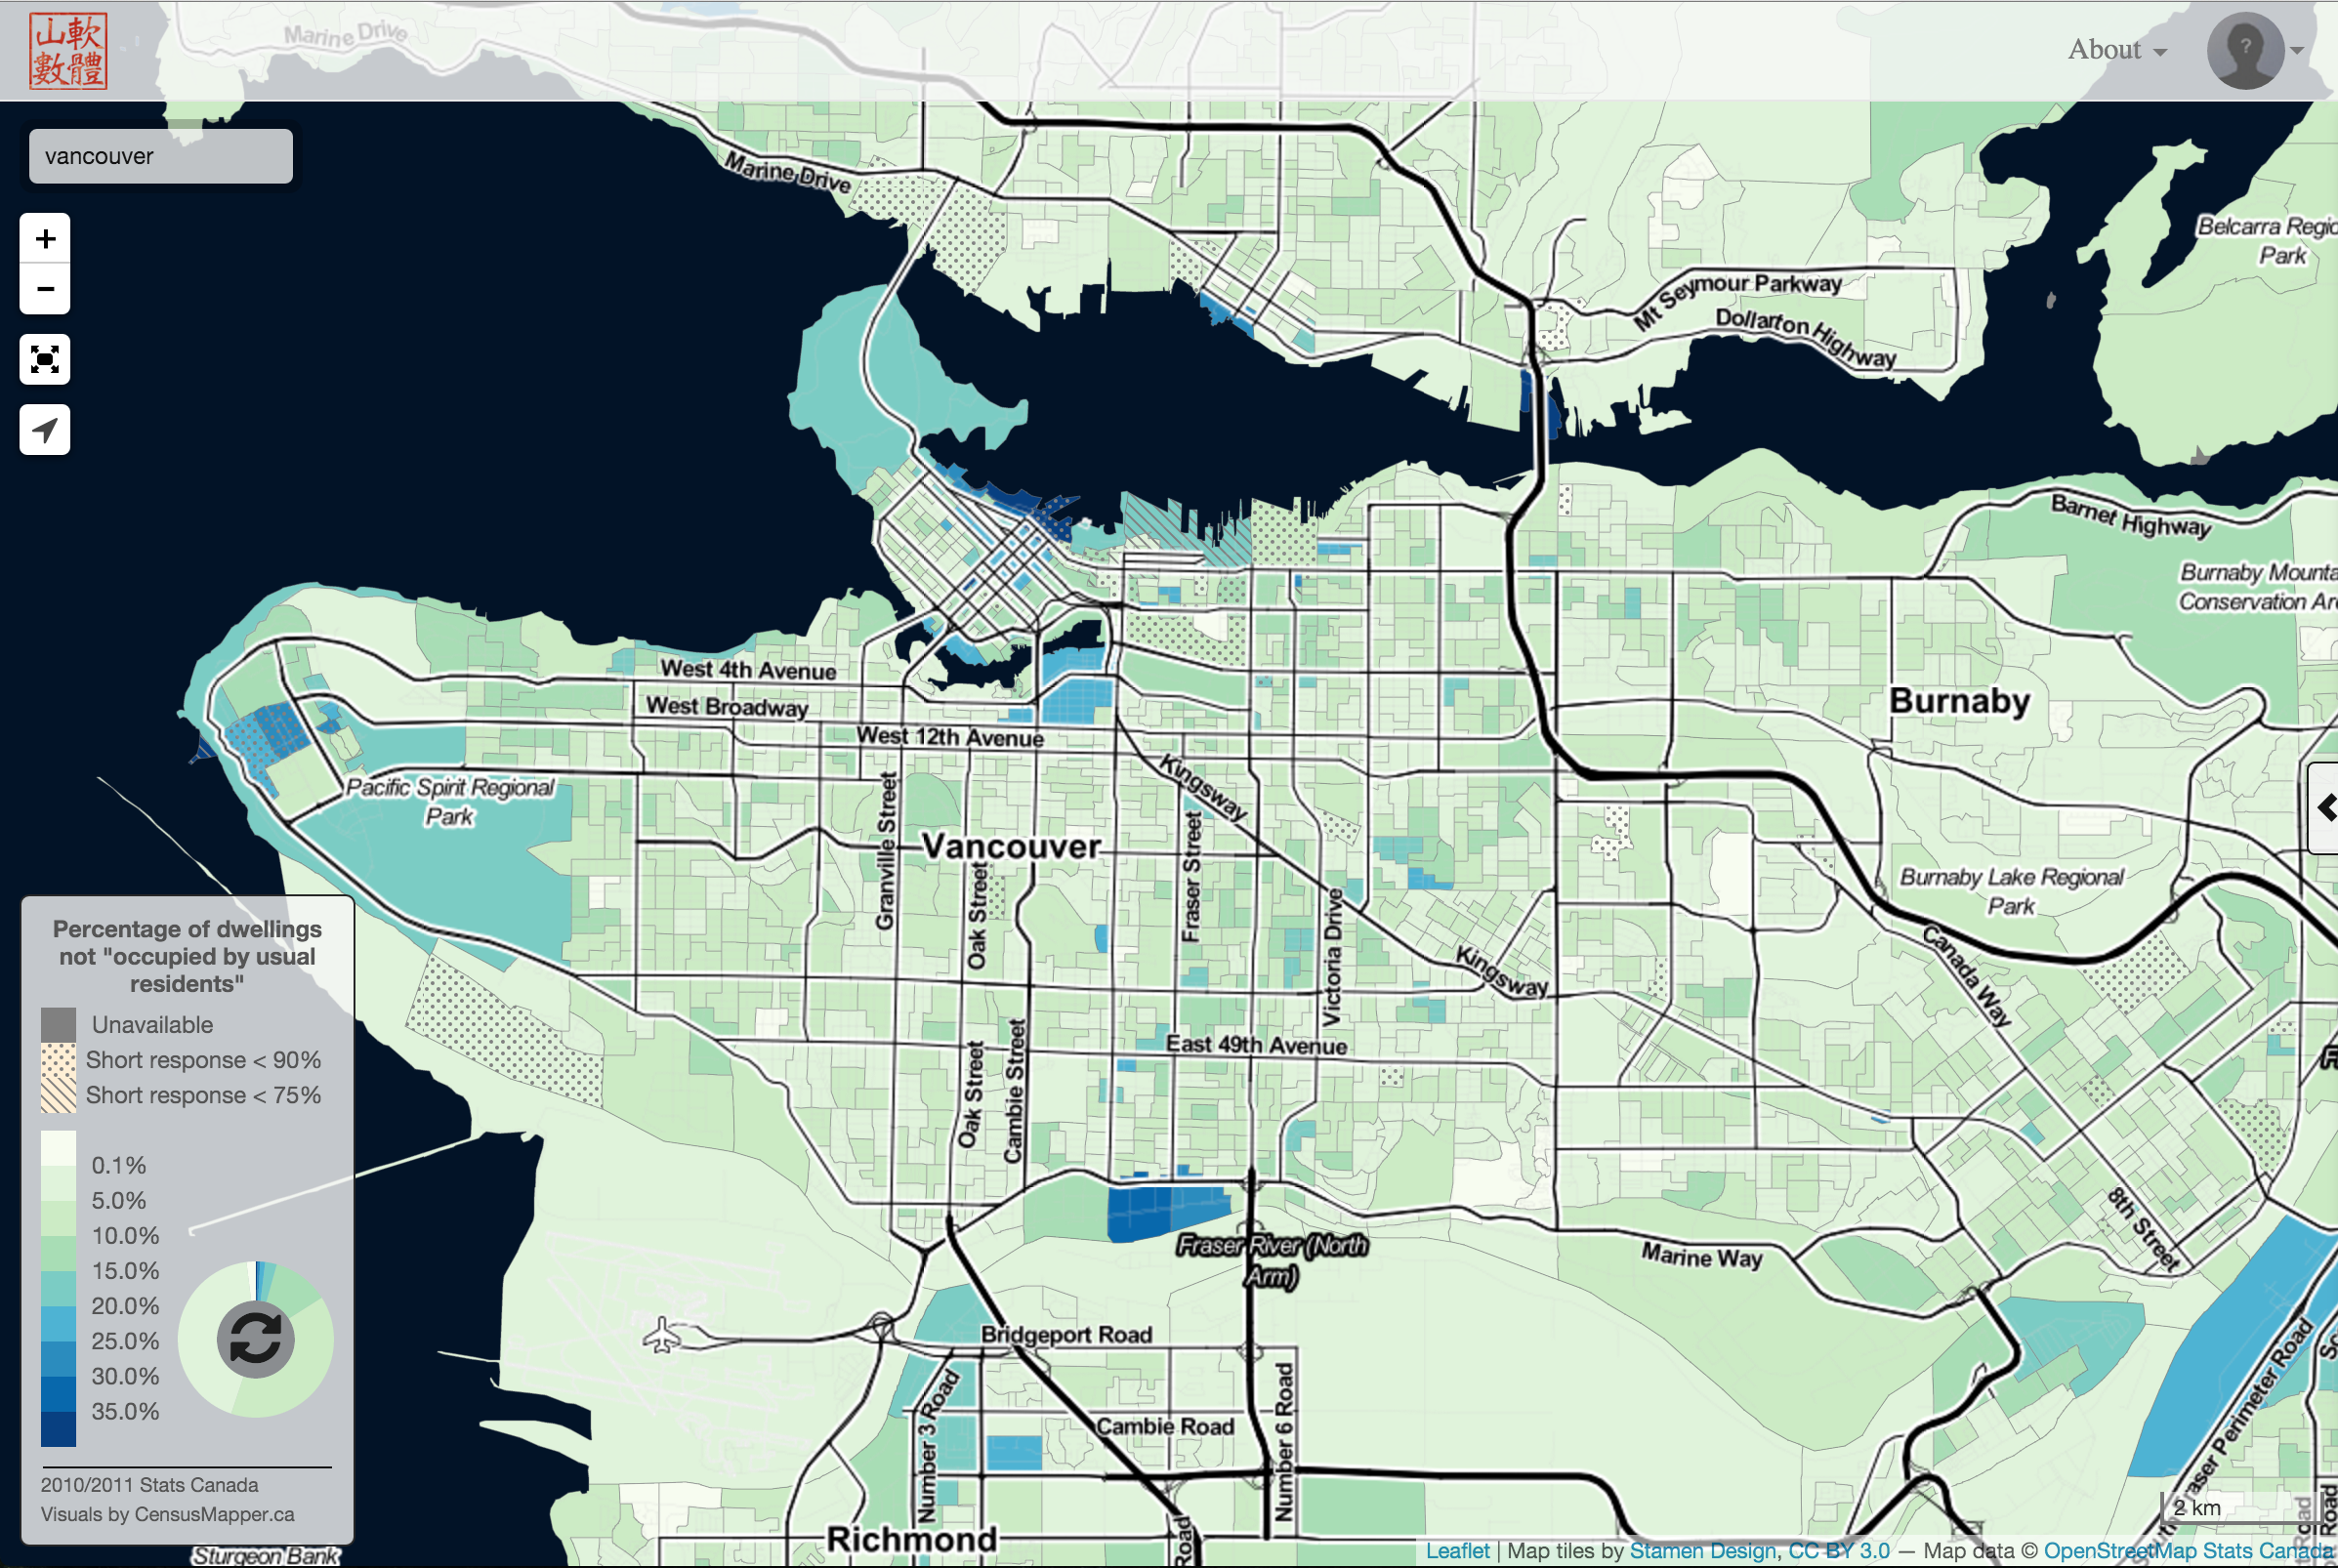
 In absence of the data on the foreign and temporary residents, we can take a closer look at the publicly released census data on “dwellings not occupied by usual residents”. The percentage of dwellings occupied by foreign or temporary residents are quite low, in the 0.4% to 0.2% range for these metro areas we looked at above. They tend to cluster around universities, but may also accumulate in some other areas. Keeping that in mind we can head over to CensusMapper and zoom, pan around and use the search bar to explore the geographic distribution. The city data has shown that there was not much change in the number of unoccupied dwellings over time, no matter how the data was sliced. That gives us some confidence that the geographic distribution has also been somewhat stable over that time frame.
At CensusMapper we are working on adding previous censuses, so this will be a good test case to see how the 2006 and 2001 geographic distribution of unoccupied dwellings stacks up. For City of Vancouver the corresponding numbers are 7.5% and 5.1%, respectively. The 2006 number is nicely in line with Vancouver’s 2011 rate of 7.7%. It is not immediately clear how the significantly lower 2001 rate squares with the city report showing a flat trendline, but could well be due to shifting definitions from one census to another. The 2001 Census used slightly different definitions, it requires more work to compare these numbers. The devil is in the details.
Next Steps
The city study settles an important questions. The rates of unoccupied homes have not gone up. Perceptions often don’t match facts. And there are lots of little things to poke at of course. What about people having a cleaning person stop by every other week? How about homes awaiting renovation or demolition permits? How about AirBnB?
Now all these are valid questions. But before using this to discount the study do some estimates to see how large of an effect your porposed hole actually has. How does it compare to the number of units that were found unoccupied and how would it change that rate? In all these cases it is quite small. Then ask yourself how likely it is that the problem would be growing.
Then you find that AirBnB probably needs more scrutiny. Best current estimates that I have seen peg entire units rented fulltime at AirBnB at 1200 in Vancouver. Counting those would bring the rates of units taken out of the rental market by being unoccupied for a year or rented out full time via AirBnB from 4.8% to 5.3%. Noticeable, but doesn’t make that much of a difference. Yet. That number is very likely to grow if left unchecked and should probably be taken seriously and regulated properly right now.
Update
A more detailed report is now available to give more insight into the methodology. Nothing unexpected there, although the claim that the 12.5% rate of unoccupied condos is consistent with earlier claims of 5.5% to 8.5% is hard to follow.
Still waiting for the technical report to get an idea of the error estimates (by housing type). Seeing the graphs for the 2-month and 4-month cutoffs by housing type would be nice too, as well as the respective ones using the 15 day criterion.
Reuse
Citation
@misc{unoccupied-dwellings.2016,
  author = {{von Bergmann}, Jens},
  title = {Unoccupied {Dwellings}},
  date = {2016-03-08},
  url = {https://doodles.mountainmath.ca/posts/2016-03-08-unoccupied-dwellings/},
  langid = {en}
}
