The story of Vancouver real estate is mostly a story of dirt. After spending a bit of time to collect relevant data I am now wondering how to make better visualizations to make that data more accessible.
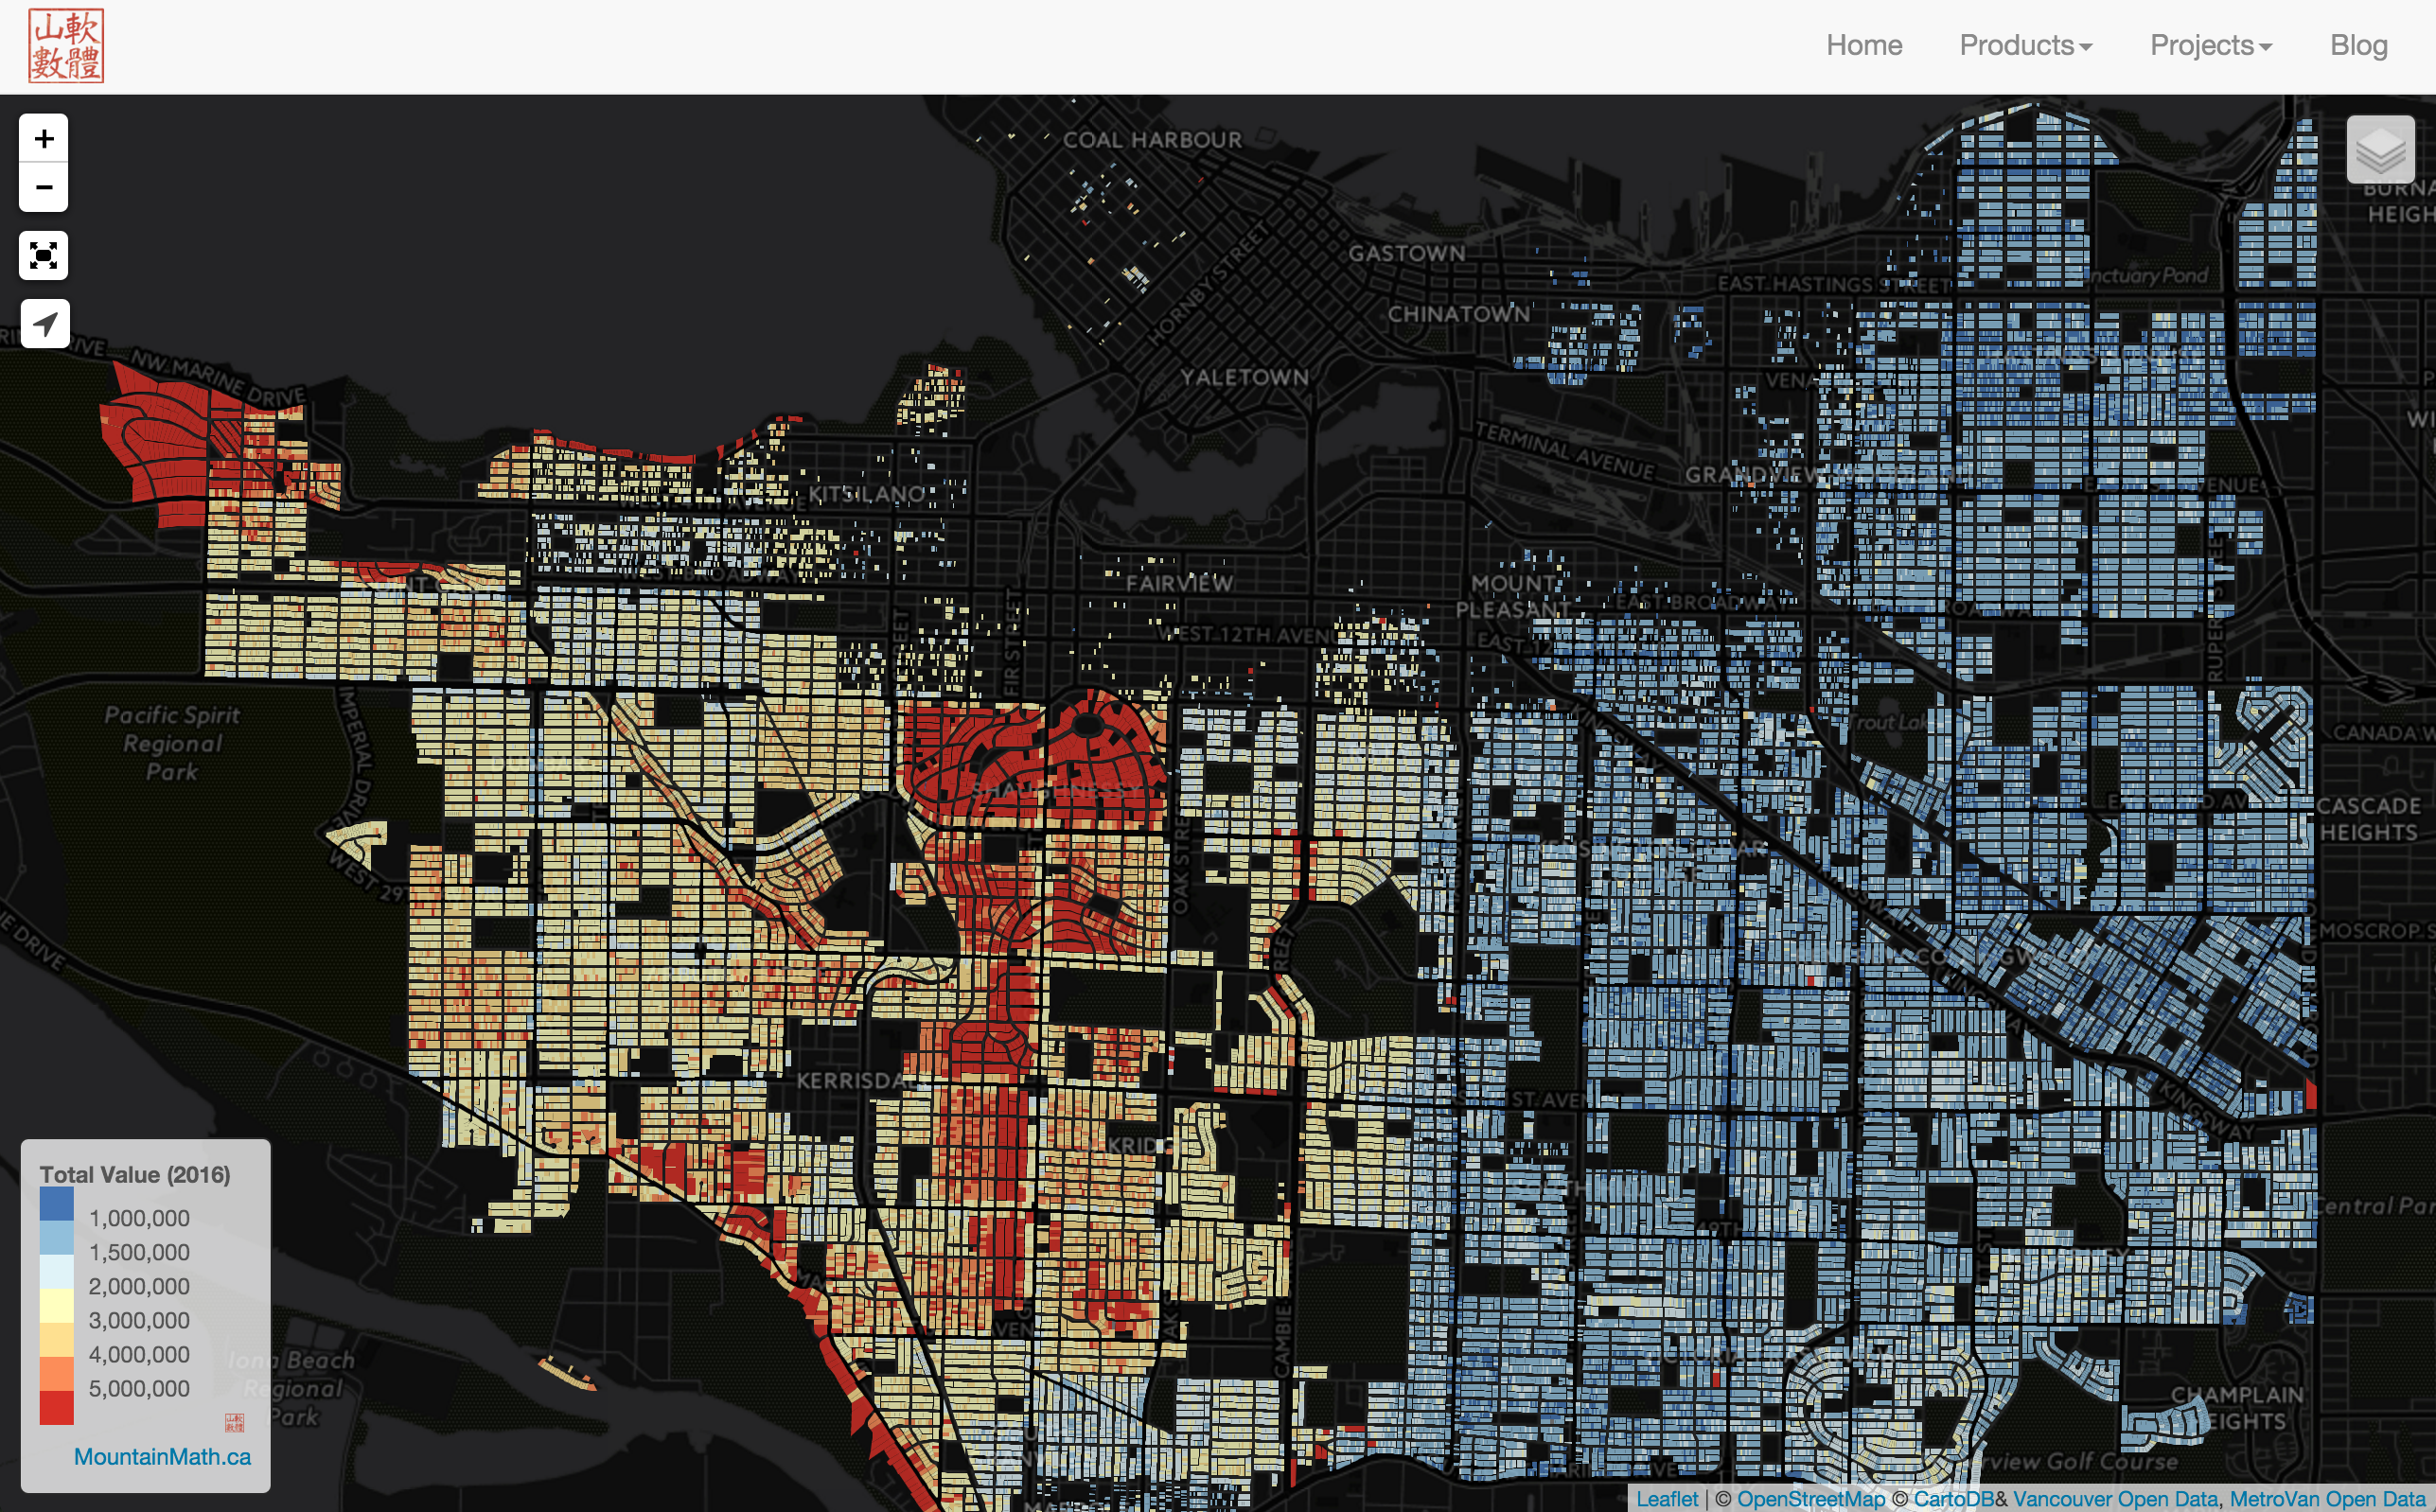 Looking at my old maps based around assessment data, there are a couple of things that bother me. They are not very good at showing changes over time. And they are not very good at highlighting the different role of dirt and the houses on top. Yes, they do have separate views for building value, land value and various changes over time. But the visuals aren’t catchy and intuitive. When mapping building values I show the properties the buildings sit on, instead of the building footprint. When mapping value increases I just map a some kind of ratio of values between specific years. I use colours to visualize values, highlighting large differences but losing the smaller differences within the colour brackets.
What would a better visual look like? I want to better explain the different roles played by dirt and houses. But retain interactivity and the ability to zoom and pan around.
Better Visualizations
The idea is to map buildings and properties on the same map. Using 3D mapping we can uses height as an intuitive representation for value, adding colour brackets for additional reference as values push through emotionally relevant brackets, like the $1m barrier. To show change over time we just add a time slider and animate the whole thing. To keep things simple and comparable we will focus on single family homes for now. 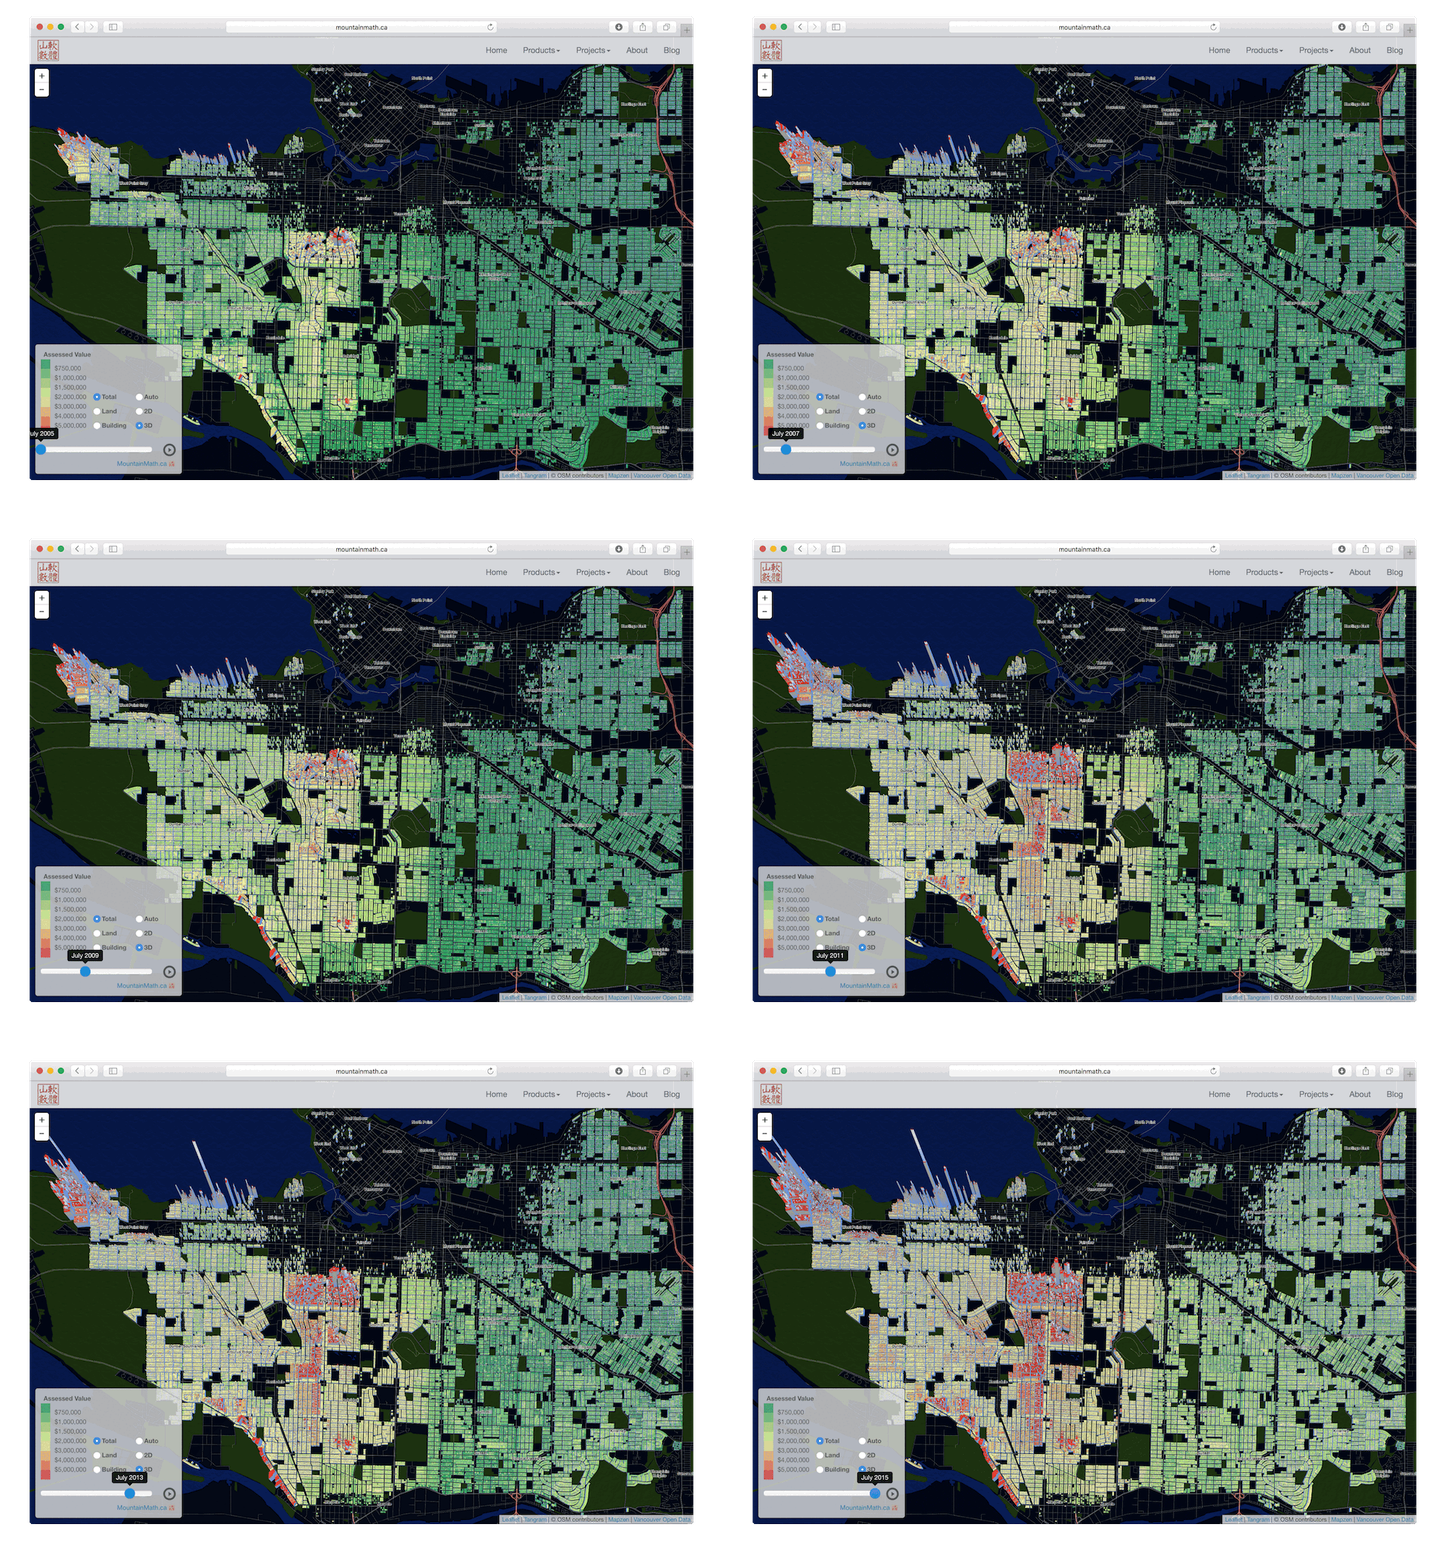
We build three maps, one showing land and buildings on the same map, one just showing land values and one just showing building values. All three can be animated over time.
We normalized all dollar amounts to 2015 by adjusting for inflation. There are good reasons for going either way, adjusting for inflation or keeping it in original dollar amounts. For this animation we felt the it was better to show real (inflation adjusted) value growth. Keep in mind that this means is that if a property cost $1,000,000 in 2005 dollars we will show the value for 2005 to be $1,175,686 in 2015 dollars.
The Rub
I find these maps much more intuitive and instructive than earlier maps I did. But it comes at a price – these maps will give your GPU a run for it’s money. And they are only visible on modern computers and browsers. They can be viewed on mobile too, but don’t try to zoom out. They eat up quite a bit of memory and may crash your mobile browser.
Go test how “modern” your computer is. It’s kind of fun to view the houses in different areas evolve over time. Try out the interactive animations with just the houses or with both, houses and land.
Local Stories
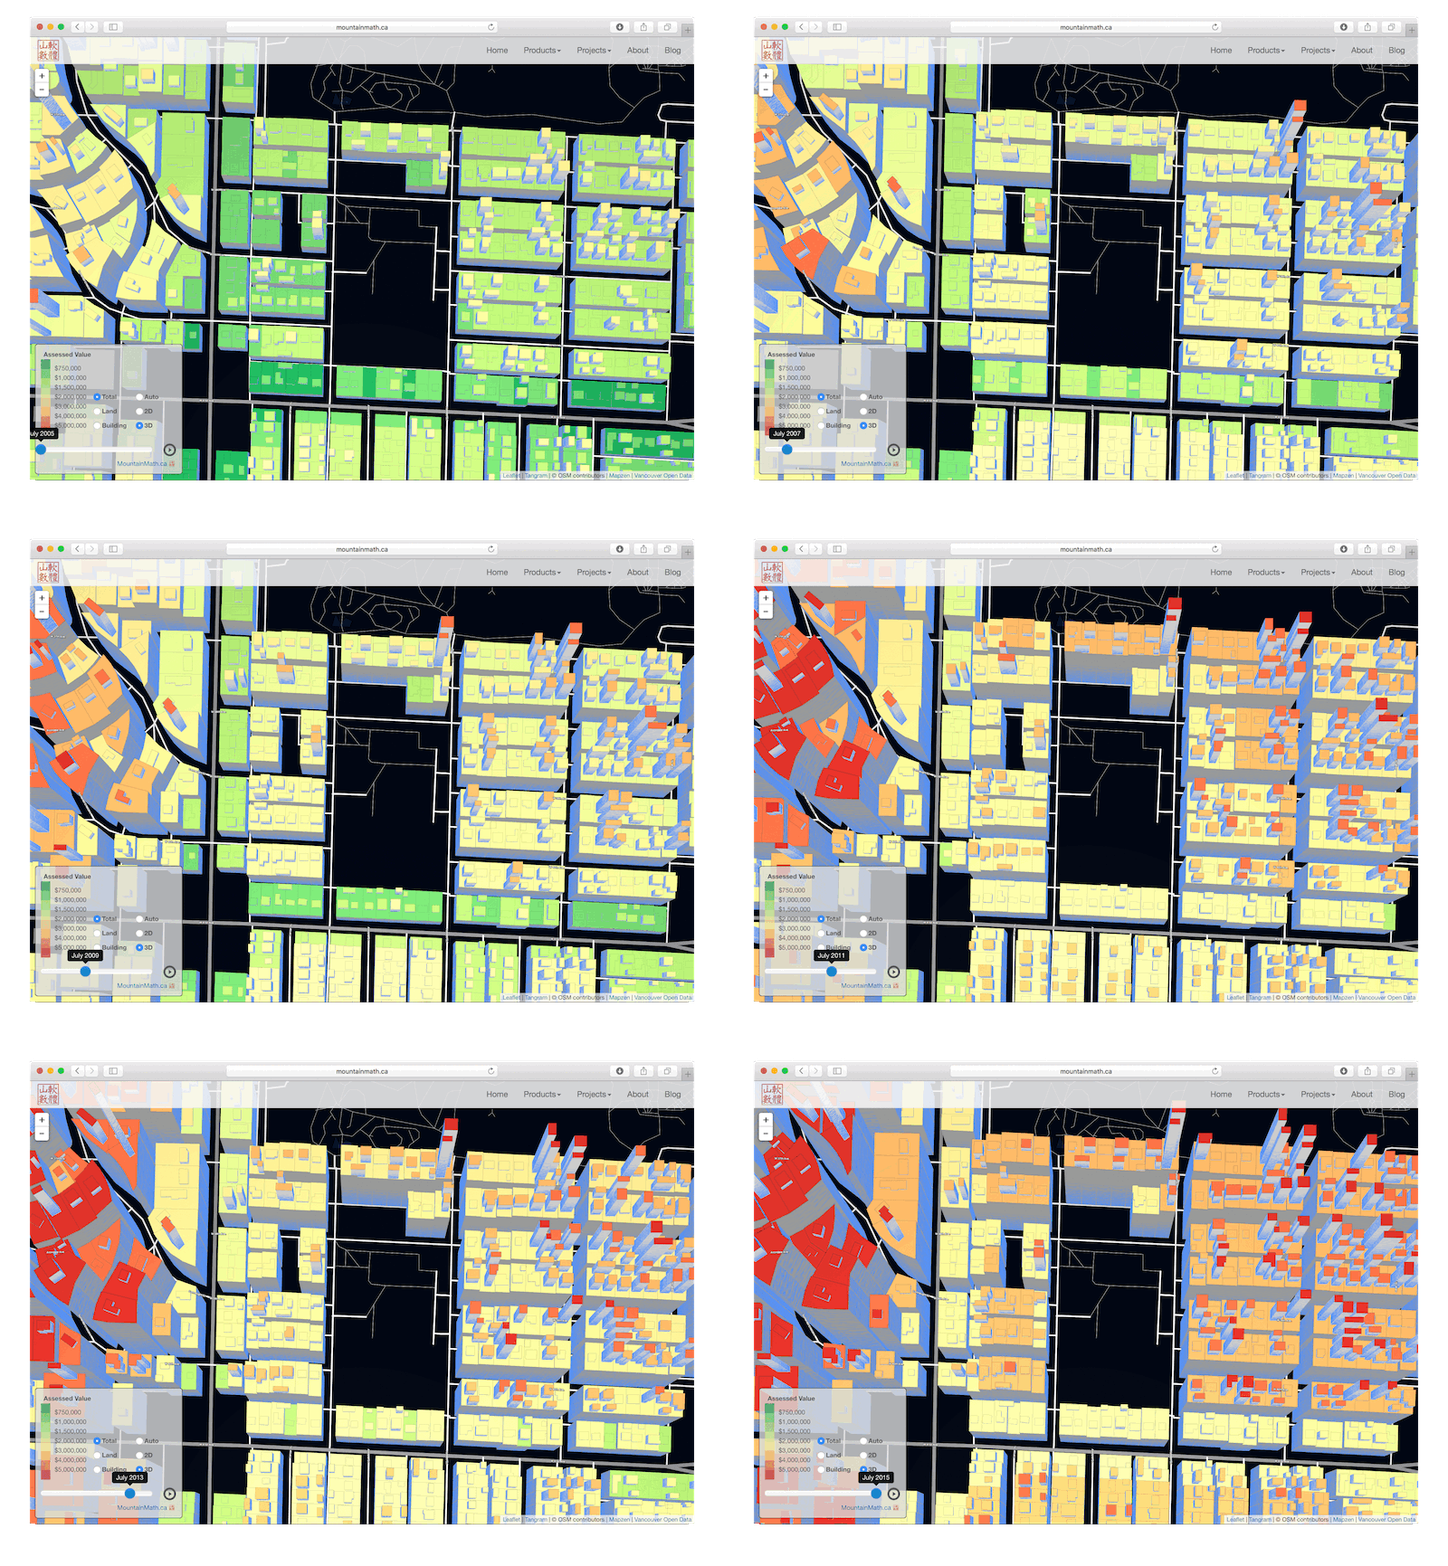 Zooming into these maps we can start to see the local stories of the Vancouver single family homes during the last 11 years. Over time one sees where the land value is doing almost all of the lifting, but occasionally one sees re-development or extensive re-modeling activity that pushes up the building value as buildings try to catch up with the sharp rise in land value.
And this is really the essence of the Vancouver real estate story when viewing dirt vs buildings. The land values are rising so fast that the building values don’t have time to catch up. In fact, during the last year alone the aggregate land values of all single family homes exceeded the combined pre-tax income of all Vancouverites.
The speed of the rise in land values is also driving the rapid re-development of buildings as explained in an earlier post.
Unaffordable Dirt
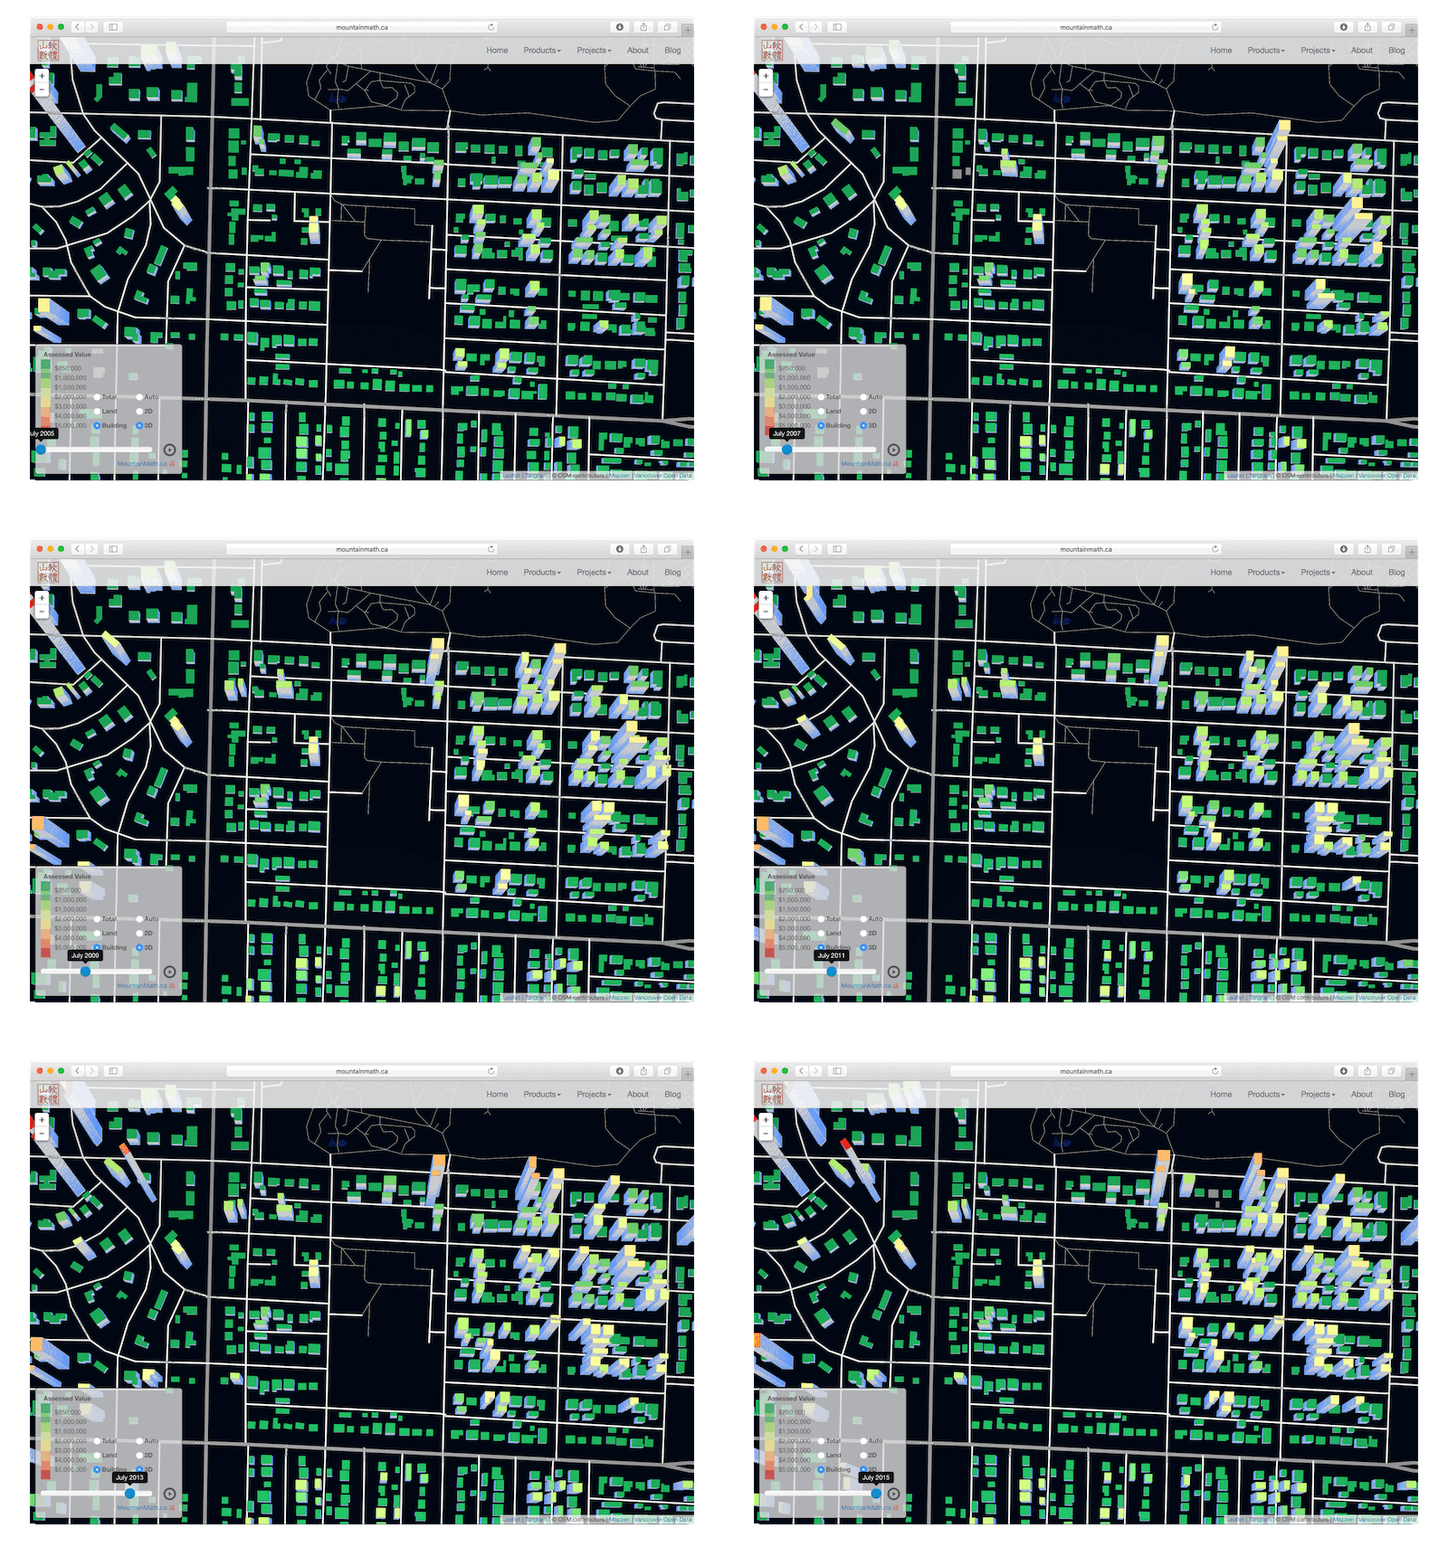 The visualizations show that Vancouver’s “unaffordable housing” is really all about “unaffordable dirt” and not “unaffordable houses”. Looking at only the houses, we see that while there are some multi-million dollar houses, most houses are very affordable. It’s just the dirt they sit on that is really expensive.
This distinction does not matter much if one is buying a house. But it does matter when making policy decisions. One way to make housing more affordable is to reduce the impact of the land value. Converting a single detached house into a duplex immediately cuts the land value in half. If we replace it with a 4-plex, land values go down to a quarter for each housing unit.
Dividing Dirt (Update)
We added stratified residential units into the visualization so we can take a closer look what happens when we divide dirt, that is when we allow more housing units on a single property. In the RT zones the city allows duplexes or coach houses, so two stratified units on a single property. In other zones, like RM, some CD and some commercial (mixed use) the city allows for more strata units per property. We added a unit slider that allows to filter residential properties by how many strata units they house. If upper and lower cutoffs are set to 1, we just get single detached properties. If both are set to 2, we get duplexes. If the slider range is 4-20 then we see all buildings with somewhere between 4 and 20 units. Note that we did not map any purpose built rental buildings, that is residential buildings that have more than 2 units but are not stratified.
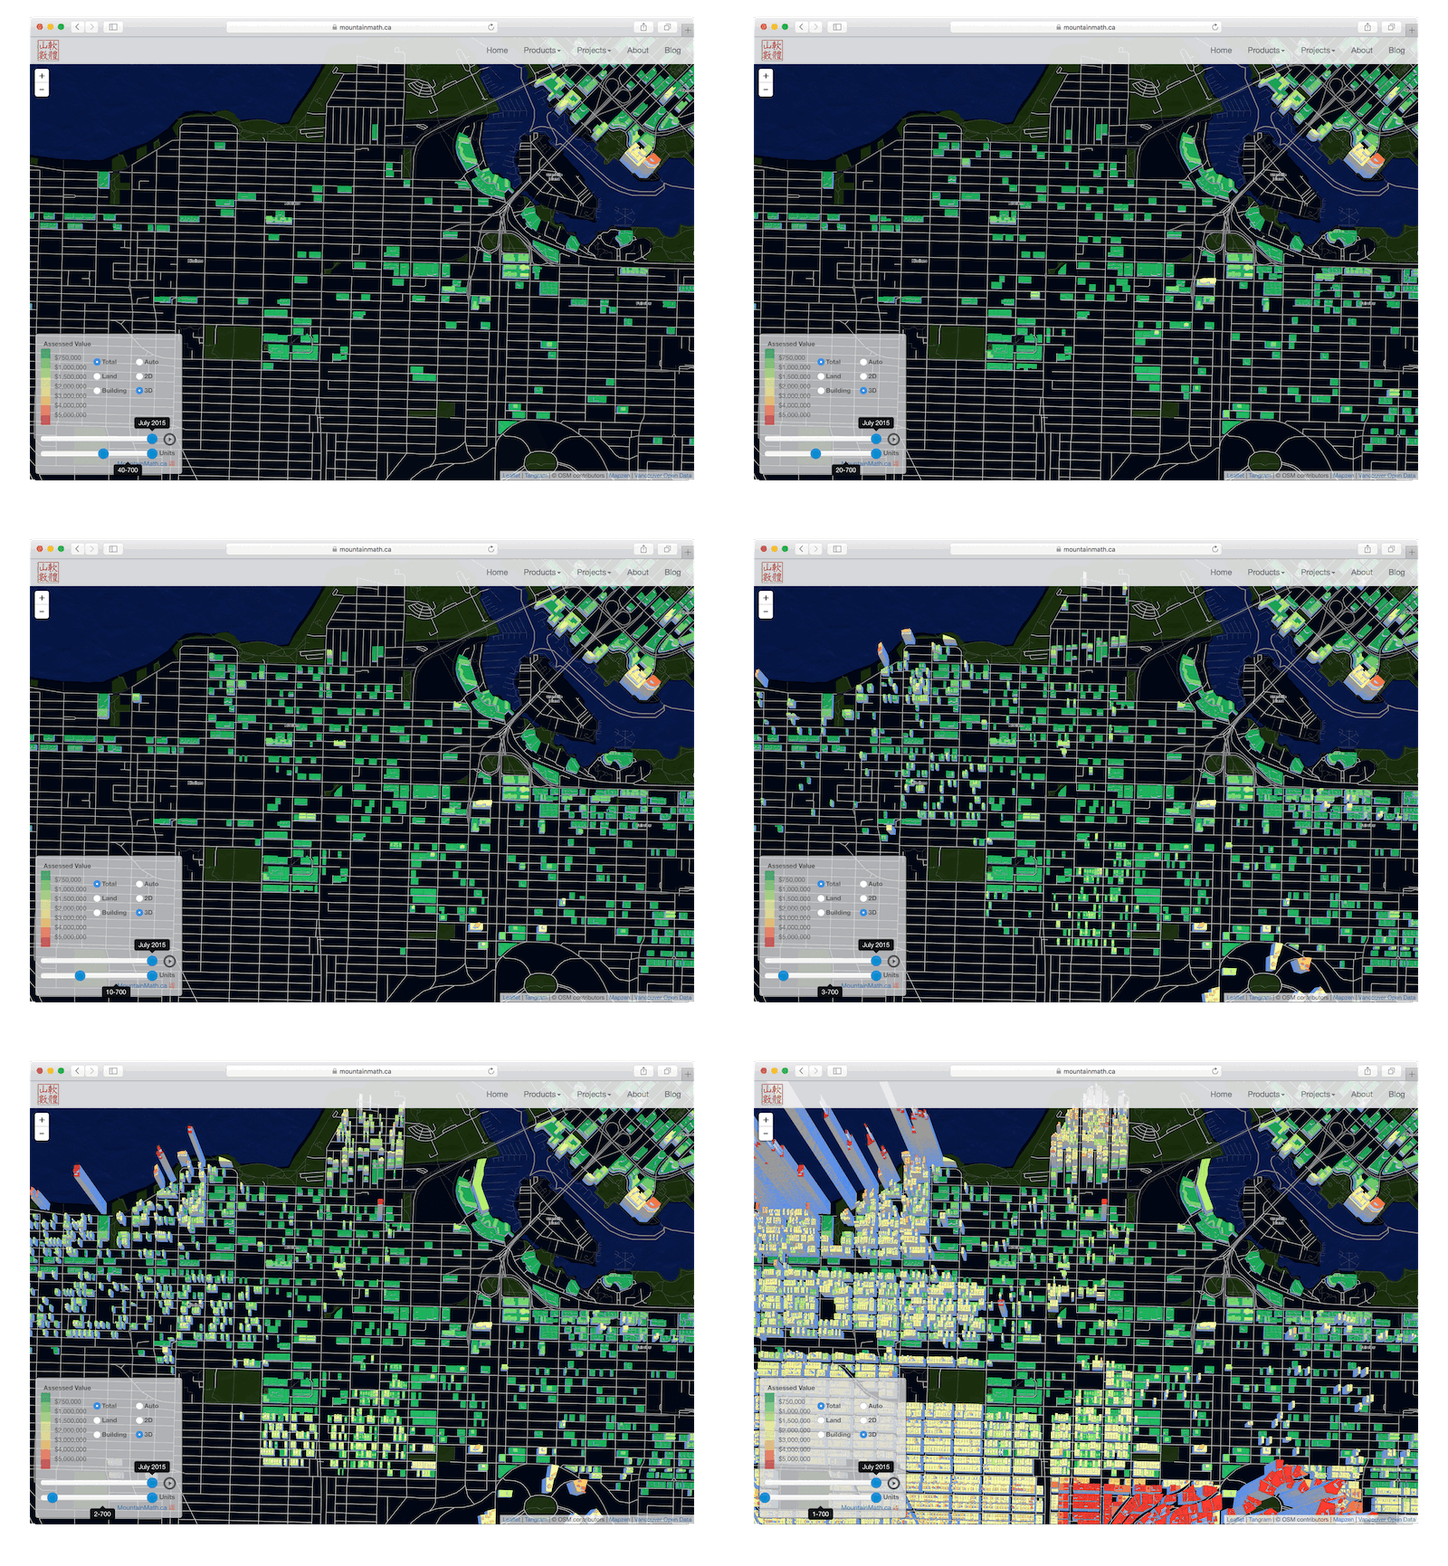 We then use the average value of the land and the building per unit to map colour and height. Starting out mapping only buildings with at least 40 units we see that the average price of a unit is solidly in the bottom color bracket for most properties. As we slowly add in buildings with fewer units we see that only once we get down to 3 and 4-plexes do we see a clear increase in more expensive properties on our colour scale. Adding in duplexes then leaves a clear mark with, in genreal, twice the value of 4-plexes on a comparably sized property, and then another jump by a factor of two as we add in the single detached properties.
Looking at the general condo picture, we generally see savings on a per-unit basis as we increase the number of units per property. Those savings are most pronounced for lower unit counts and seem to flatten out once we hit around 20 units as building values per unit stabilize and land values also rise proportionally to the unit number.
Some luxury developments stand out, but even there land values dominate. There are very few strata buildings where building values exceed land values. I would be curious to hear what economists think about this, to me it looks like a sign that land values of condo buildings are inflated because of the artificial sparsity of available land for such developments through restrictive zoning code.
Data (only if you need to know)
The data used for this consist of merging four datasets. The Vancouver property boundary data set, the Vancouver tax assessment dataset (for tax years 2006 and 2016, estimating values on July 1st of each previous year), the Vancouver building footprint dataset (based on 2009 LIDAR data) and the Metro Vancouver land use dataset to help identify single family homes, especially the 15% outside of RS zoned areas. The tax assessment dataset gives an estimate of the values on July 1st of the year indicated in the visualization.
The datasets all have their issues and are a little out of sync. The property dataset is for a fixed point in time and may not properly reflect the legal state of properties for all years (when for example properties were joined or split). The tax dataset is not in all cases properly linked to the properties, in particular if the tax code changed which happens in some but not all cases when the building gets redeveloped. There are 854 such single family home properties in Vancouver that we can’t trace for the whole time period. On the map they will be visible as greyed out properties for earlier years that in later years spring to life as we can trace them.
Especially in the earlier years the dataset will not properly identify all single detached homes if they have been converted to duplexes or other multi-family units in the meantime.
The building dataset represents a snapshot in time around 2009. We don’t show properties that did not have a building in 2009 (767 properties, 562 of which are single detached), and if properties have been re-built since 2009 we show the old building. The Land Use dataset is lagging behind a bit and has for example not caught up with recent re-developments along the Cambie corridor.
We also dropped 296 residential properties that did not have a land value for 2016, most lightly because they are being re-developed and linking the assessment to the property failed.
The land and building value data is estimated by BC Assessment and is based on sales of comparable properties in the time before and after July 1 and takes into account information from building permits and other evaluations. On an individual building level, especially for older buildings that have not been sold for a long time, the data can be somewhat inaccurate at times. But in aggregate it provides a fairly accurate snapshot of the property and building values.
Neither the zoning information, not the land use have been updated to catch some of these freshly developed land assemblies. I have manually removed a good dozen obvious ones from the dataset, there are probably some more hidden in there.
Most of the problems stem from the fact that BCAssessment data, which has much more comprehensive and cleaner data, is not directly accessible.
Reuse
Citation
@misc{on-dirt-and-houses.2016,
  author = {{von Bergmann}, Jens},
  title = {On {Houses} and {Dirt}},
  date = {2016-04-01},
  url = {https://doodles.mountainmath.ca/posts/2016-04-01-on-dirt-and-houses/},
  langid = {en}
}
