At CensusMapper, we have come a long way from first dabbling in census data to building out a platform to map data Canada wide, adding the ability to easily drill down into individual census regions, improving mapping efficiency, adding the ability to automatically populate custom geographic data with census variables and adding older census data.
We believe all of these are comparatively small steps compared to the opening up of map making capabilities for everyone that we are rolling out today. Free to use, free of charge. Statistic Canada opened up census data for anyone to use, but the sheer volume of available data and complexities of mapping geographic data has kept this inaccessible to many.
By opening up basic map making capabilities to everyone we are putting the liberating that data from depth of spreadsheets and database servers and opening it up to everyone. One map at a time. Read on for tips and tricks or head right on over to Censusmapper to make your first CensusMapper map!
Simple Maps
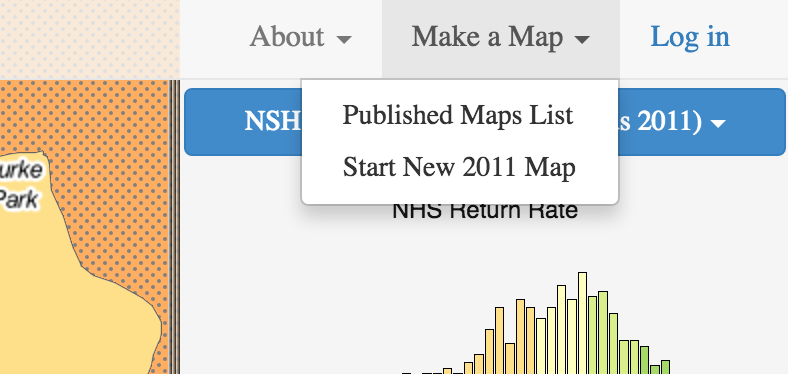 To make your own map, start by choosing “Start New 2011 Map” from the “Make a Map” menu. If you are planning on saving and sharing your map you should log in or create an account first, but you can play with mapping census data without an account.
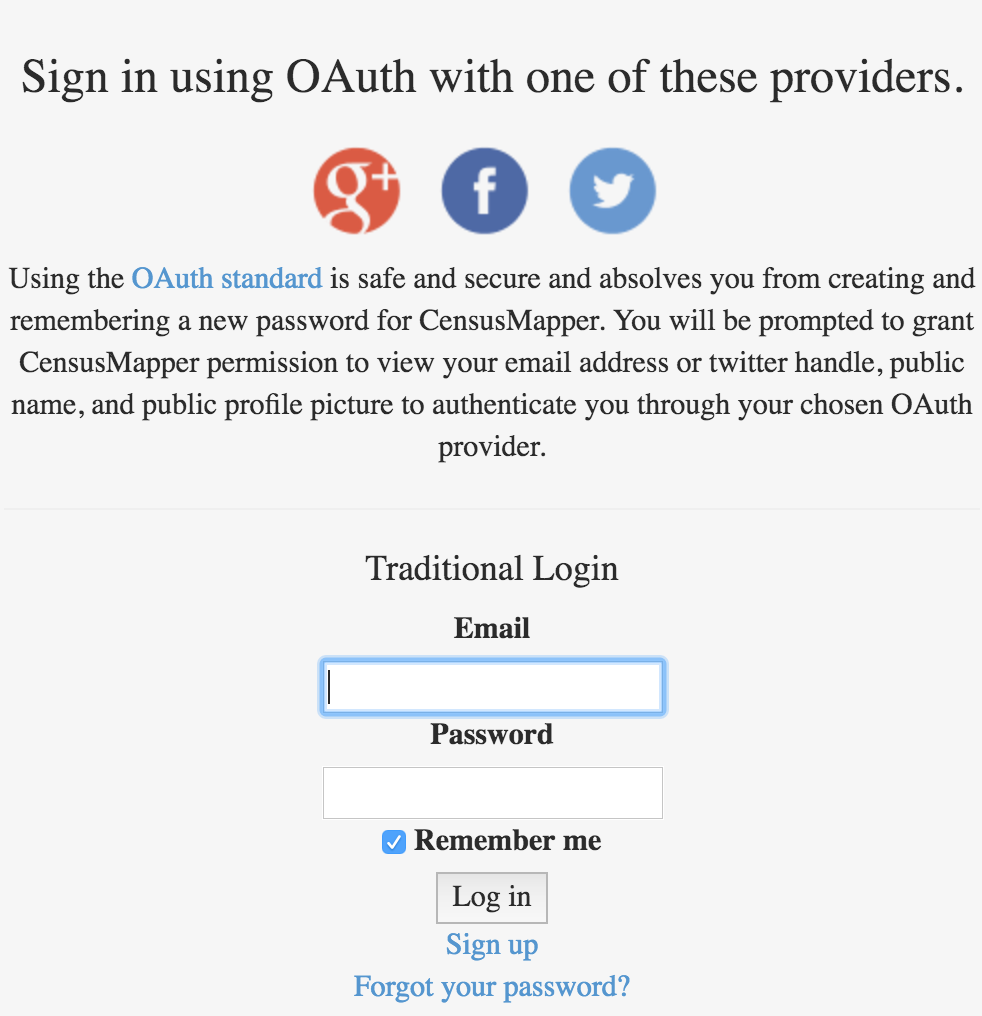 We tried to make logging in super simple by providing oAuth signup with popular providers, but you can also go the old fashioned way and create an account manually by providing username (email) and custom password.
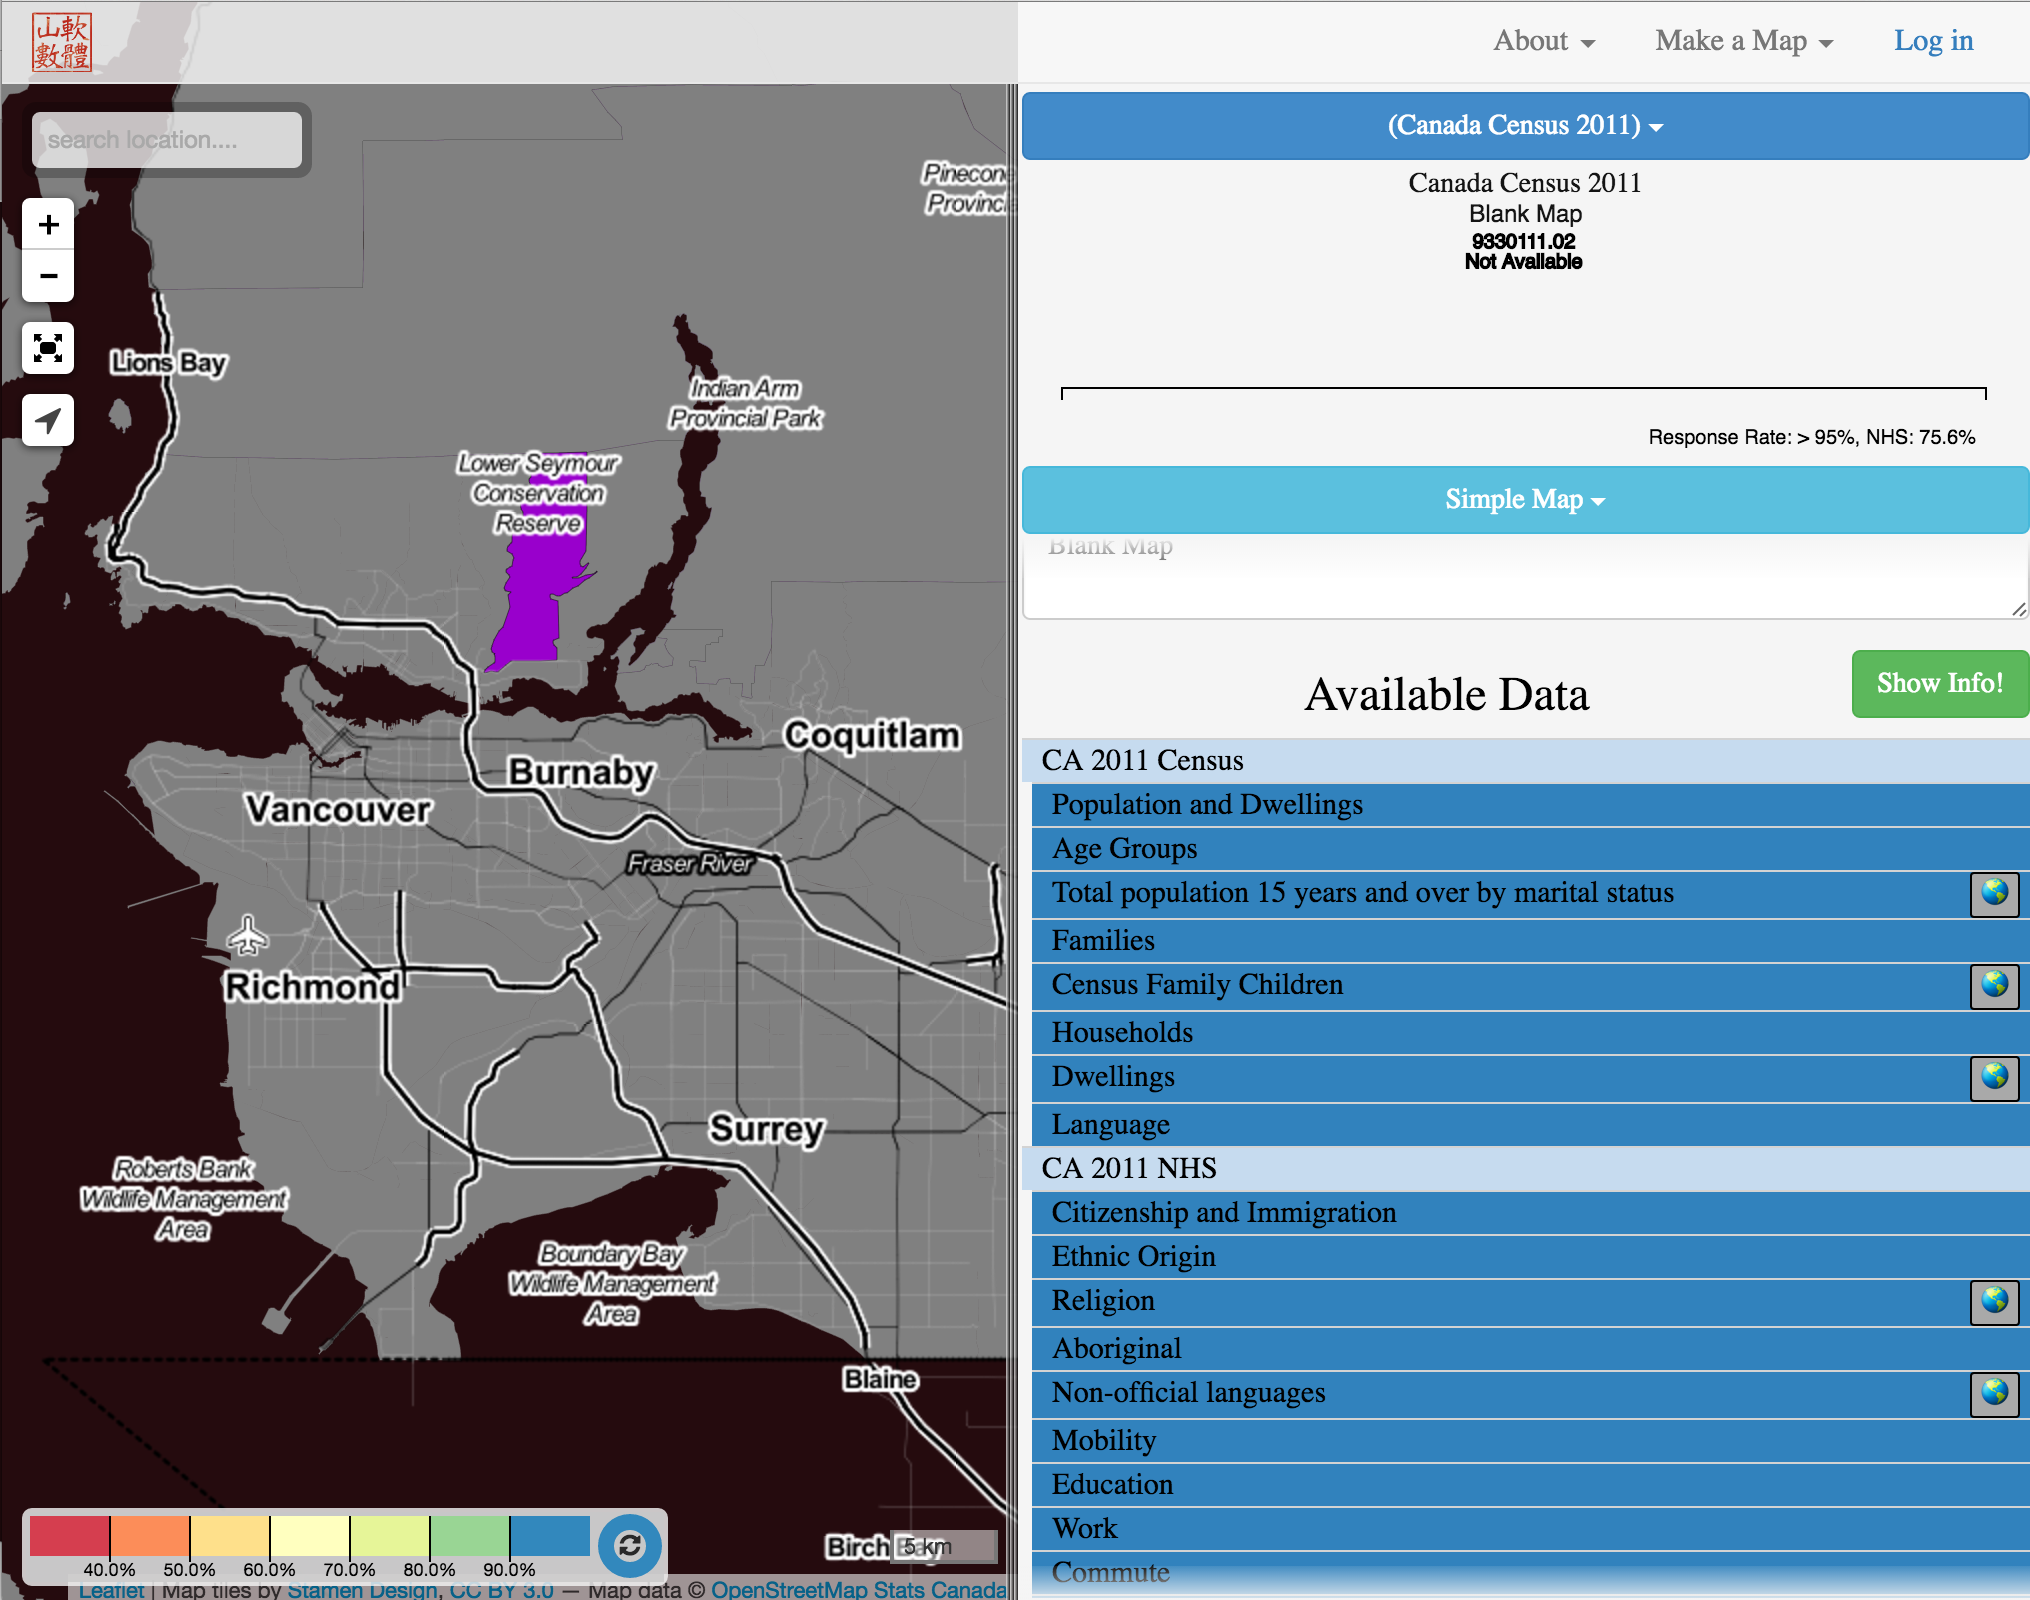 To start your new map, navigate down to the census variable picker at the bottom of the sidebar. Click the bars to expand or collapse them. Once you found a variable you want to map, click the ‘globe’ icon and select how you want to map the variable.
 Depending on what variable you choose you have the option to map simply map the variable, in this case the total number of people that are married or living with a common law partner, or map the variable as a percentage of a “parent” variable, so in this case map the percentage of people that are married or living with a common law partner out of all people 15 years or over. If in doubt what the variables mean, head over to the Census Dictionary to look up the definitions.
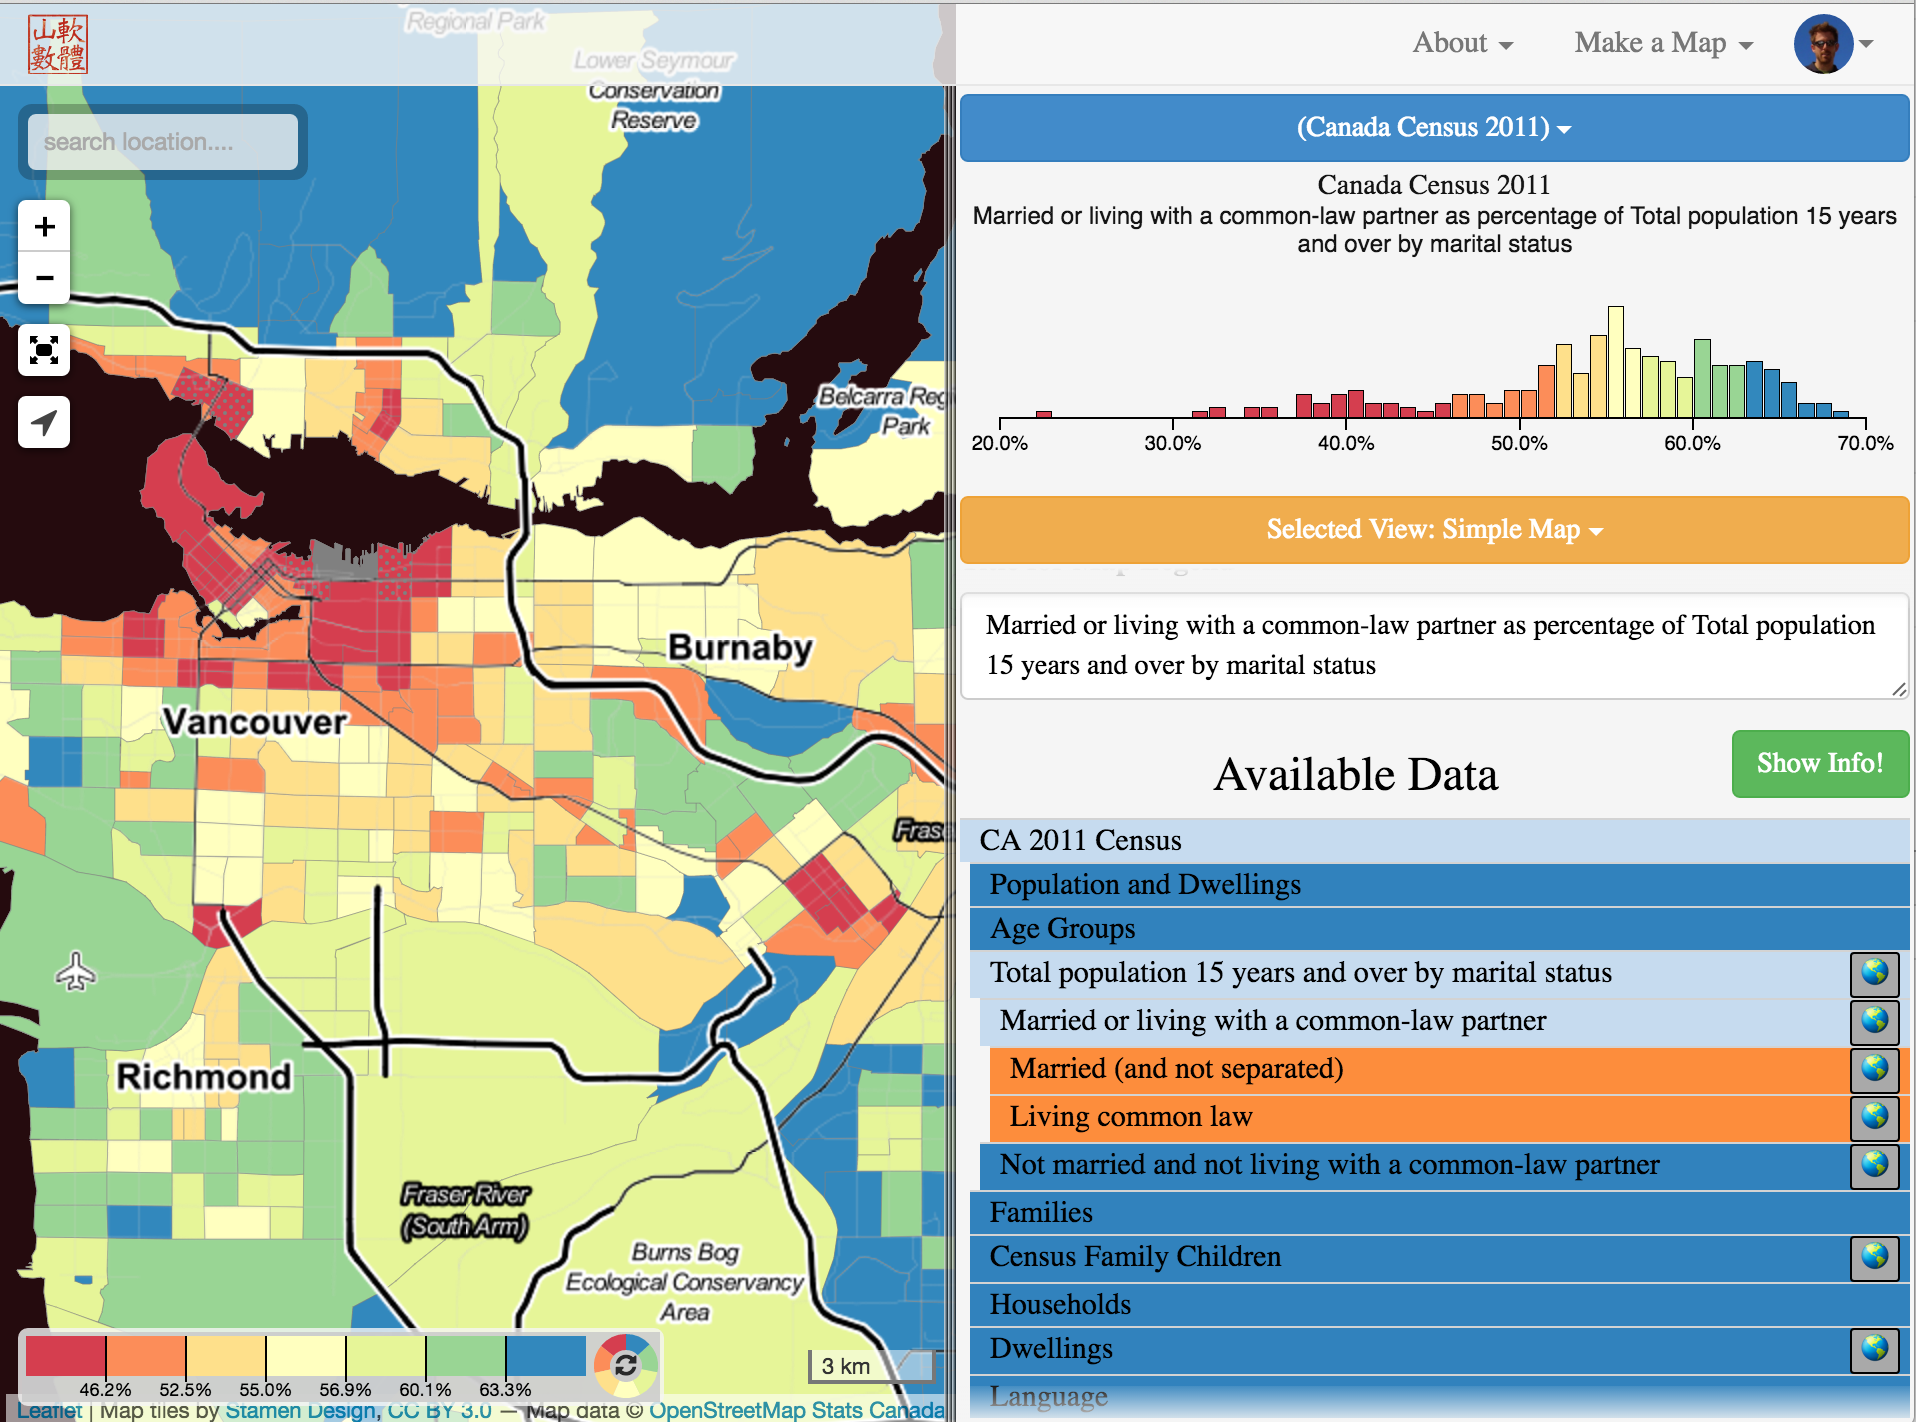 Once you press the button CensusMapper will do it’s magic and map the data for you. Zoom pan and use the search bar to expore the data across different regions and geographic aggregation levels in Canada. You may want to edit the automatically generated map label to make it more concise.
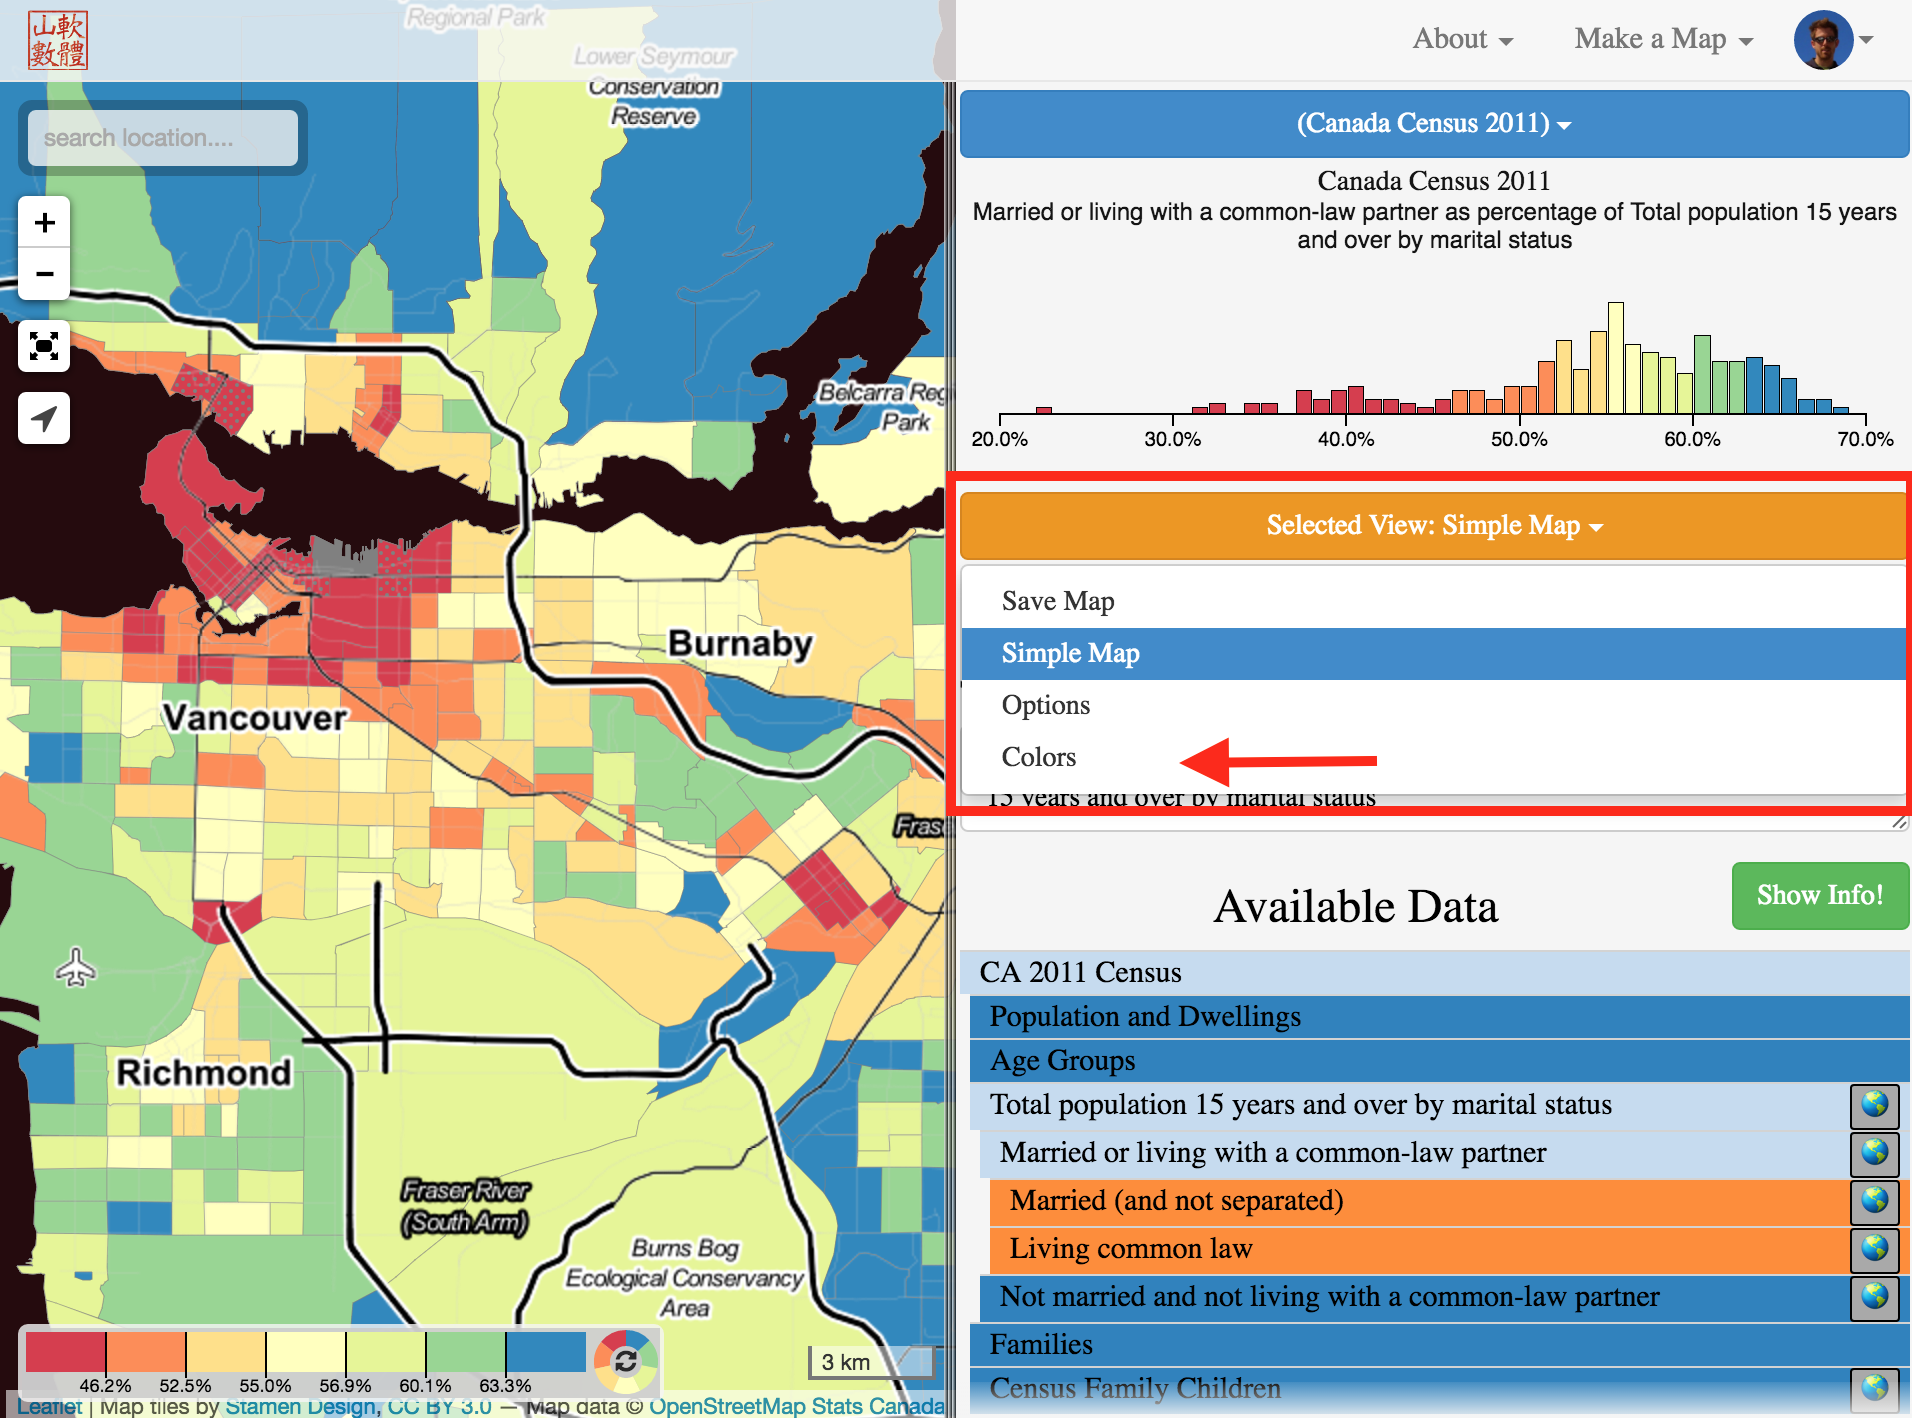 To style your map you can select the “Colors” option in the orange map editor menu in the sidebar.
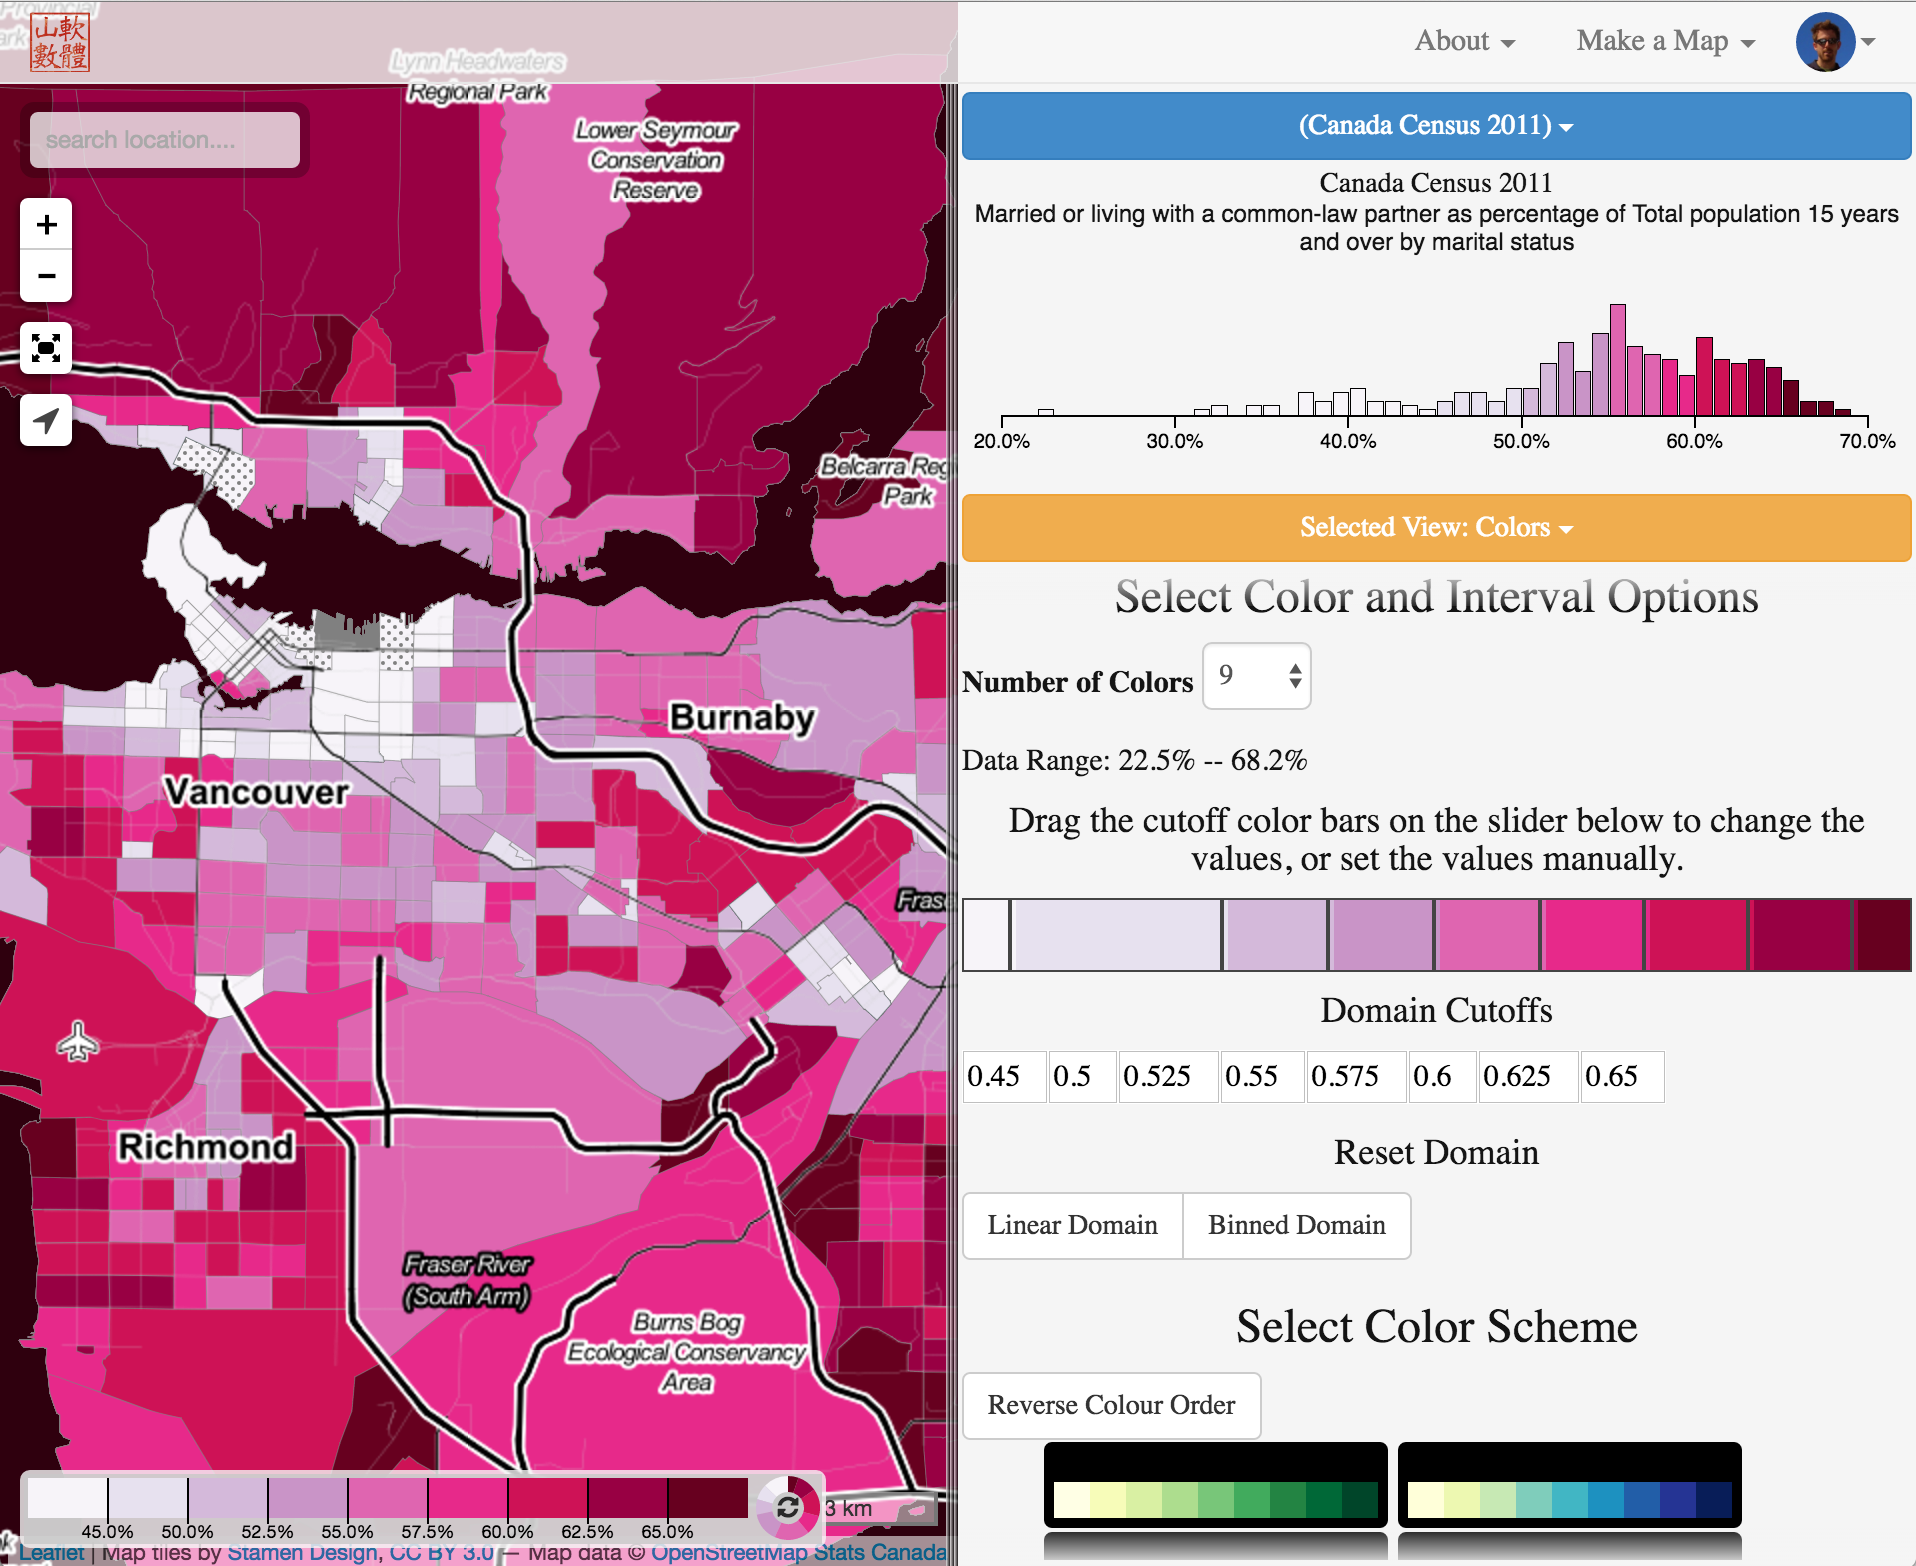 There you can style your map by selecting a custom color scheme and fine tune your domain cutoffs.
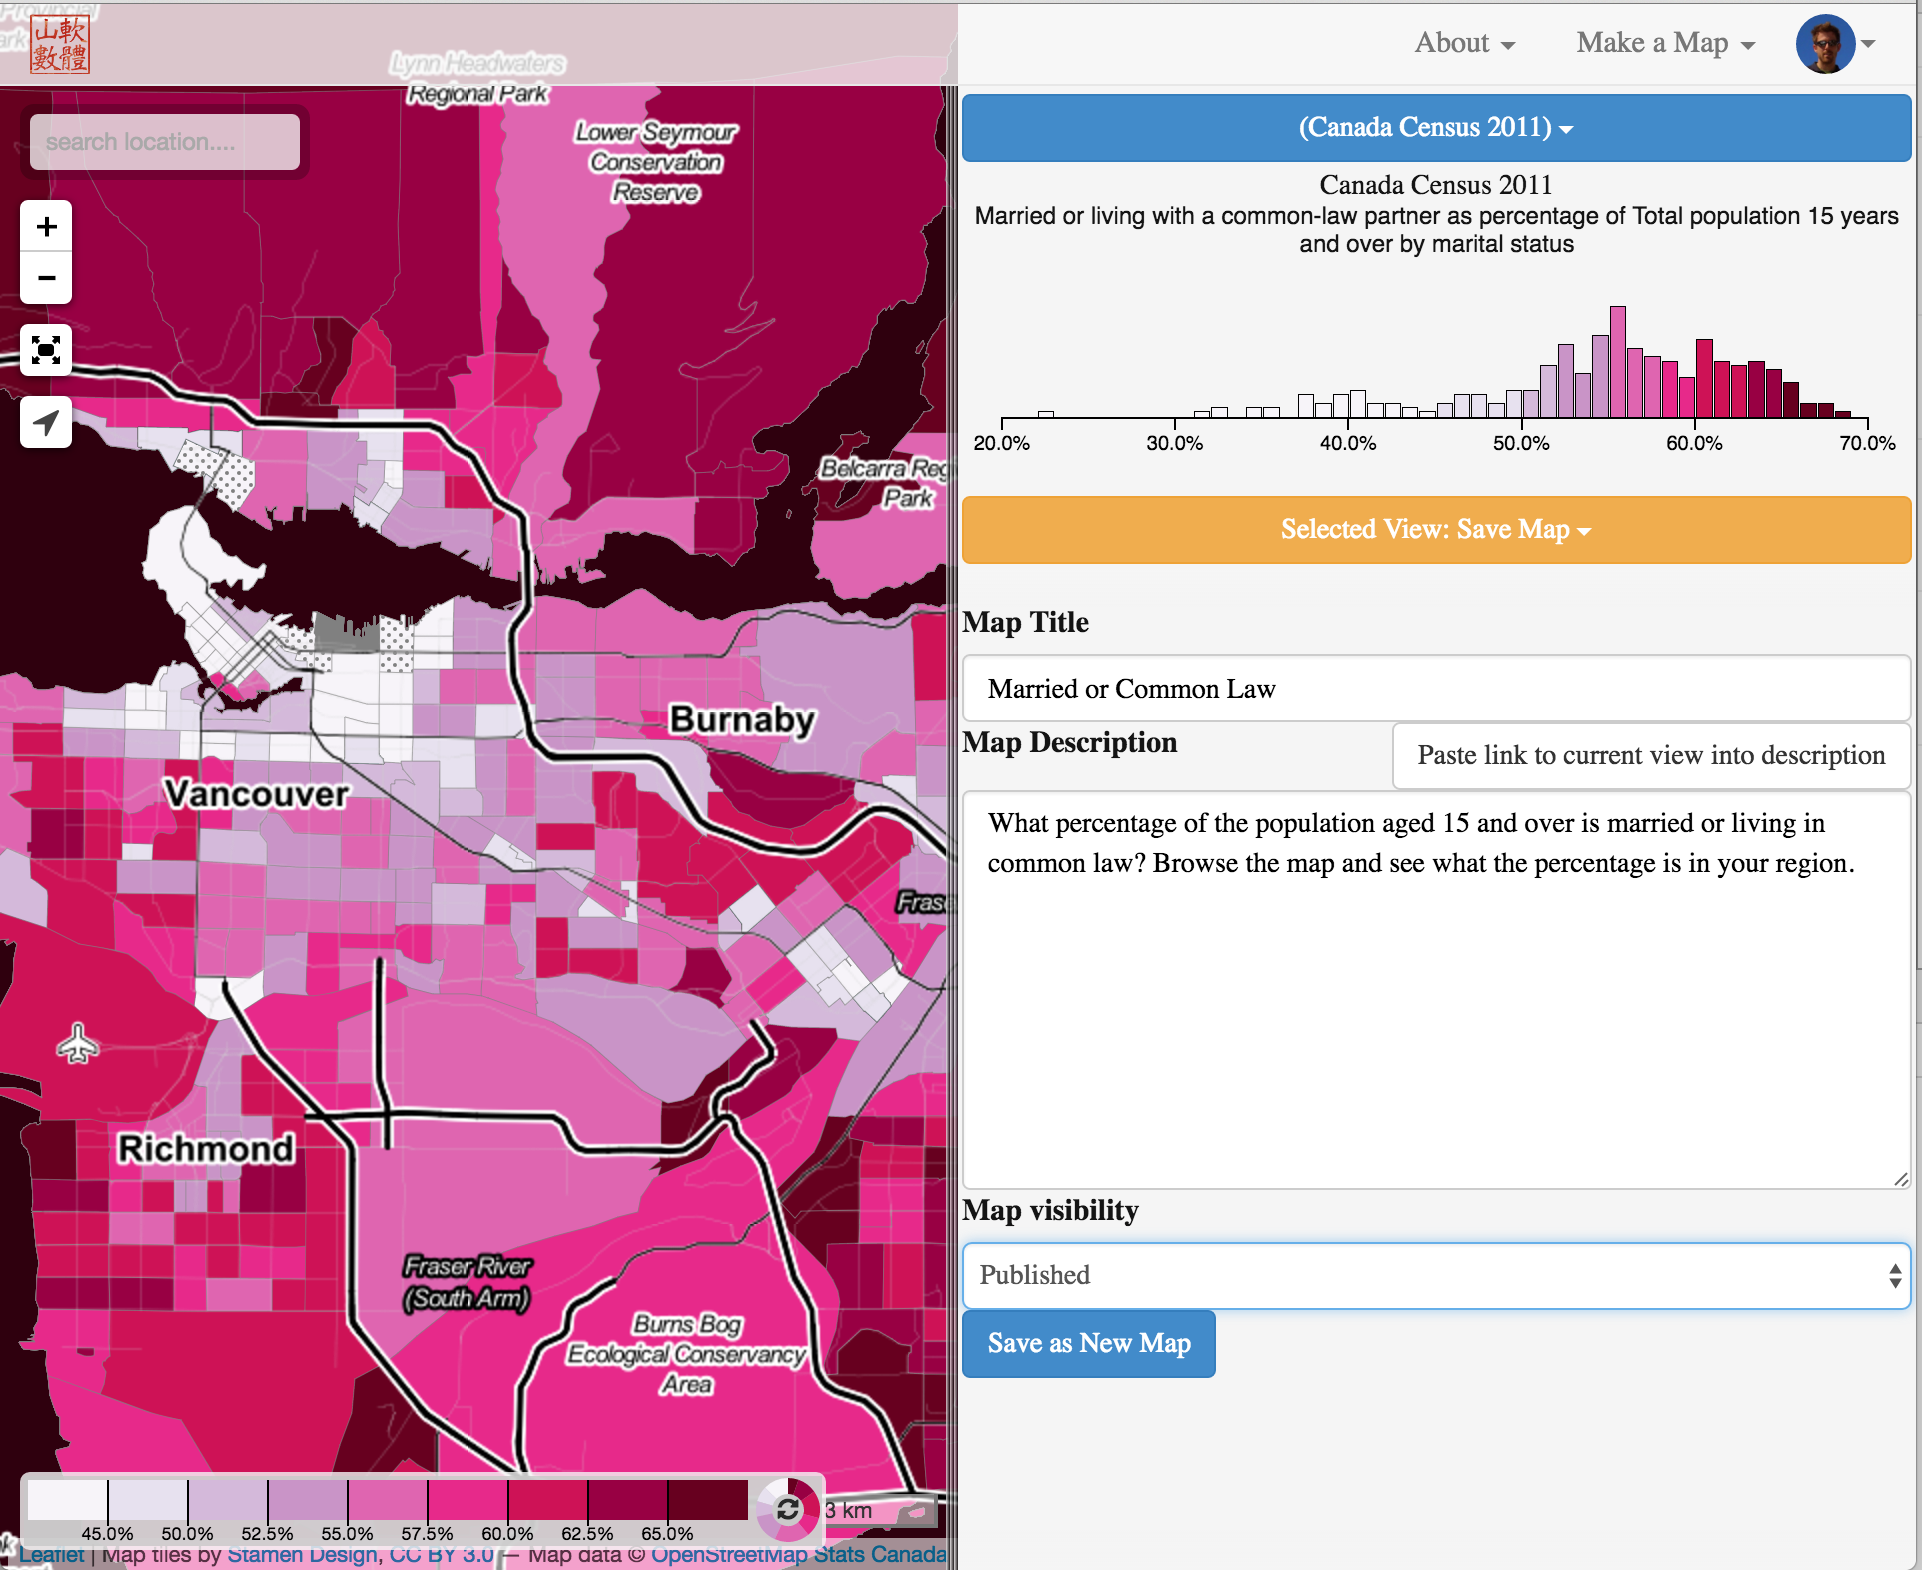 If you were signed in you could now select the “Save Map” option from the map editor menu and add a map title and a map description. Map descriptions can be styled in markdown.
Maps can tell many different stories, use the map description to give some background and rational for your map. A good map story might link to different views of the map to support the story telling. You can use the “Paste link to current view into description” button to link to different map views. You can also link to different CensusMapper maps to create deeply integrated map stories. Rich map stories can provide powerful insights into our communities.
If you want to share your map with others, make sure you set the map visibility from “Private” to “Published”. Otherwise others will get an “access denied” message when they attempt to view the map. Published maps will automatically appear on the extended map list, so please take some time and write appropriate descriptions that others can enjoy them.
Head on over to Censusmapper to get started.
Advanced Maps
The ability to quickly map any census variable is quite liberating. At the same time it is also restrictive. Imagine all the things that could be mapped if you could combine census variables in other ways. And CensusMapper has that capability to dynamically weave a number of census variables into a function to be mapped. But with that comes another level of complexity and potential pitfalls that, at the moment, prevents us from opening this up to the general public.
At the same time, we are still trying to figure out the overall funding model at CensusMapper. We believe that we have plenty of value in our advanced mapping capabilities, as well as in our ability to automatically populate custom geographic data with census variables and our backend data analysis capabilities to focus on paid products that allows us to open up the Simple Map model for everyone for free. At CensusMapper, we love open data. And with time as we refine our funding model we may open up more advanced mapping capabilities to put more data into the palm of everyone’s hands.
Our Worries
We are also a bit worried about how CensusMapper will be used. The internet has the ability to turn the most beautiful thing into something ugly, and we are hoping that mappers will use the tool responsibly and make meaningful maps that tell a story, instead of vanity maps or maps meant to isolate or smear specific groups of people. If we feel that the tool is being abused we might have to enforce a real name policy or partially close down CensusMapper. Please map responsibly.
Bugs
If you find any, let us know. The tool should work well on Mac using Chrome, Safari or Firefox and should work reasonably well on Windows with Chrome and Firefox. iPad, iPhone and modern Android should also work well. Please contact us if you find anything not working properly.
Reuse
Citation
@misc{census-mapping-for-everyone.2016,
  author = {{von Bergmann}, Jens},
  title = {Census {Mapping} for {Everyone}},
  date = {2016-05-04},
  url = {https://doodles.mountainmath.ca/posts/2016-05-04-census-mapping-for-everyone/},
  langid = {en}
}
