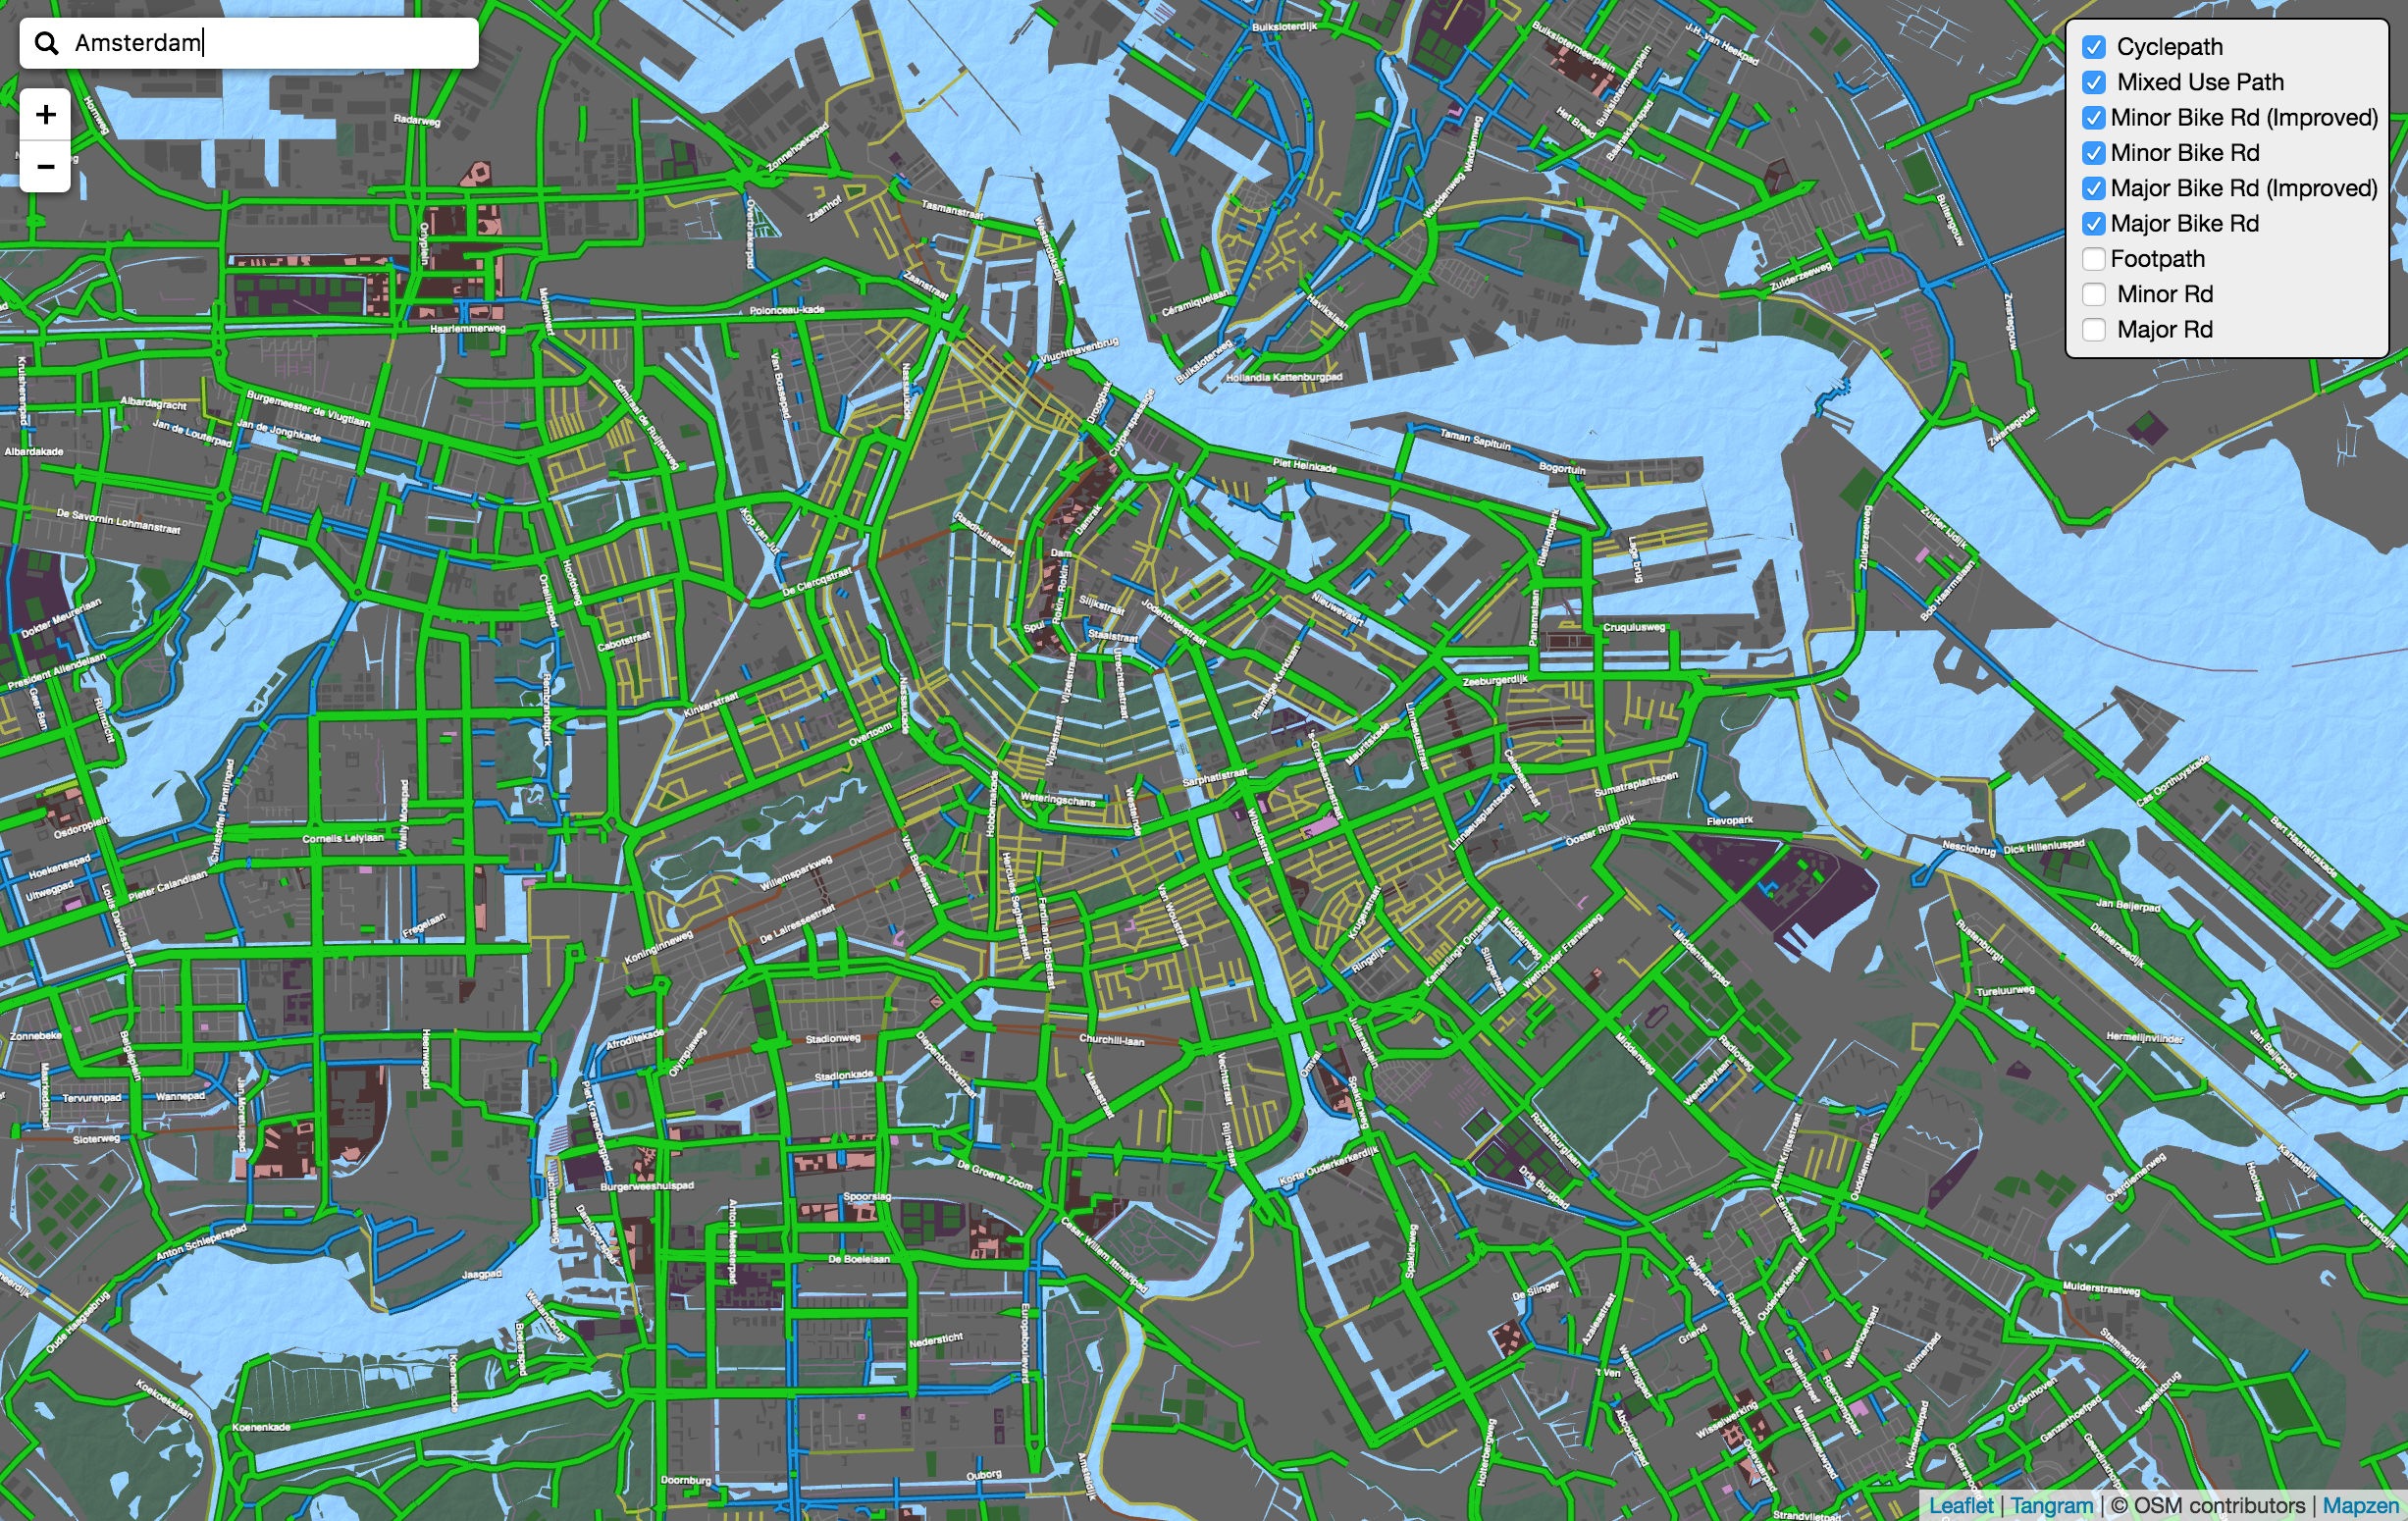
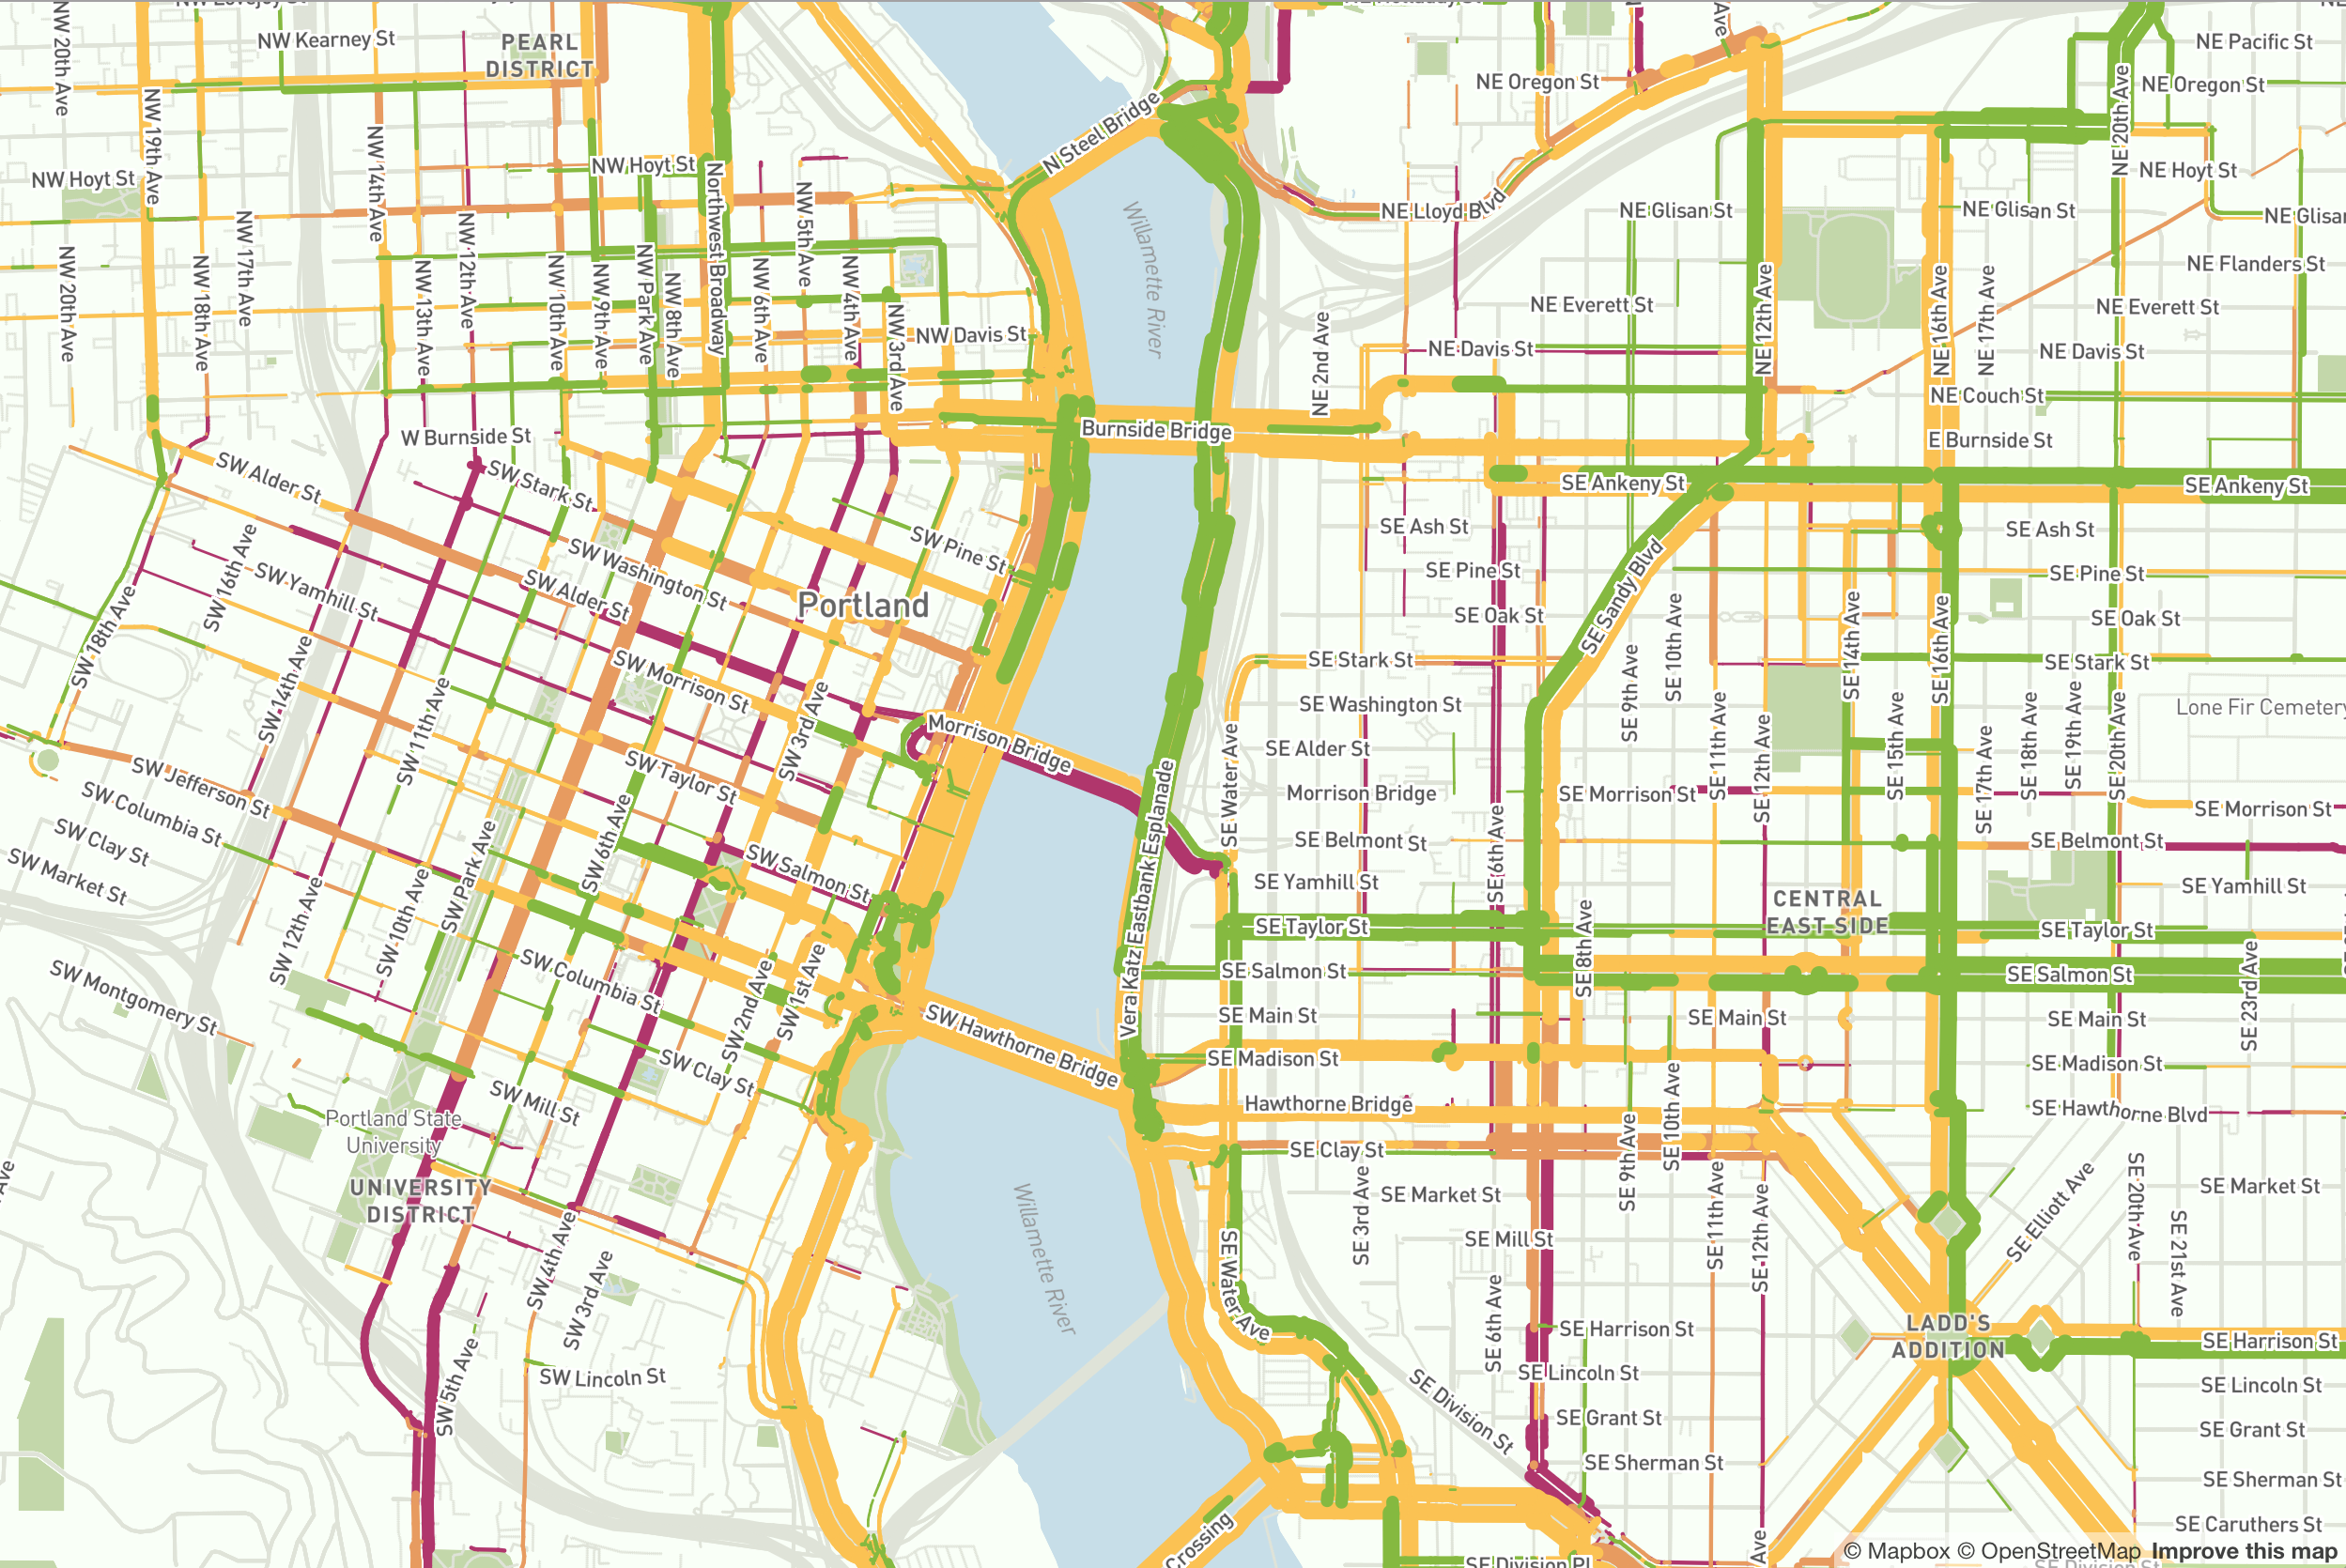
Last week Mapzen announced that they included bike data in their OSM vector tiles. That’s just what the doctor ordered to continue on my path towards the perfect bike map that I started on, explored routing and looked at improving OSM bike data. Now that I don’t need to extract bike data myself any more it is time to take these maps global. And maybe add some minor improvements.
To make the bike map boils down to deciding what OSM roads, paths, etc to map and how to map them. And what contextual information to display. The only choices we have to make is how to organize the bike related data that exists in open street maps. Let’s be a little radical! Our emphasis will be on safety and cycling comfort for the casual rider.
We will emphasise separated cycletracks by making them brightest and thickest. Shared pedestrian/bike infrastructure will get a separate colour and be a little bit thinner. Next we layer on designated bike infrastructure by prioritizing lanes on residential roads, then “shared” residential roads, then residential roads, then lanes and “shared” designations on increasingly busy roads. Lastly we add residential and larger roads. And we only label roads that we are actually interested in.
We allow some customization by emphasizing or de-emphasizing certain types of infrastructure. By default, roads without special bike designation are de-emphasized.
For good measure we added basic land use categories to highlight possible destinations, and we add building footprints for reference as available.
This scheme is geared toward the safety conscious and motor-traffic-adverse cyclist in North America. In Europe other designations exist that might call for a different priority. MAMILs might want a different colour scheme altogether.
To get a better view you can also take the map full-screen.
Data Quality
The data for the map comes right out of Open Streets Map. That means that if something is missing or not right you can just go and fix it! To make things a little easier when you are on a desktop computer, just “shift-click” where the problem is and it will bring the open street map editor up for that position. You might have to log in first or create a free account before you can help improve the bike map.
There is a bit of a lag between changes being made in open street map and them filtering down to the mapzen tiles so that they will show up on the map on the map, so don’t fret if things aren’t up to date immediately.
Global
 And this bike map is global. The quality of the map depends on the quality of OSM data, in the case of Amsterdam it makes it abundantly clear why casual cyclists keep dreaming about the infrastructure in this city.
The choice of emphasis for the maps are based on North America, or more narrowly Vancouver, where I live. So this might need adjusting for local context to better fit local OSM conventions. Use the search bar and explore your region.
The Real Deal
 Sadly, all of this effort is really coming at things from the wrong angle. The best way to do this, as we outlined earlier, is to base a bike map on how cyclists actually use the roads and pathways, instead of how they got classified in Open Street Map or what municipalities think they should be classified. The problem is that we don’t have that data. At least not yet. But there are really cool efforts out there to get that data and make it available.
I really like the approach that Ride Report has taken. Strava works reasonably well for recreational cyclists, but it does a terrible job at capturing where transportation cyclists go and makes no effort in understanding their comfort level. Ride Report takes a different approach by automagically figuring out what you are doing and recording your cycling trips. All without you ever having to press a “start” or “stop” button, which is key if you want to understand where transportation cyclists go. On top of that it prompts you to simply rate your bike trip once you are done, and you can do this easily from your lock screen. Then Ride Report aggregates the data to produce stress maps, and possibly other important data that can guide infrastructure improvements.
In this day and age of data driven decision making I would really like more municipalities to support efforts like Ride Report that generate real meaningful data on transportation cycling. And as a by-product one could take cycling maps to the next level and add actual cycling usage and comfort.
Issues
There are still some issues. Some bike infrastructure, for example OSM paths, only become visible at zoom level 13 or higher. That’s just the way the vector tile service works. Secondary roads are only visible at zoom level 12 or higher, and this includes “bike boulevards”. Cyclepaths are only visible at zoom level 11 or higher. If one wants to have high-level bike maps one probably needs a dedicated vector tile service for bike infrastructure.
Apologies
Since this is just a blog post I have not gone out of my way to make sure this map works on every computer and browser. Basically, I am leaveraging off of Mapzen’s awesome Tangram mapping engine to keep things simple on my end, but that means the maps will only show on modern computers (and modern browsers, so no IE). If your computer is having trouble displaying the map just pull out your phone, chances are it it is much better equipped to handle modern web technology.
Also, I made a bunch of choices how to display bike infrastructure. These are just a function of my personal preferences and what OSM data has to offer. If you notice issues with the OSM data, you can fix it in OSM and it will show on the map once the changes have filtered through to Mapzen’s tile service. If you don’t like my personal prefernces, just grab the html for the map and the scene file and change it at your heart’s content. You don’t need any special server to host these files, I dumped them on my static blog. Even a public dropbox folder can host these maps.
So grab the code and customize it at your heart’s content. Take full control on how to display bike infrastructure and roads, and what amenities to show and how to style them.
Reuse
Citation
@misc{my-global-bike-map.2016,
  author = {{von Bergmann}, Jens},
  title = {My {Global} {Bike} {Map}},
  date = {2016-05-16},
  url = {https://doodles.mountainmath.ca/posts/2016-05-16-my-global-bike-map/},
  langid = {en}
}
