Ever since I played with the LIDAR-generated building height data I thought that I should use that to map gross floor area (GFA) and floor space ratio (FSR). Gross floor area is the total floor area inside the building envelope. So for a three storey building, it is the area of the footprint times three. Floor space ratio is the GFA divided by the area of the parcel it sits on. There are several reasons why this may be interesting.
GFA is the currency of the developer. Especially once we enter the world of apartment or commercial buildings, gross floor area is directly proportional to the amount of money a developer can charge for a property, either when stratified and sold or when rented out.
FSR on the other hand is a measure of density, and it is the currency of the zoning code. Height and site coverage are also regulated in the zoning code and there is an obvious relationship to FSR. But because GFA is so important to the developer, FSR usually receives more attention in public discussions.
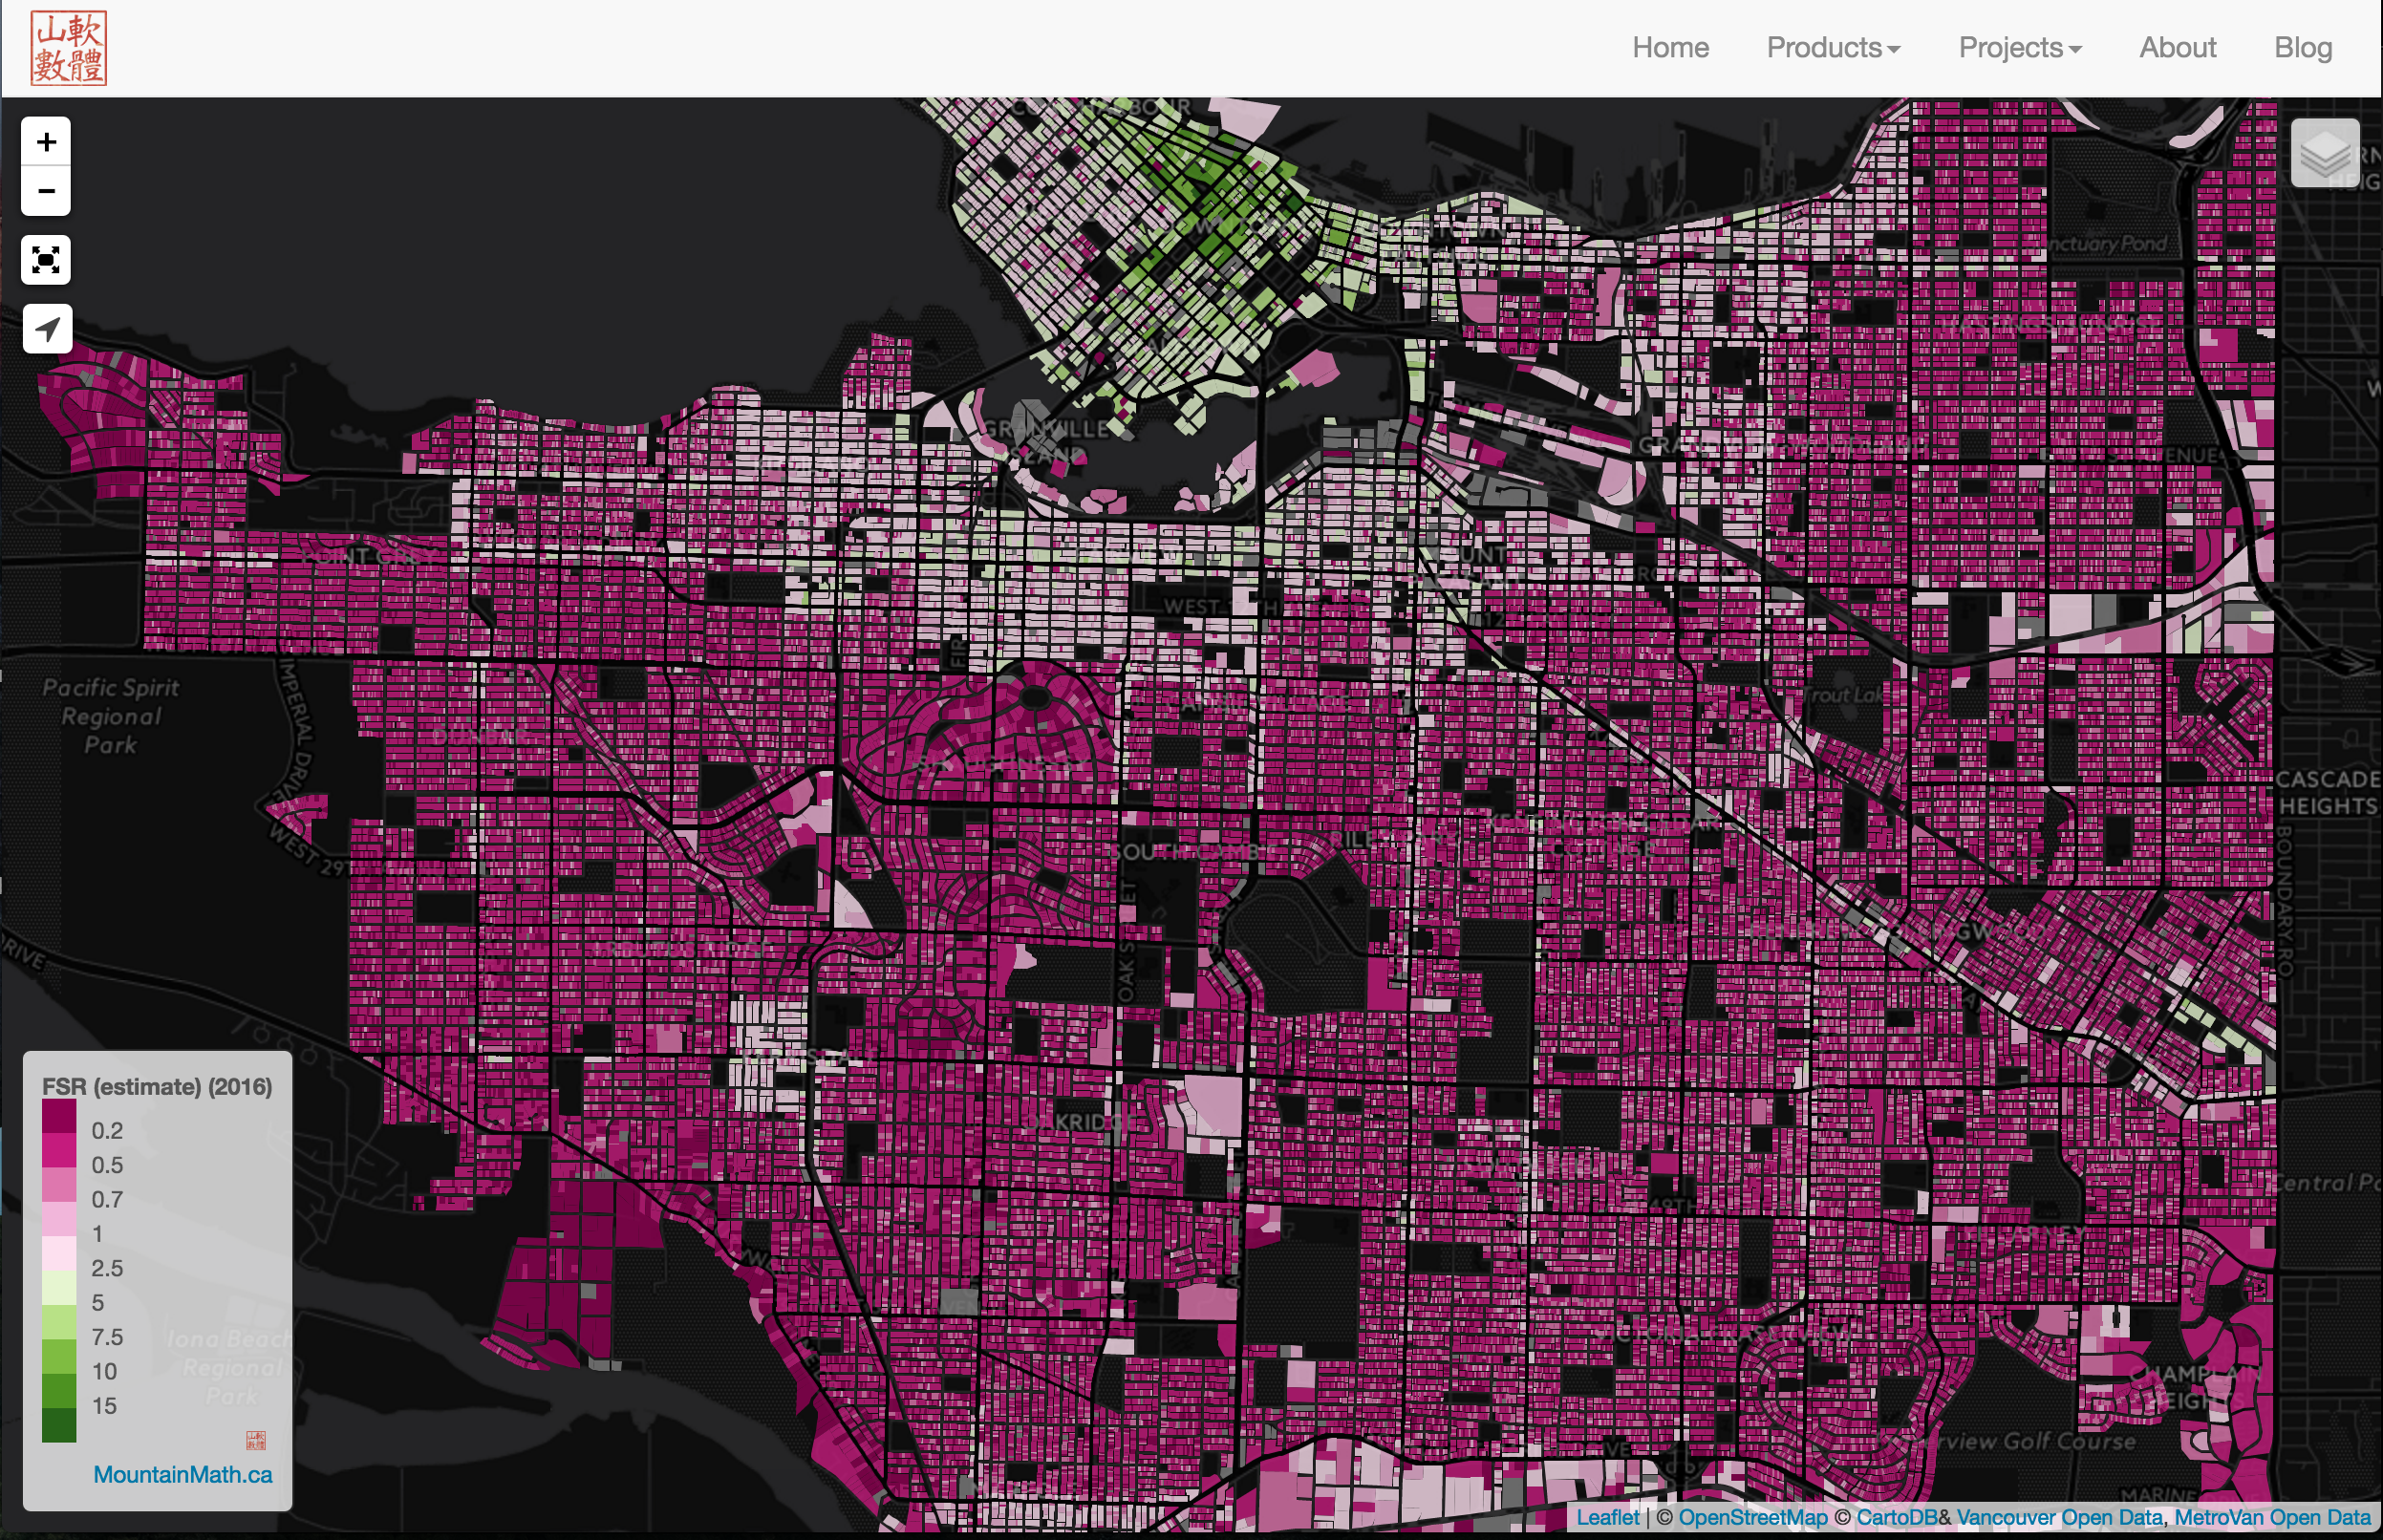 Read on or head straight for the interactive map to browse Vancouver by FSR. Read the disclaimer at the bottom before using any data for purposes other than general reference.
Maximum Allowable FSR and Spot Zoning.
The maximum allowable FSR is set by the zoning code. Because land is so valuable in Vancouver, most people will try to maximize GFA when building a new building, so they typically go right up to the maximum allowable FSR. Previously we have examined the effects of various related metrics like height and site coverage for single family homes.
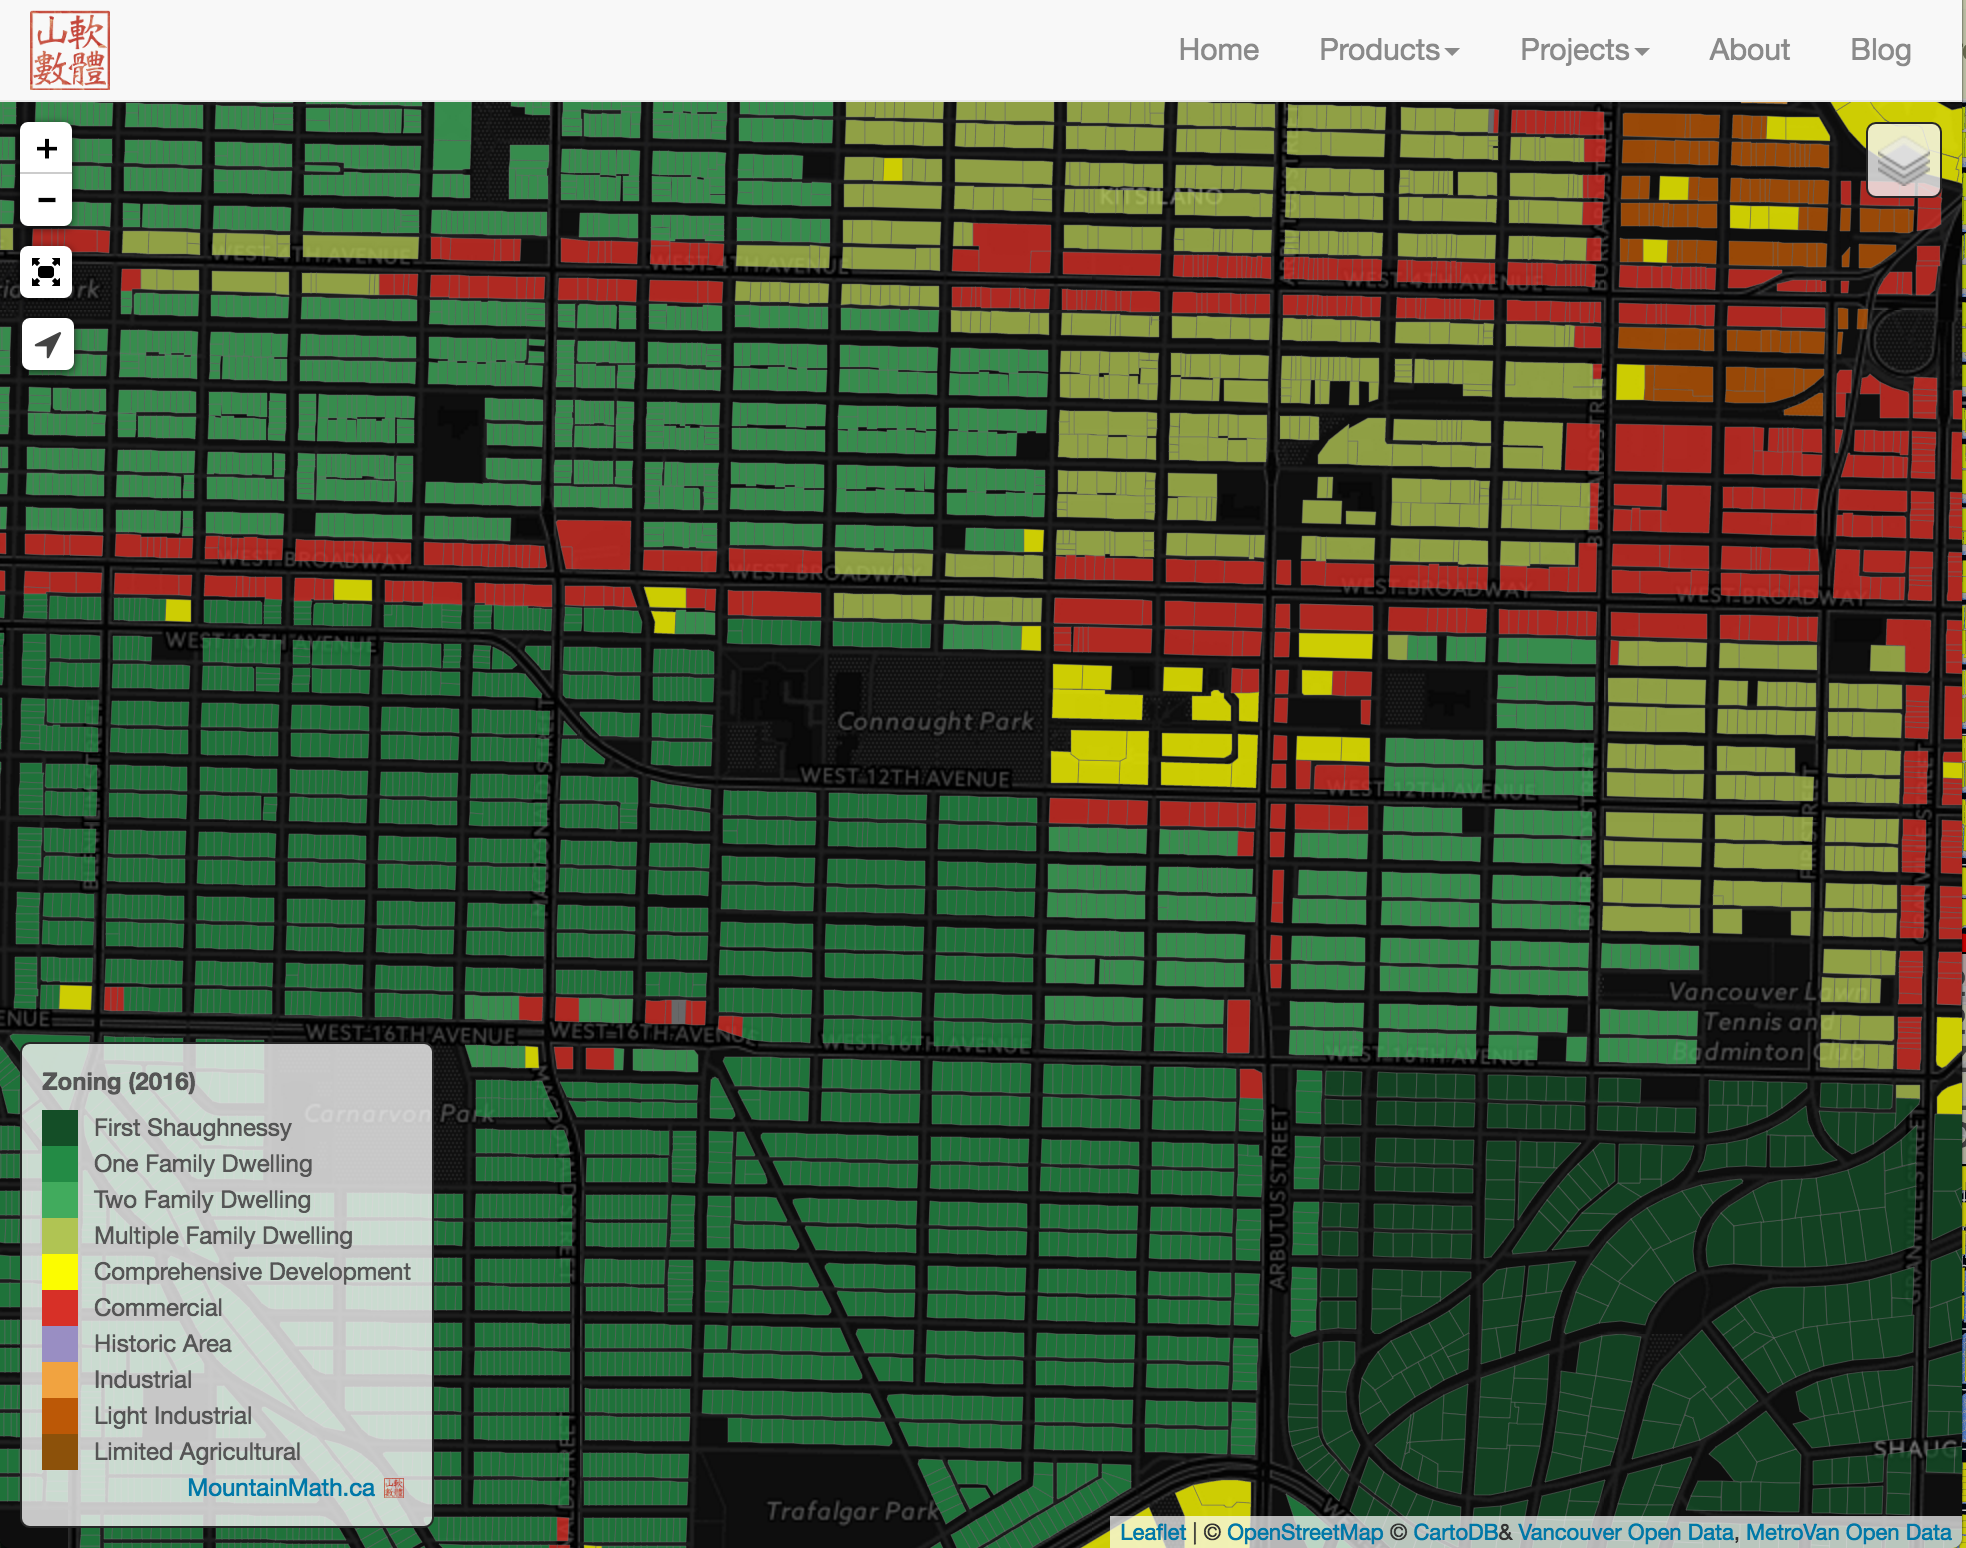 At least this is how it works for RS/RT zones. If you are looking to develop a different property, say a mixed use or an apartment building or commercial building you will probably be looking to up-zone. That is, you will try to convince the city (and the local population) to allow you to build more GFA than zoning would allow. If successful the city will create a new zone just for your property and ask for some compensation in form of CACs (aiming to recoup about 80% of the uplift in value the up-zoning creates) in return. That process is called spot zoning and it can be seen in form of the little “Comprehensive Development” zones that are visible as yellow sprinkles in the otherwise quite uniform zones on the map.
In reality the process of up-zoning a property is a lot more complex, arduous and time consuming, which favours larger developers with deep pockets that can take the risk and sit out the long process of eventually obtaining higher GFA. One of the many reasons why the “missing middle” is missing.
Mapping Density
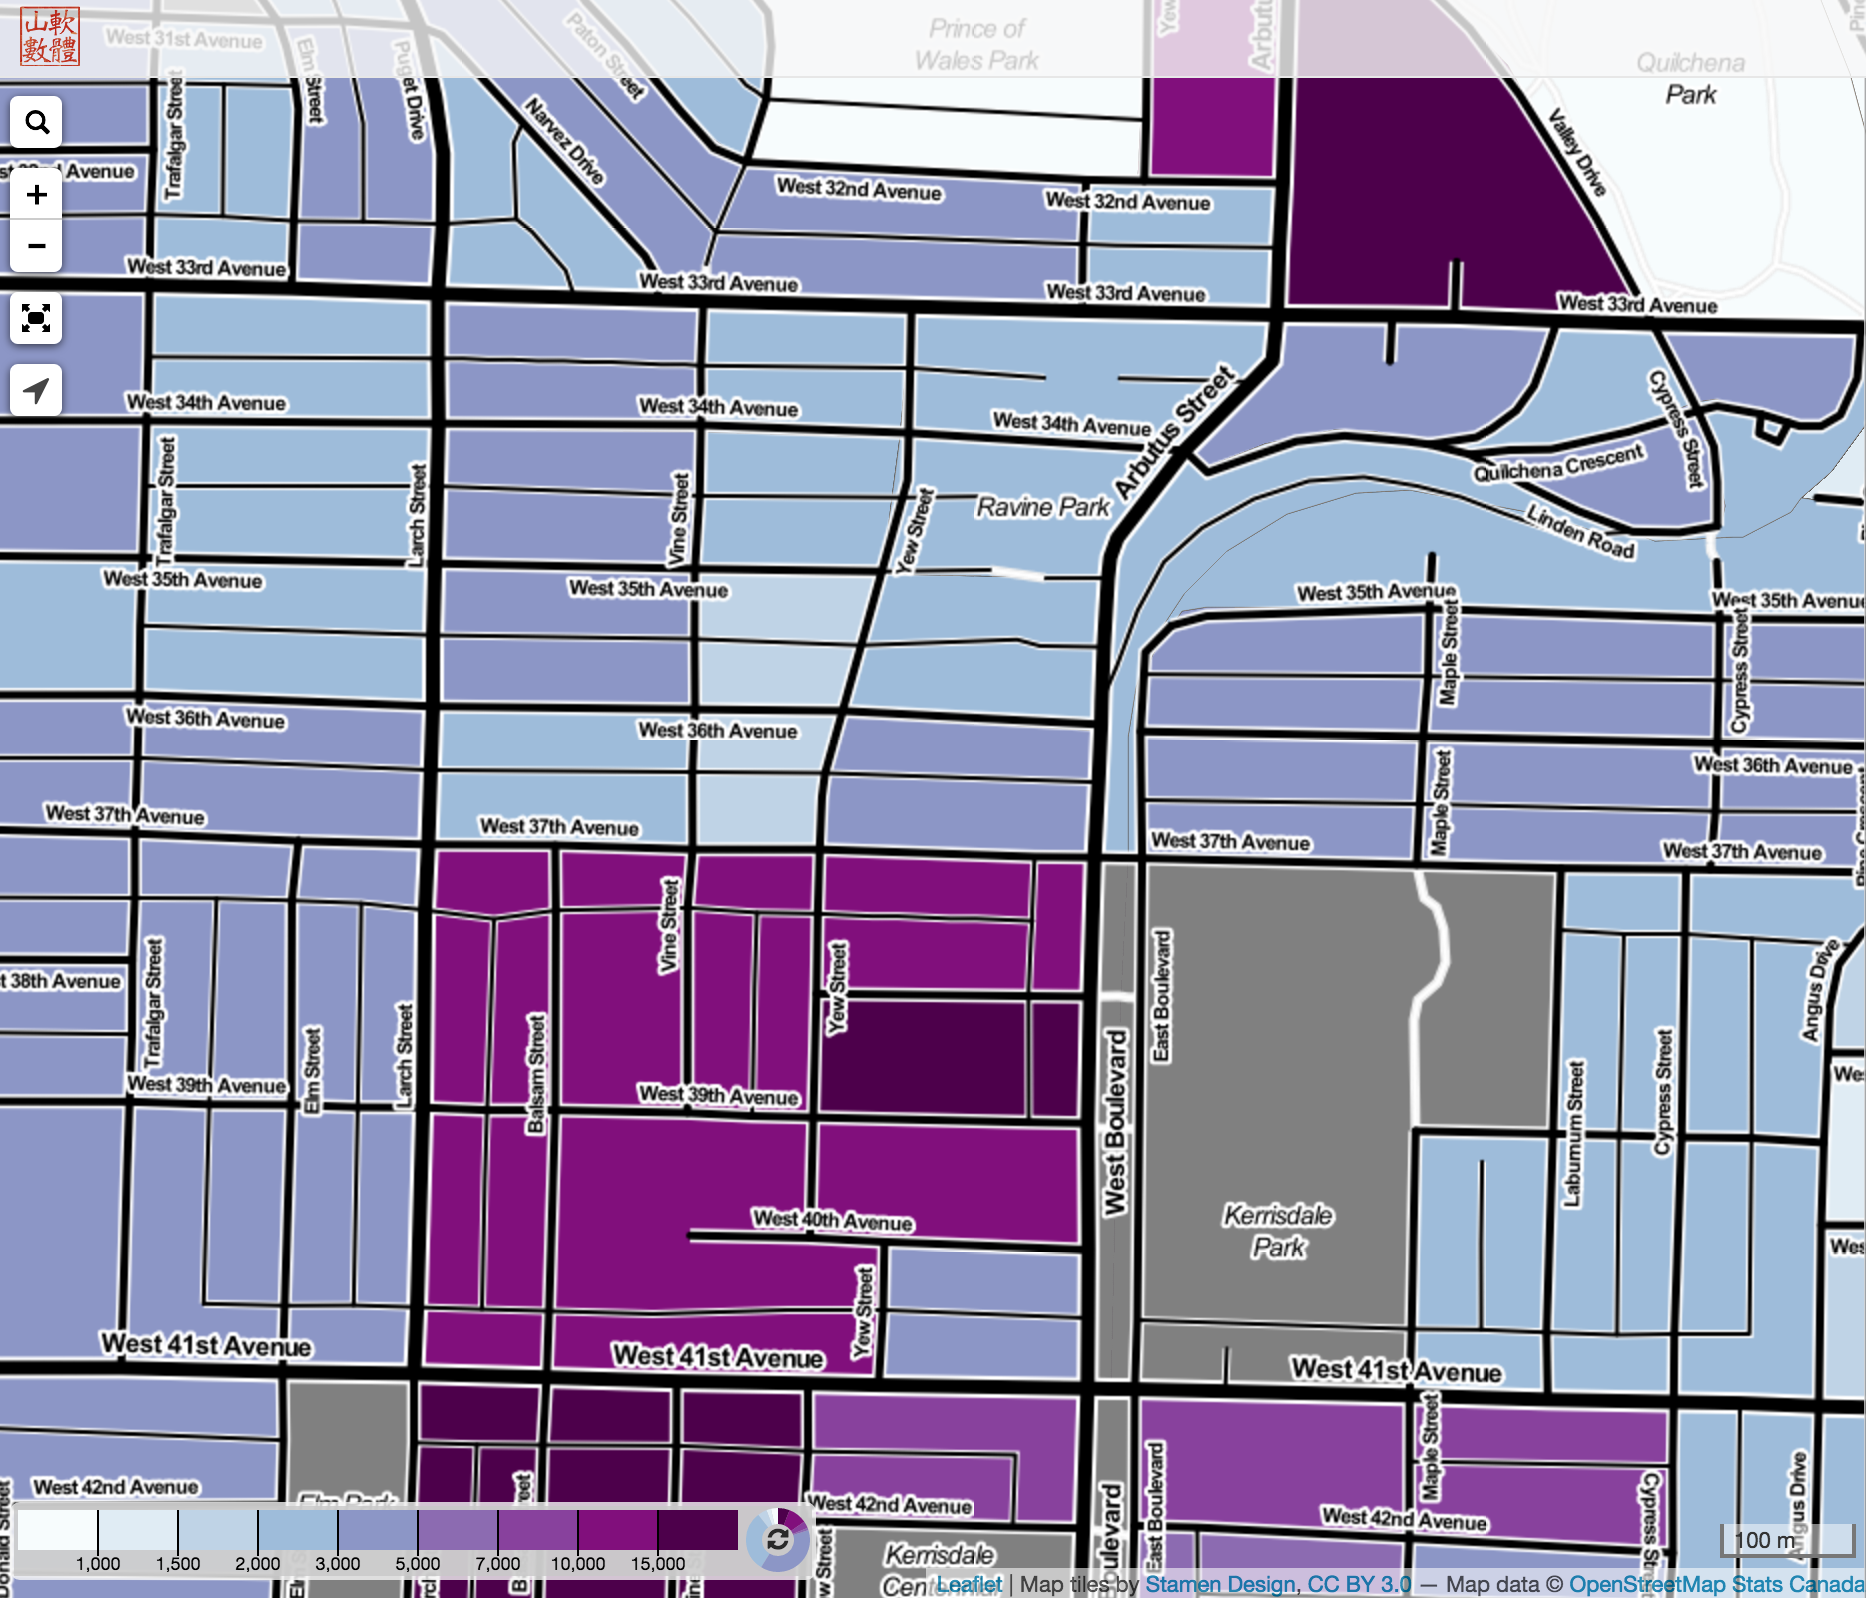 From Census data we know the nighttime density, that is where people live and sleep. But we don’t know where they are during the daytime.
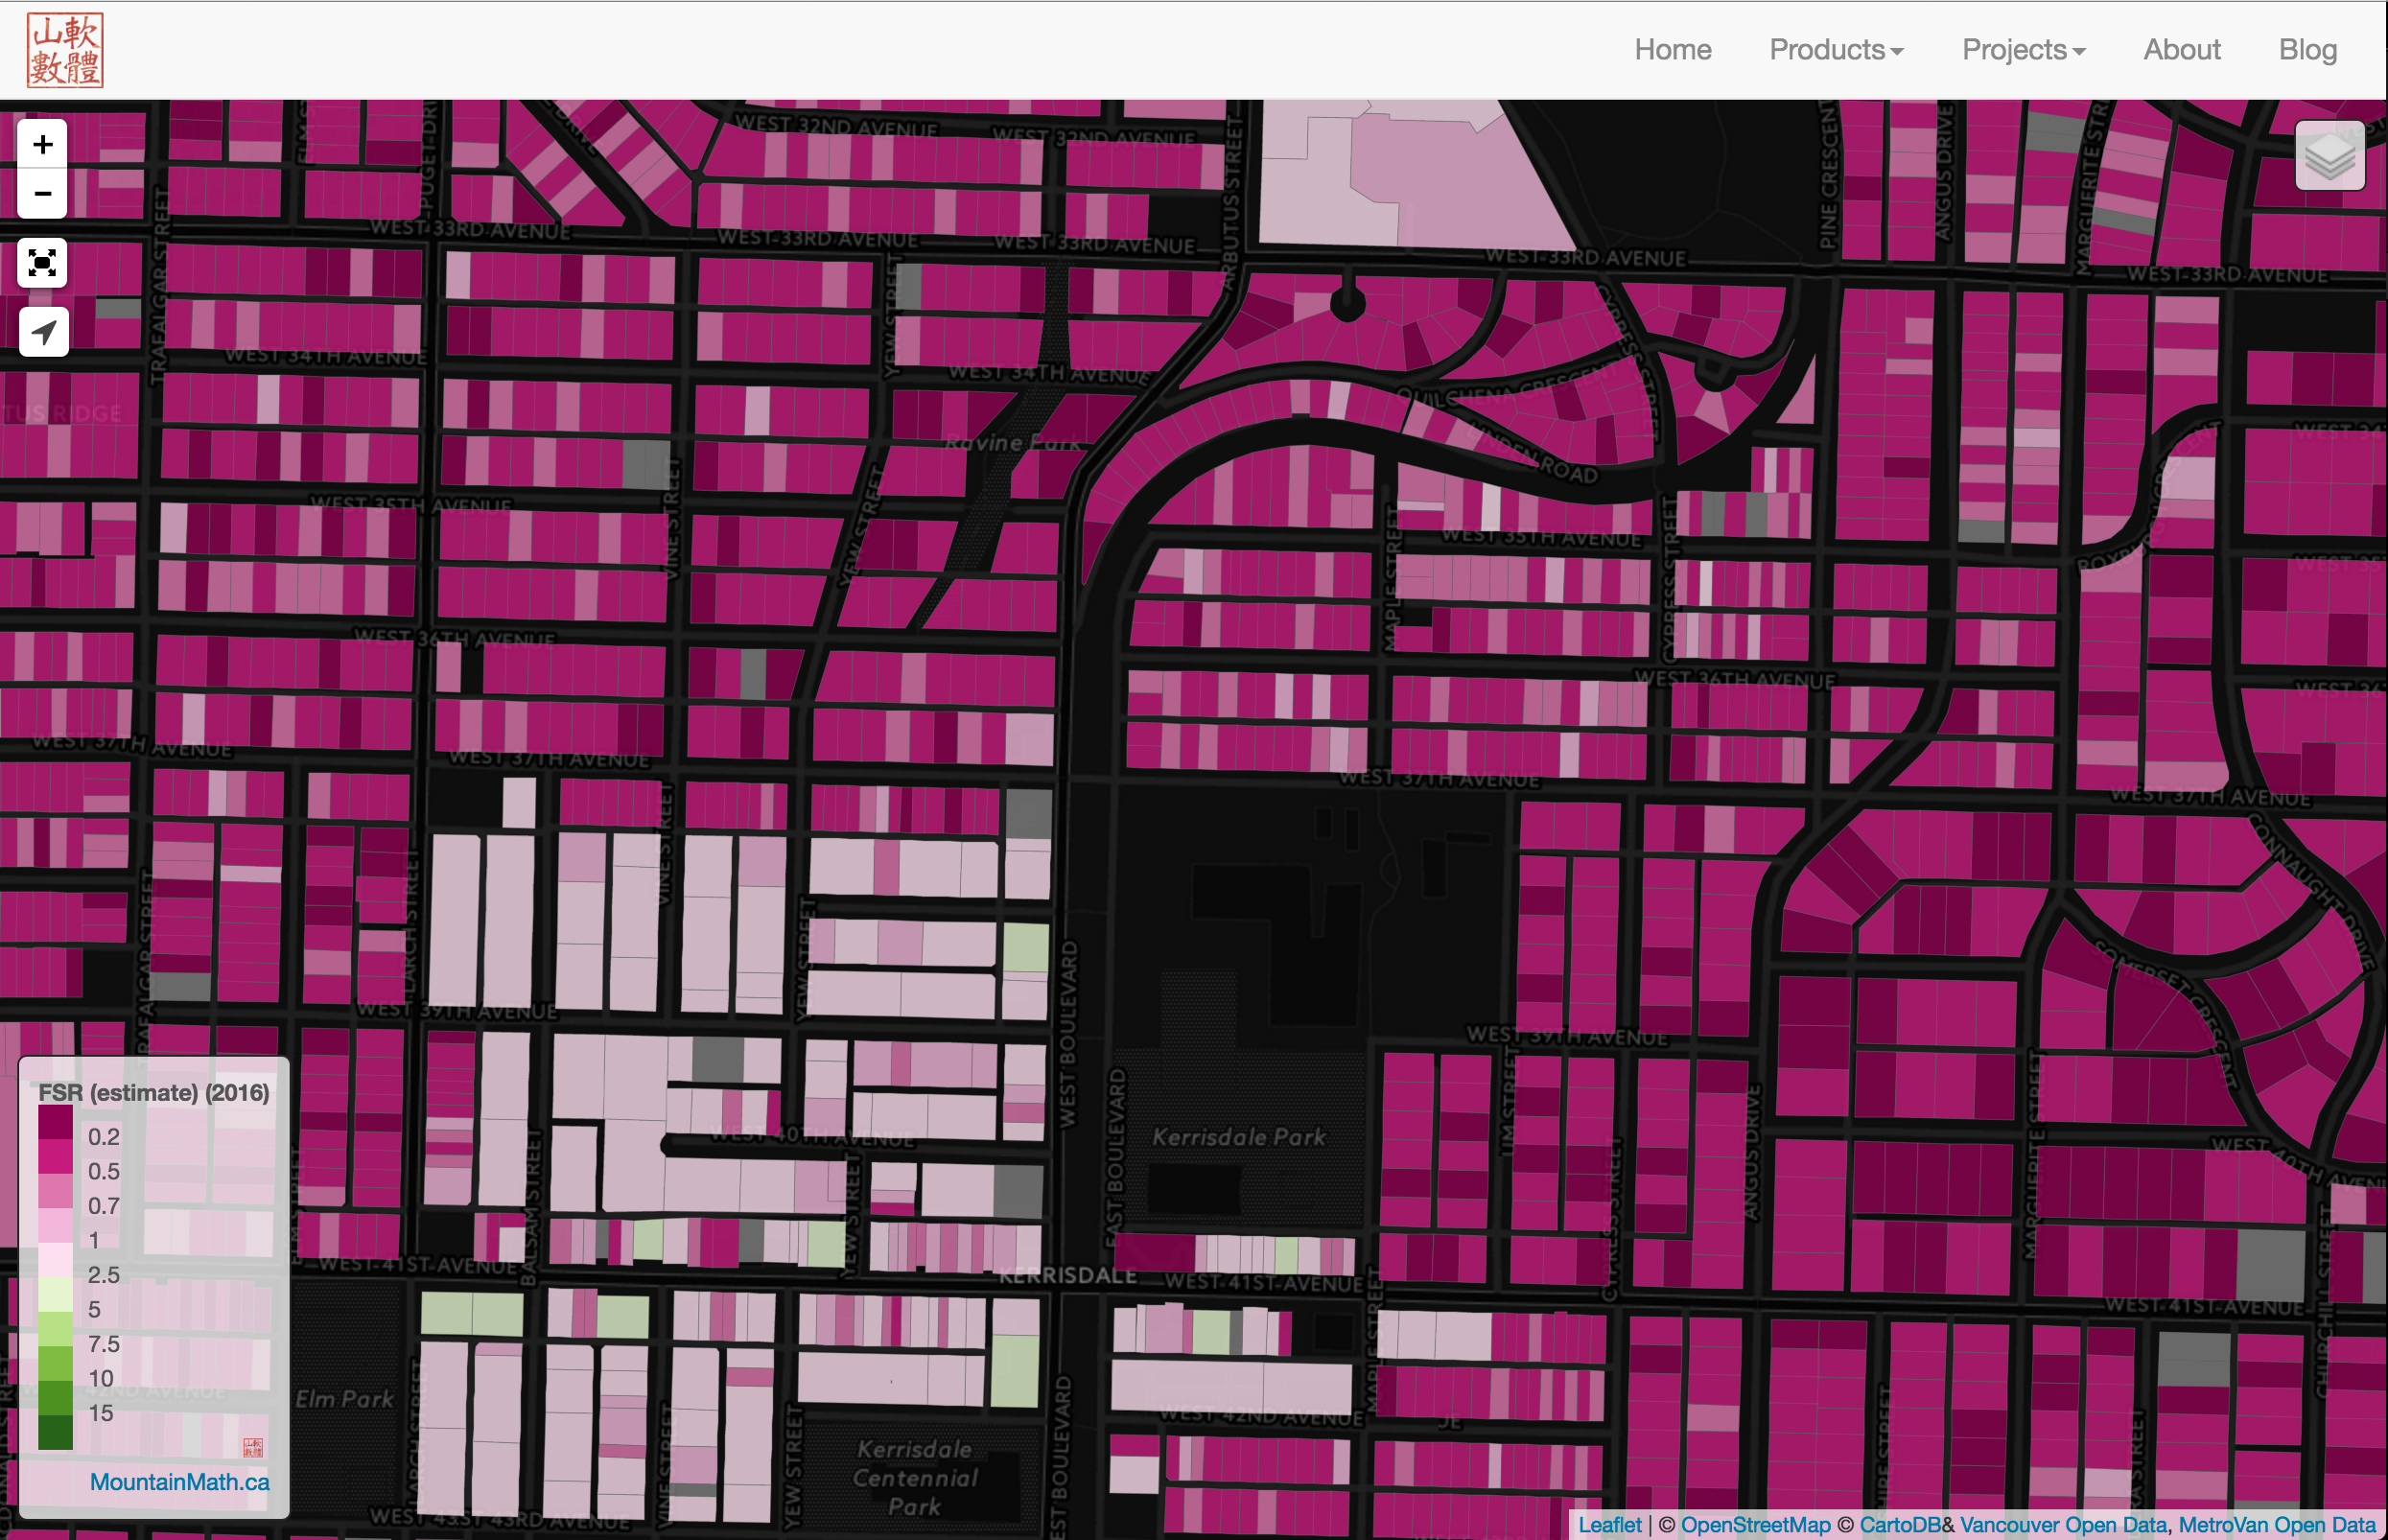 FSR is also often seen as such a measure of density, although it only focuses on density on property parcels and neglects all the space between parcels, like roads right of ways and parks.
In mostly residential neighbourhoods the two densities correspond quite closely, but in areas with large commercial buildings (nighttime) population density can be quite low while FSR is very high as can easily be seen by comparing the two maps.
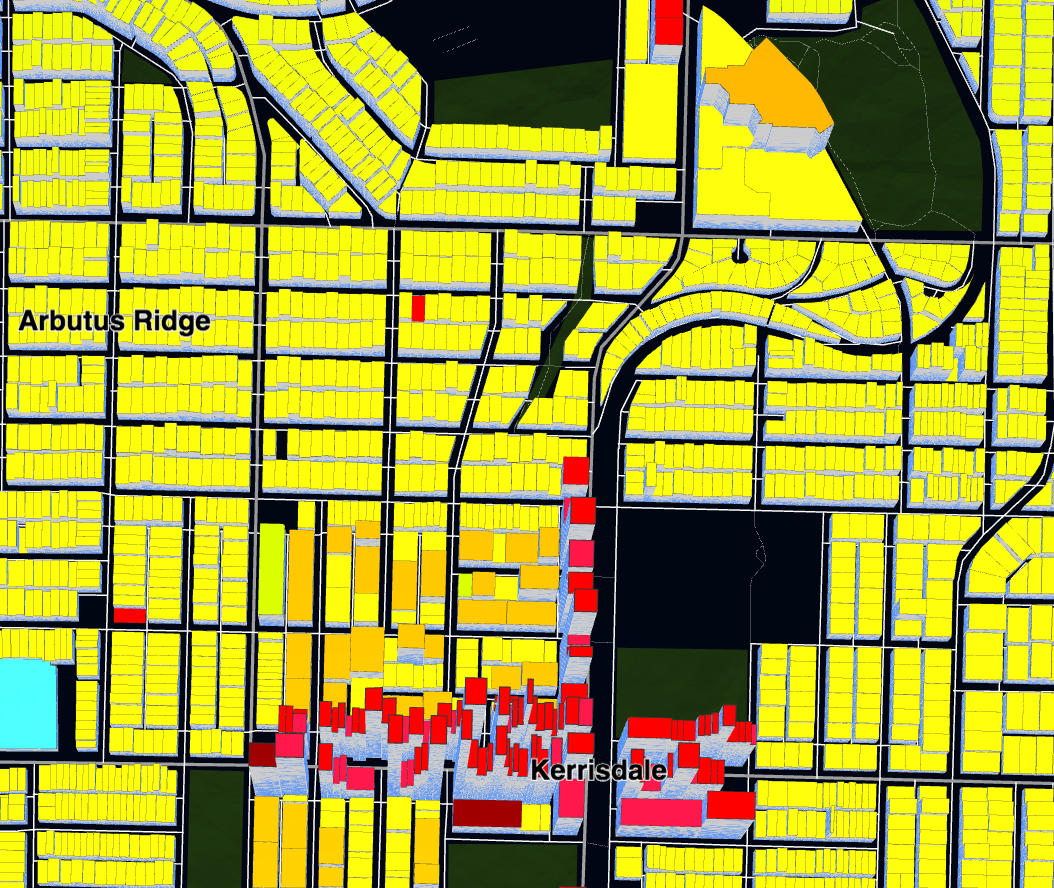 Tax density, that is property taxes collected per area, give another view of “density” in the city that highlights relative property values and emphasises commercial land use that pays five times the residential tax rate.
There are lots of other measures of density that are important for different purposes, for example household density (in full 3D, requires modern computer), the density of private dwelling units or toddler density just to name a few.
Next Steps
There are several directions I want to take this. Now that FSR is available for all properties, I can compare purpose built rental buildings to strata buildings. For example, in my Buildings and Dirt map I can’t integrate purpose built rentals because I don’t know how many rental units they have. The assessment data from the Vancouver Open Data portal, does not have that information, and BC Assessment won’t share it (in a hassle-free way). But I can make a similar map based on GFA instead of number of units and examine how GFA effect land and building values across different land uses. And in many ways GFA may be a better unit for comparisons than number of suites.
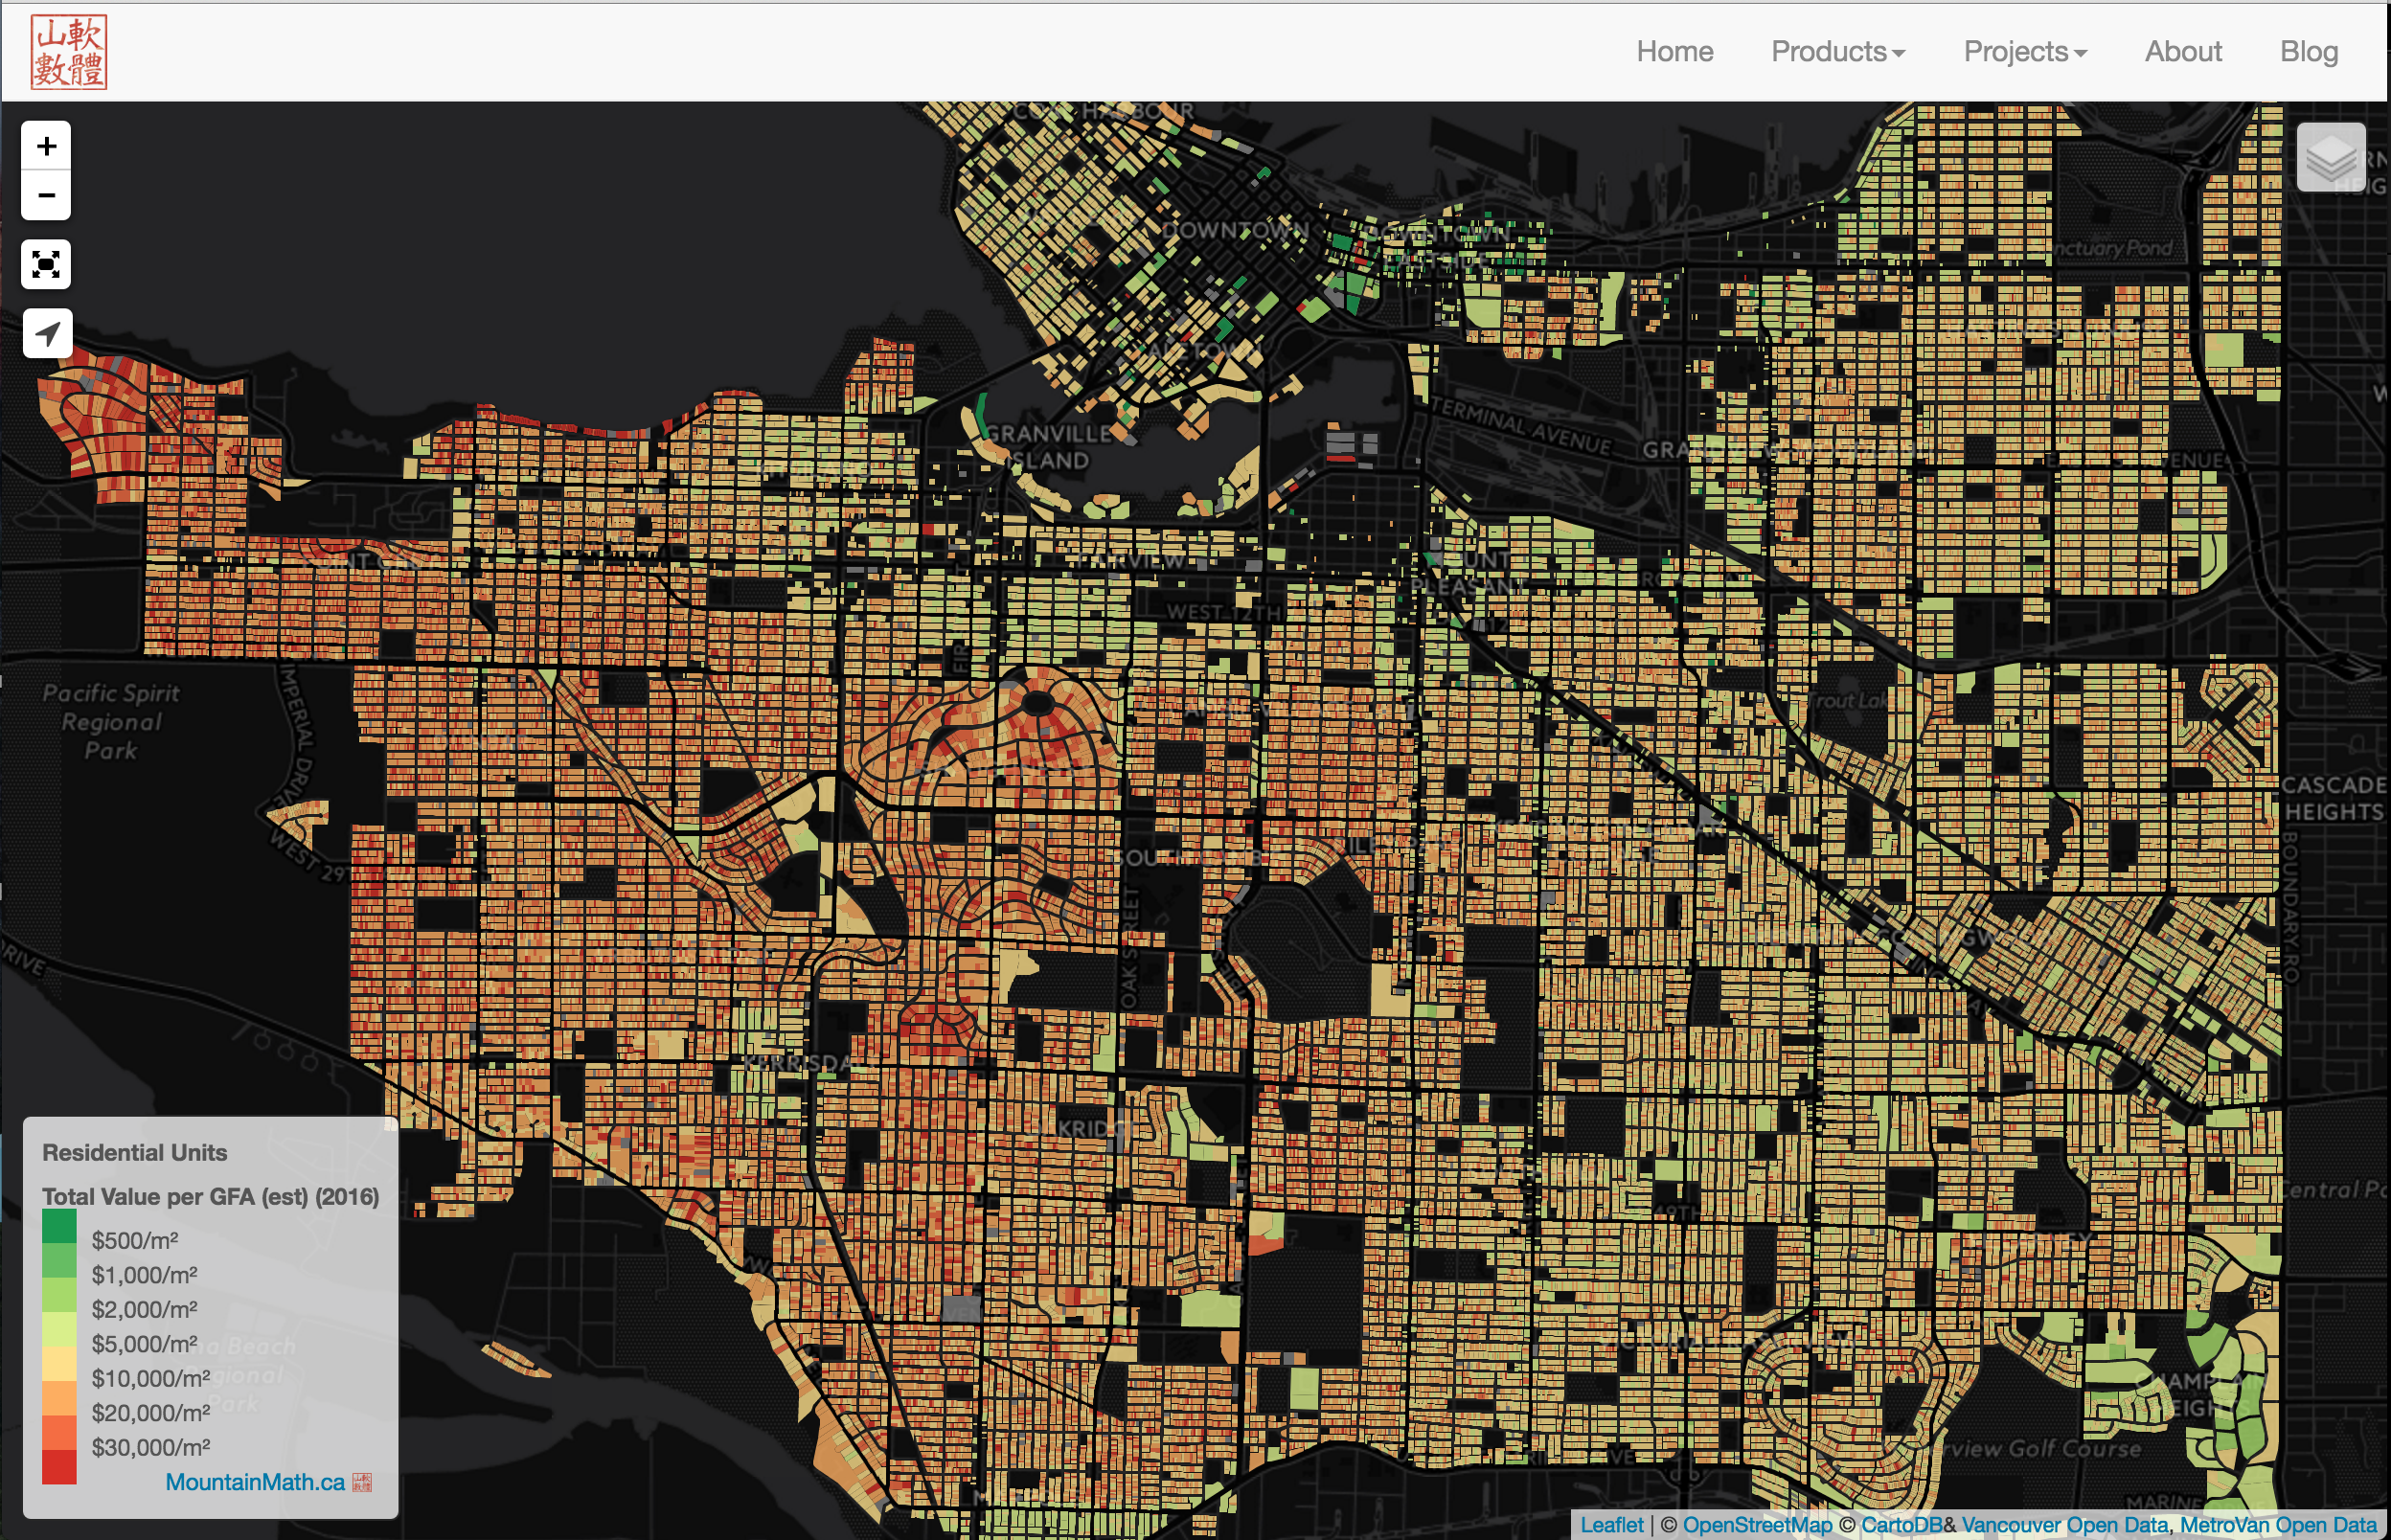 Or I can just make a straight-up map of total assessed value per GFA. And maybe add a filter to only show this for residential and mixed use units like in the image if that’s what we are interested in.
Another interesting application is to use this data to do something along the lines of this excellent analysis the New York Times published for Vancouver. FSR, next to building heights and lot coverage that I have already analysed from a different angle, is an important metric to detect buildings that could not be rebuilt under regular zoning.
Lastly, having data on building GFA, together with assessment open data, allows for reverse-engineering of the GFA of individual strata units. That makes the analysis of condo assessment data more meaningful as we can analyse assessed condo values by unit size. One of the reasons why we are only talking about single family homes (or in some cases RS zoned homes) and not condos is that it is very easy to compare single family homes. But comparing condos doesn’t make much sense unless one also has data on the size of each condo. And this has probably focused the public debate too much on single family homes when we should be paying a lot more attention to condos. And purpose built rental units.
Disclaimer
The FSR was estimated using coarse building data extracted from LIDAR data. The motivation was to use the FSR for aggregate analysis and not for getting accurate estimates of individual buildings.
Secondary buildings like garages or laneway houses are only inconsistently detected and mapped. The data is from 2009, buildings built after that are greyed out.
The algorithm to compute FSR from this building data is rather crude and only makes rudimentary attempts to adjust for varying floor heights of buildings different for land uses, overhangs and eyebrows and dealing with pitched roofs or mechanical units.
Building data was clipped to property polygons to deal with cases of buildings spanning several legal lots or not properly separated.
The FSR computed only roughly resembles the FSR defined in building codes. In particular our model with grossly overestimate the FSR for buildings with overhanging features like the Lookout on the Harbour Centre.
Block level aggregates will underestimate FSR in the presence of properties excluded from the FSR calculation.
Do not be use the FSR estimates as an authoritative source for any individual building FSR.
Reuse
Citation
@misc{density.2016,
  author = {{von Bergmann}, Jens},
  title = {FSR},
  date = {2016-05-20},
  url = {https://doodles.mountainmath.ca/posts/2016-05-20-density/},
  langid = {en}
}
