Census data is very rich and with CensusMapper we now have about 1 billion data points right at our fingertips. And we have managed to open up some of our interfaces for everyone to explore data and make their own maps and freely share them.
Things really get interesting when one mixes custom data with census data. While, at this point, these are not part of the freely available CensusMapper functionality we still wanted to share what can be done.
At CensusMapper we have developed three basic ways to rapidly mix custom data with census data. So this is really three blog posts in one.
1. Overlay Mapping
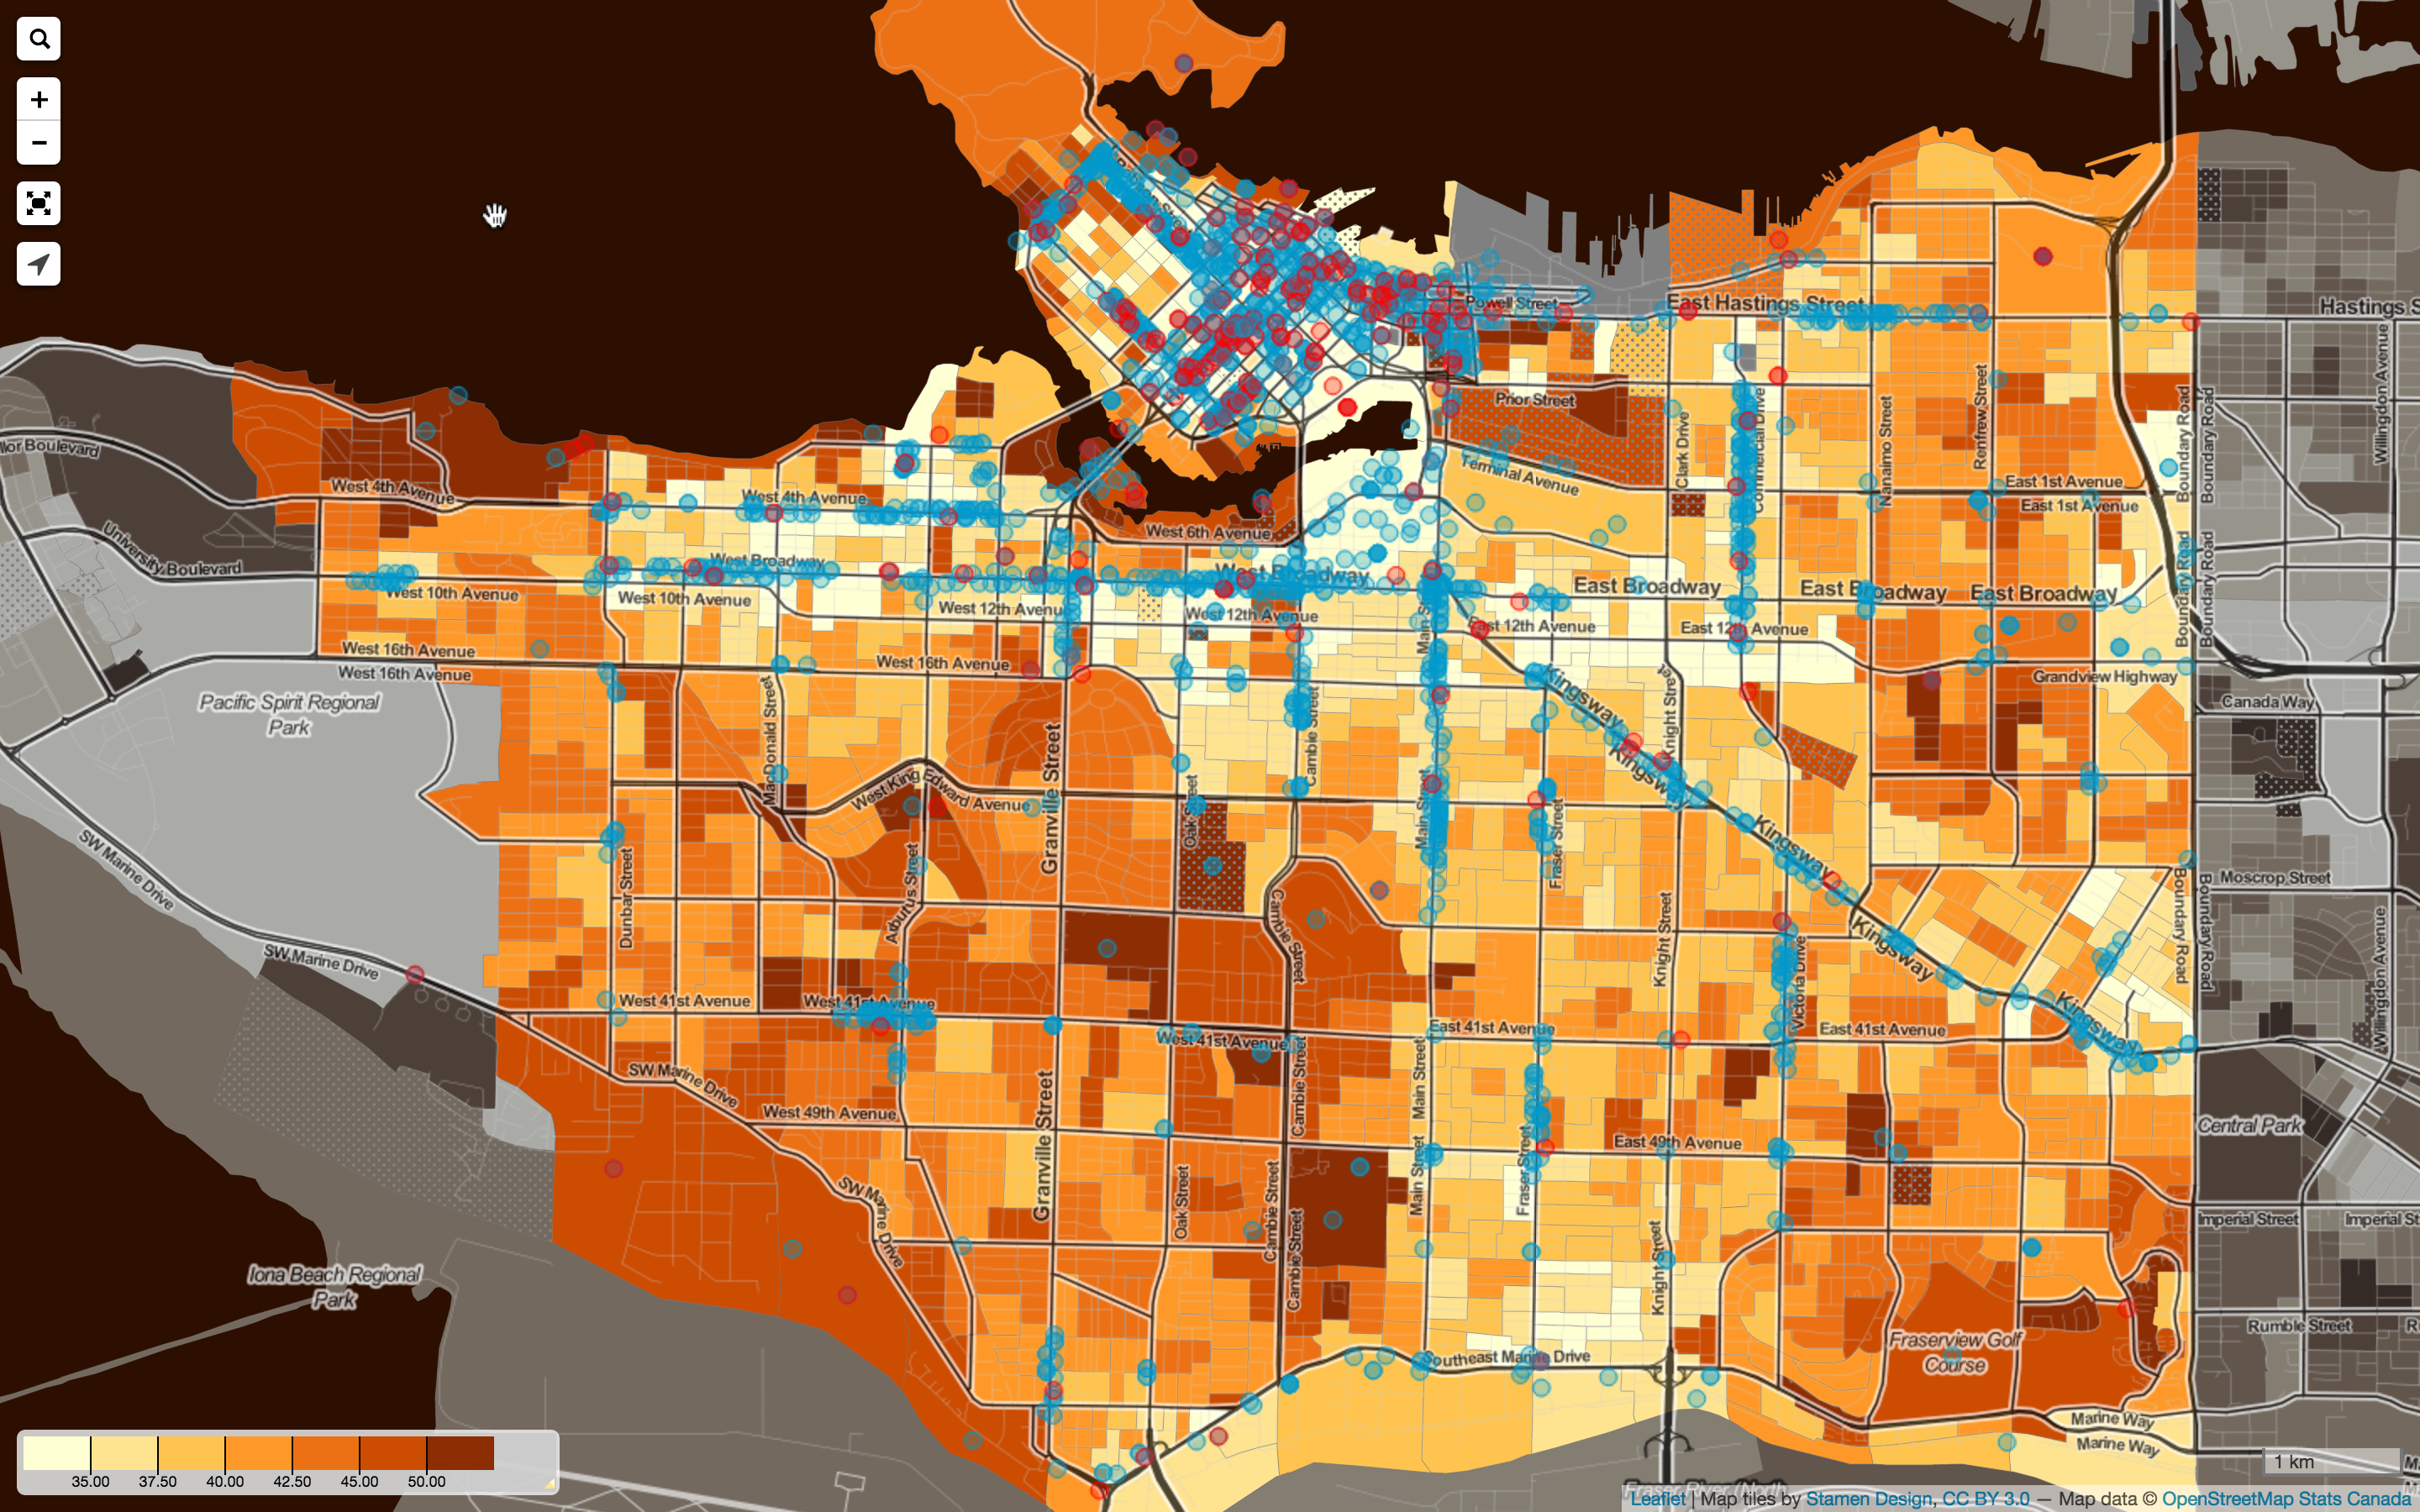
First up, advanced users can upload custom datasets and map them on top of census data.  For example, we took a business license dataset from the City of Vancouver open data catalogue, filtered it by the BusinessType field to only include businesses starting with “Restaurant” or “Liquor Establishment” and uploaded them to CensusMapper to map it on top of census data. We have used a map for median age that was recently created using CensusMapper’s free public interface (have you made your own CensusMapper map yet?), we have faded out areas outside of Vancouver and coloured Liquor Establishments in red and Restaurants in blue.
Giving a visual impression of your own dataset in relation to census data is the first step to location analysis.
2. Populate Custom Data with Census Data
Next up is to populate your own dataset with census data for further analysis. For the restaurants, we may be interested in attaching population estimates in 5 minute walking distance from each location. We might also be interested in specific age brackets, or numbers of recent immigrants from specific countries that we may want to target with a new restaurant, or maybe even income data.
This can be a time consuming and painful process, but we have automated this at CensusMapper.
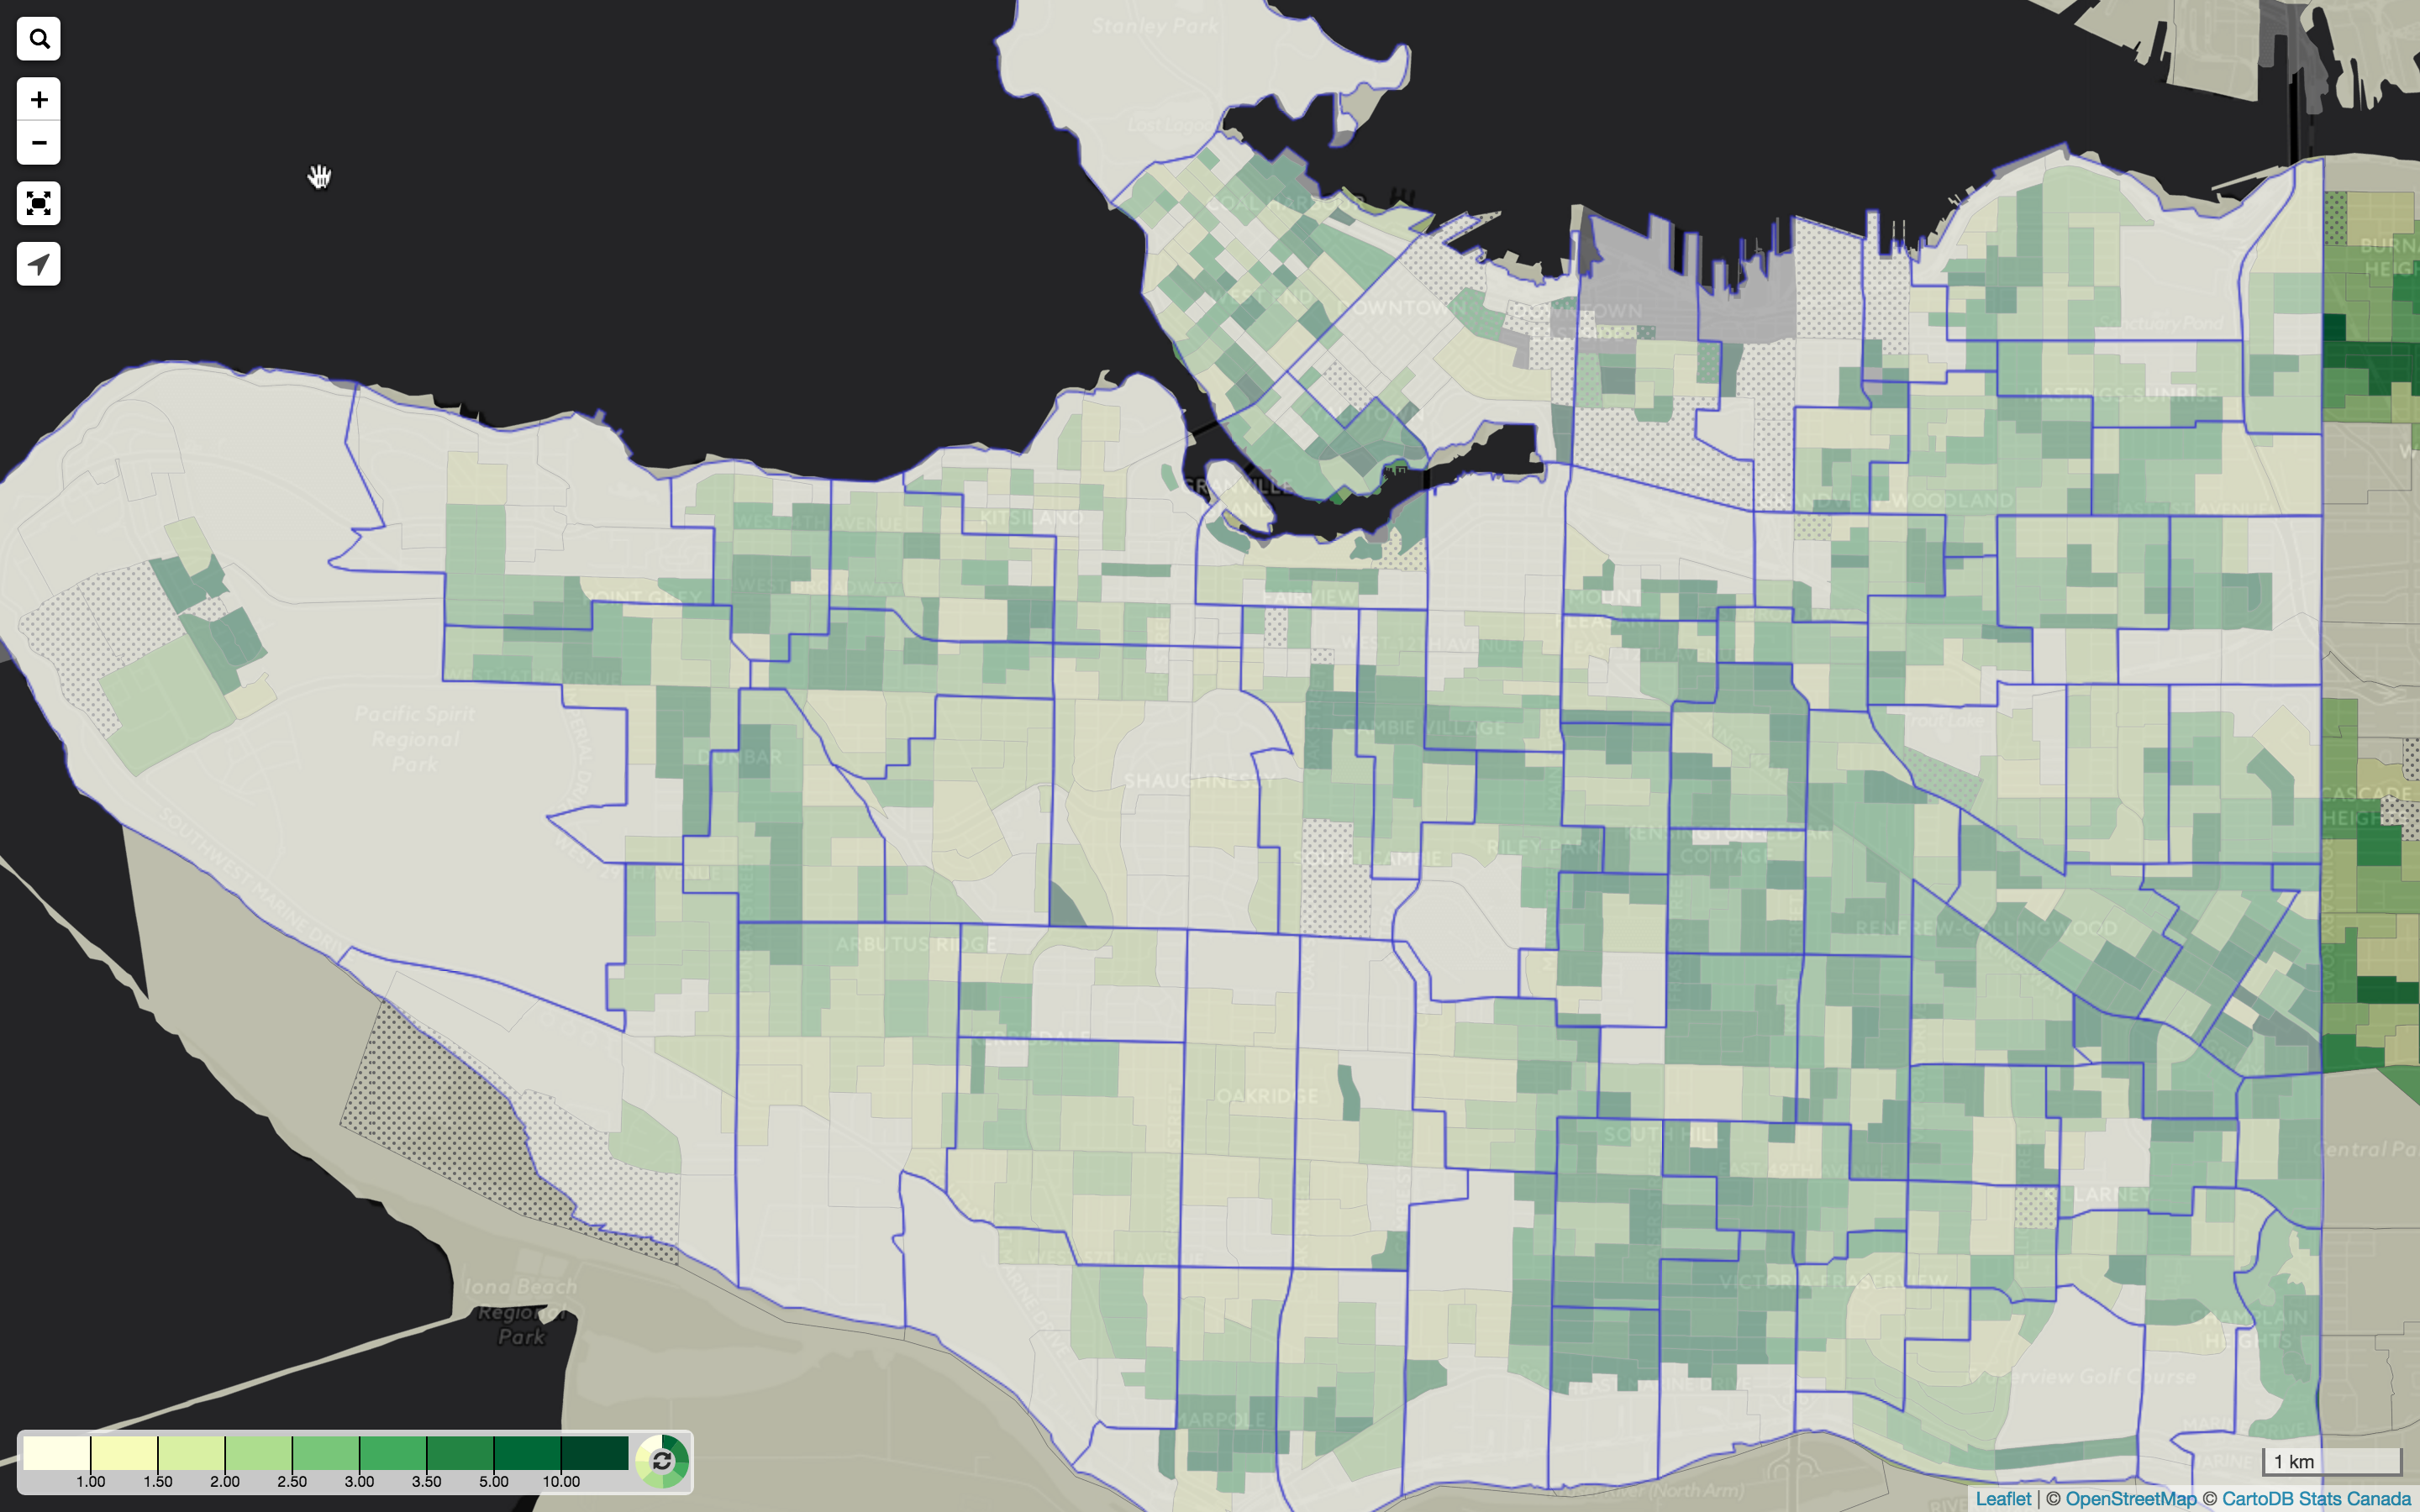
To showcase how this works we will show an example using elementary school catchment areas in the City of Vancouver. The areas we have (from the Vancouver Open Data Catalogue) are quite out of date, but for the purpose of this example they work as we will compare them to 2011 census data. We will look at the school aged population in each catchment.
 Using the visual overlay we notice that the catchment areas do fit boundaries of Dissemination Areas shown on the map reasonably well, with some exceptions. The same cannot be said for Census Tracts, we can be reasonably confident that Dissemination Area data is fairly accurate.
Next we use the built-in CensusMapper functionality to automatically populate the catchment areas with the census data we are interested in. When Dissemination Areas don’t line up with the catchment boundaries we go down to Dissemination Blocks to estimate how many children live on what side of the catchment boundary. We previously explained this process in more detail, the result is a spreadsheet with the population data by age for each catchment area.
Here we show the results by school, the select element can be used to select any school of interest. The whole process of populating the school data with census data just required uploading the catchment boundaries and selecting which variables to attach.
3. Custom Census Data Mapping
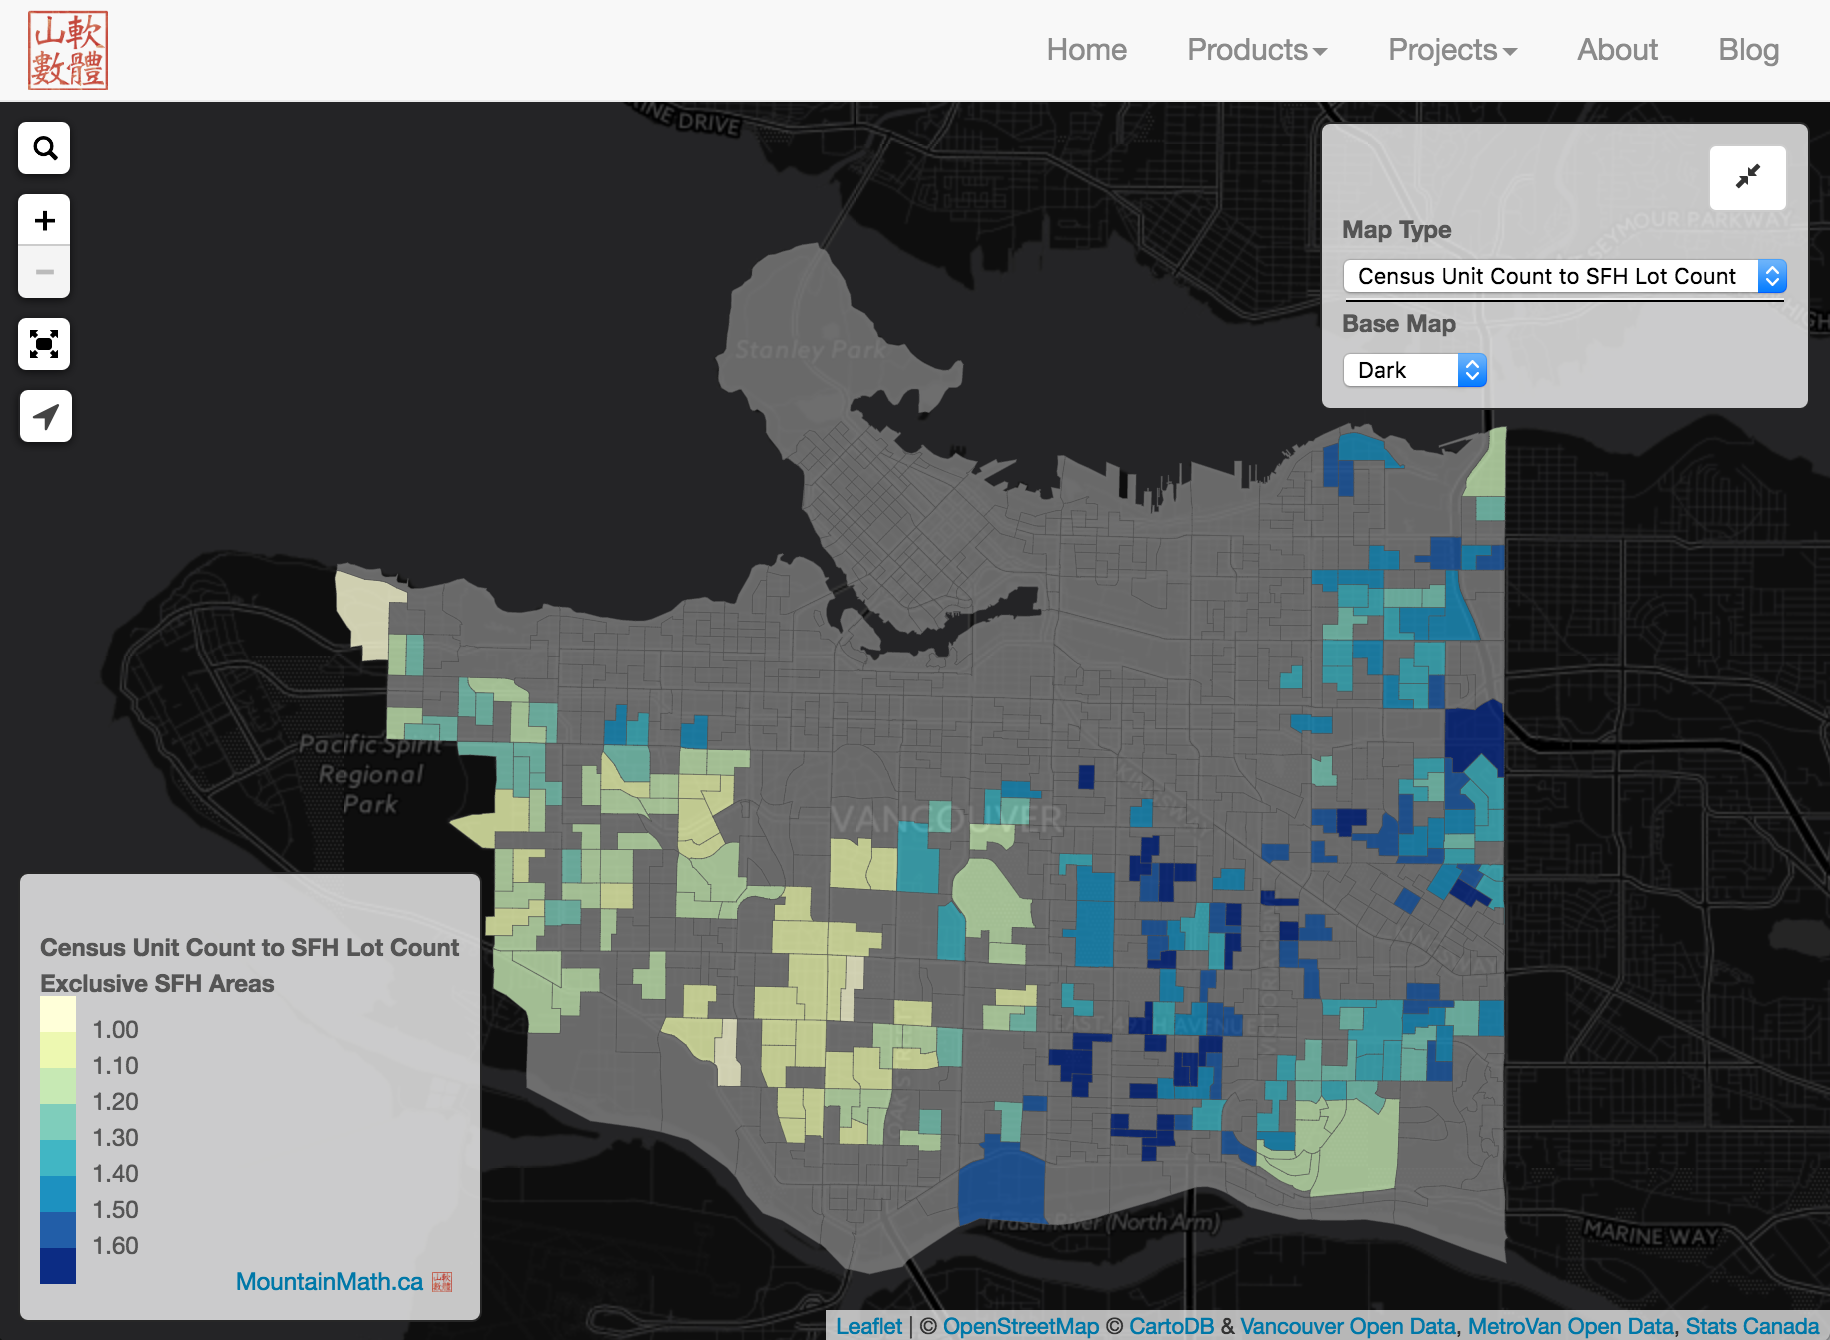
Sometimes it is not practical to map custom data on CensusMapper. Maybe the custom data is too sensitive to be uploaded to CensusMapper servers. Or it is quite complex and is better mapped separately. So we created an API to pull in census data from CensusMapper to easily show census data on custom maps. And dynamically mix in your own data. As an example we mix census data with data from BCAssessment, again obtained through the Vancouver Open Data Catalogue (and enriched with open data from Metro Vancouver). For demonstration purposes take Dissemination Area geographies and Dwelling Characteristic data from CensusMapper and mash it up with our processed assessment data to explore the differences in how single family properties are classified.
 For example we can compare BC Assessment single family lot count to Stats Canada unit count in the dissemination areas that are exclusively made up of single family lots. This gives an indication of how many suites and laneway houses there are in those areas. The census is prone to undercount units, but still does a better job at estimating them than other data sources, like the city or BC Assessment.
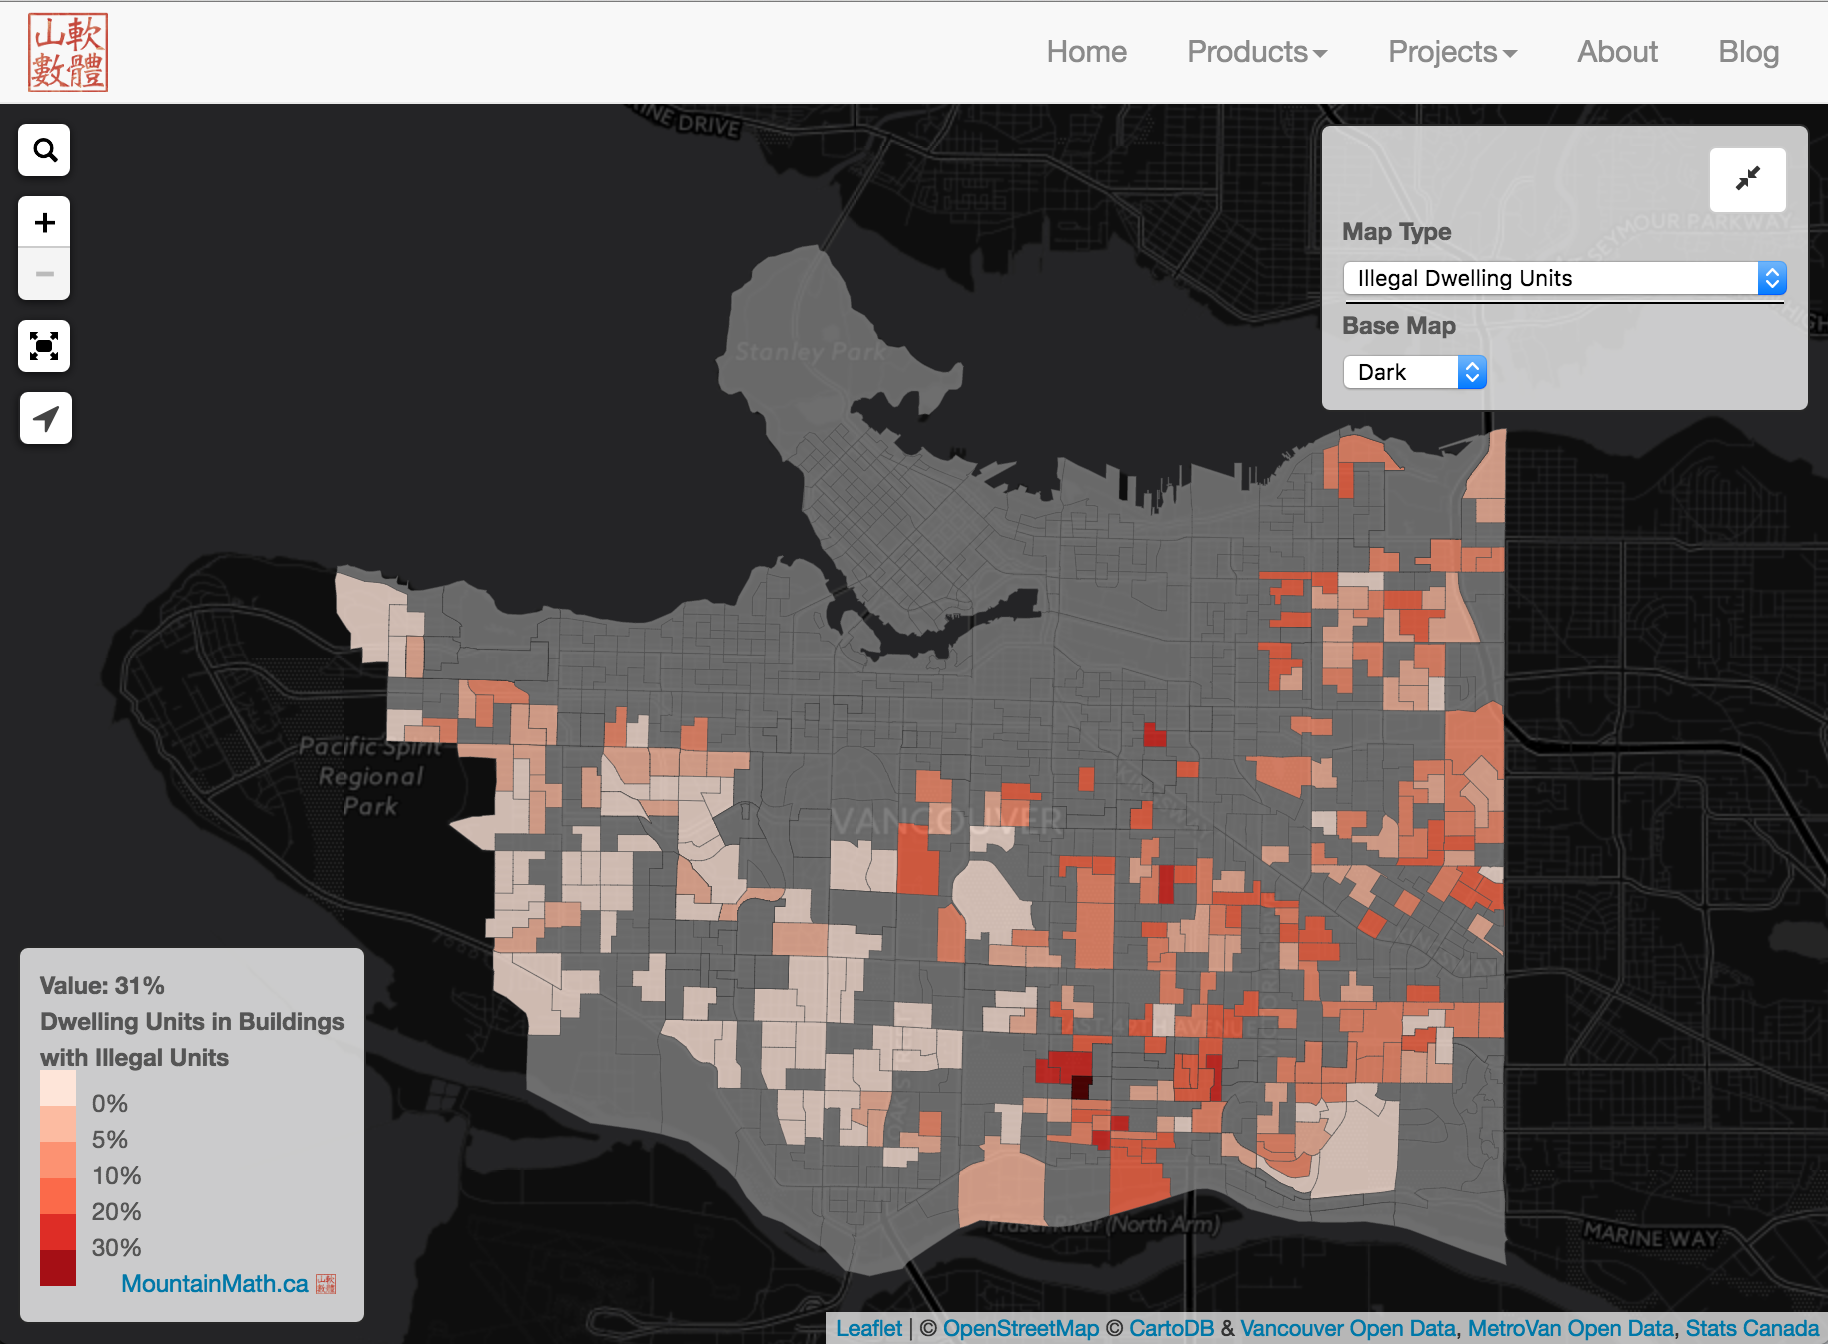
One of the reasons why census unit counts come up higher than other methods is that the census also counts illegal units, which naturally are not part of other official government counts. There are different reasons why a suite may be illegal:  It could simply be that the owner has not made the effort to register it. Or the suite may not be up to code. And in some cases, a property may have more than one suite in the main building, which is illegal in the City of Vancouver. The latter ones we can pick out in census data, since a house with two secondary suites – so three dwelling units in one building in total – is classified as being an “Apartment, building that has fewer than five storeys”. So, in census dissemination areas that only have duplex or single family lots as residential land uses based on assessment and land use data, we can look for how many dwelling units the census places in an “Apartment, building that has fewer than five storeys”. And map them.
Reuse
Citation
@misc{mixing-data.2016,
  author = {{von Bergmann}, Jens},
  title = {Mixing {Data}},
  date = {2016-07-06},
  url = {https://doodles.mountainmath.ca/posts/2016-07-06-mixing-data/},
  langid = {en}
}
