RT is Vancouver’s zoning for duplexes. Over time, various areas have been zoned to allow duplexes. Examples are Kits Point, much of Point Grey Road reaching up to Broadway, much of Granview-Woodlands, parts of Mount Pleasant and many other areas.
Recently I have had some interesting conversations on Twitter regarding RM-6 and over BBQ dinner about RT-7. Then the Granview-Woodland plan passed by council, and it contains a curious provision of reducing the outright FSR for the RT-zoned properties from 0.6 to 0.5.
All of which got me thinking. What is RT supposed to accomplish, how does the diverse RT-zoning rules influence development and how is RT overall performing?
To make things complicated many RT zoning rules contain provisions to allow for higher FSR, and more than two units, under the “heritage preservation” program. Most people like the multi-plex developments that come out of this process, but the road there is quite adurous. Permitting takes a long time and is marred by uncertainty. Those projects are done by small developers, that are ill-equipped to deal with risky and drawn-out rezoning processes.
These would be great projects carried out by small developers that lead to gentle and affordable density, as this kind of re-development does not require land-assembly and does not lead to crazy land-value lifts that require CACs to claw back some of that value rise as we explained before.
We have some ideas what a refreshed RT (and RS) should look like, and there are some efforts to push for changes. We leave the details of this to the experts and take a little field expedition to see how the different flavours of RT (and RM) perform in data.
Why RT?
One central question to ask is: What is the purpose of RT (or any) zoning? The initial idea was to allow higher density than RS, with two stratified properties on one lot. But since the creation of RT the RS zoning has undergone significant changes and allows, in many cases, for higher FSR and higher unit count, although not stratified. In much of RS three units are allowed on each lot, the main house, a secondary suite and a laneway house.
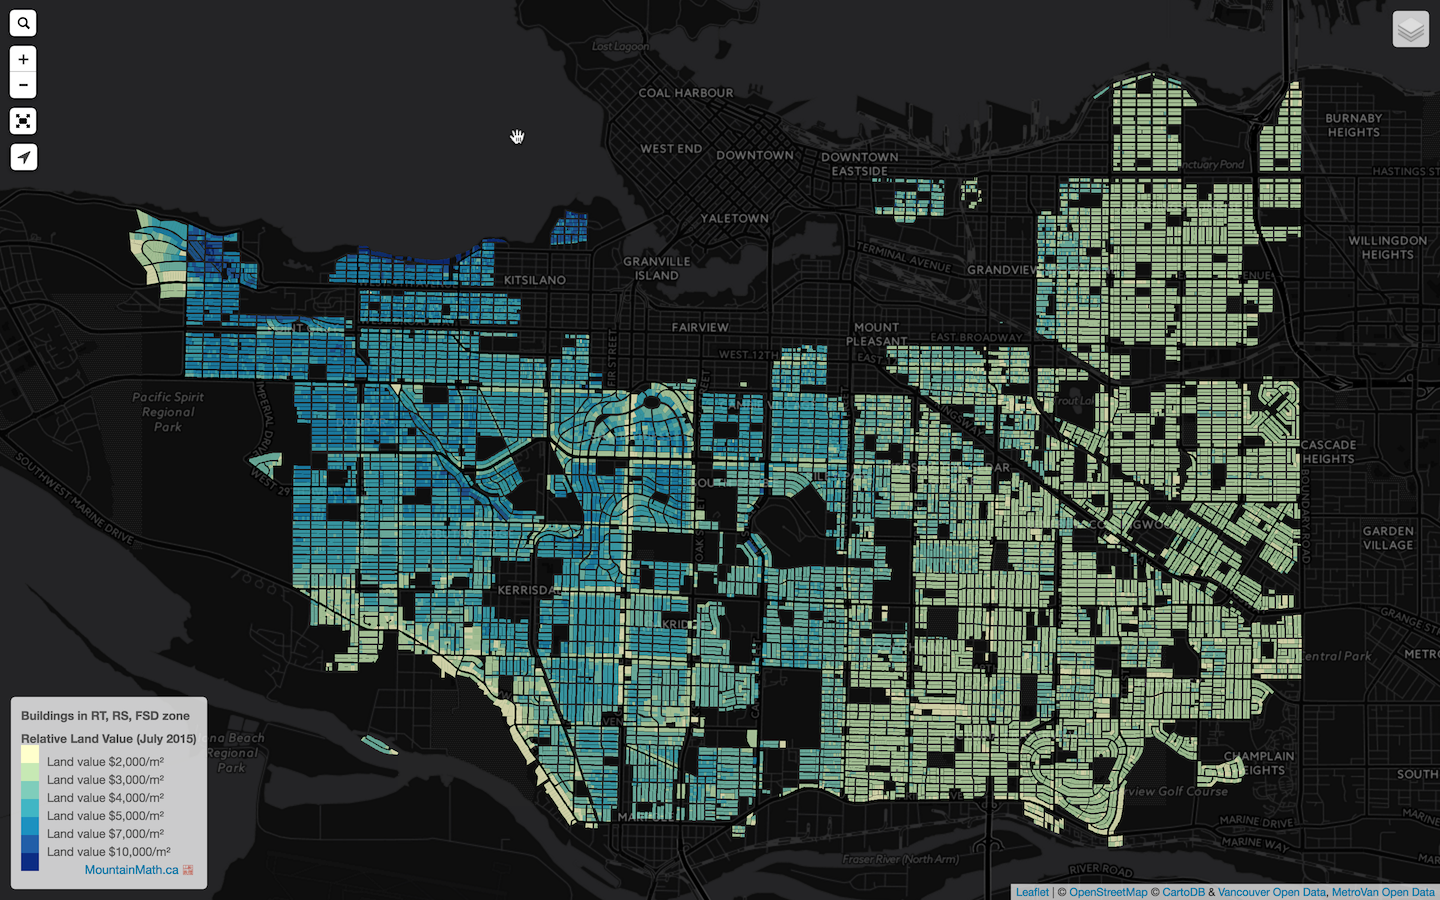 So how does RT perform in the wild? There seems to be little effect RT vs RS zoning has on land values. The boundaries between RS and RT can’t be discerned from a land value map of all residential properties in RS, RT (and First Shaugnessey) zones.
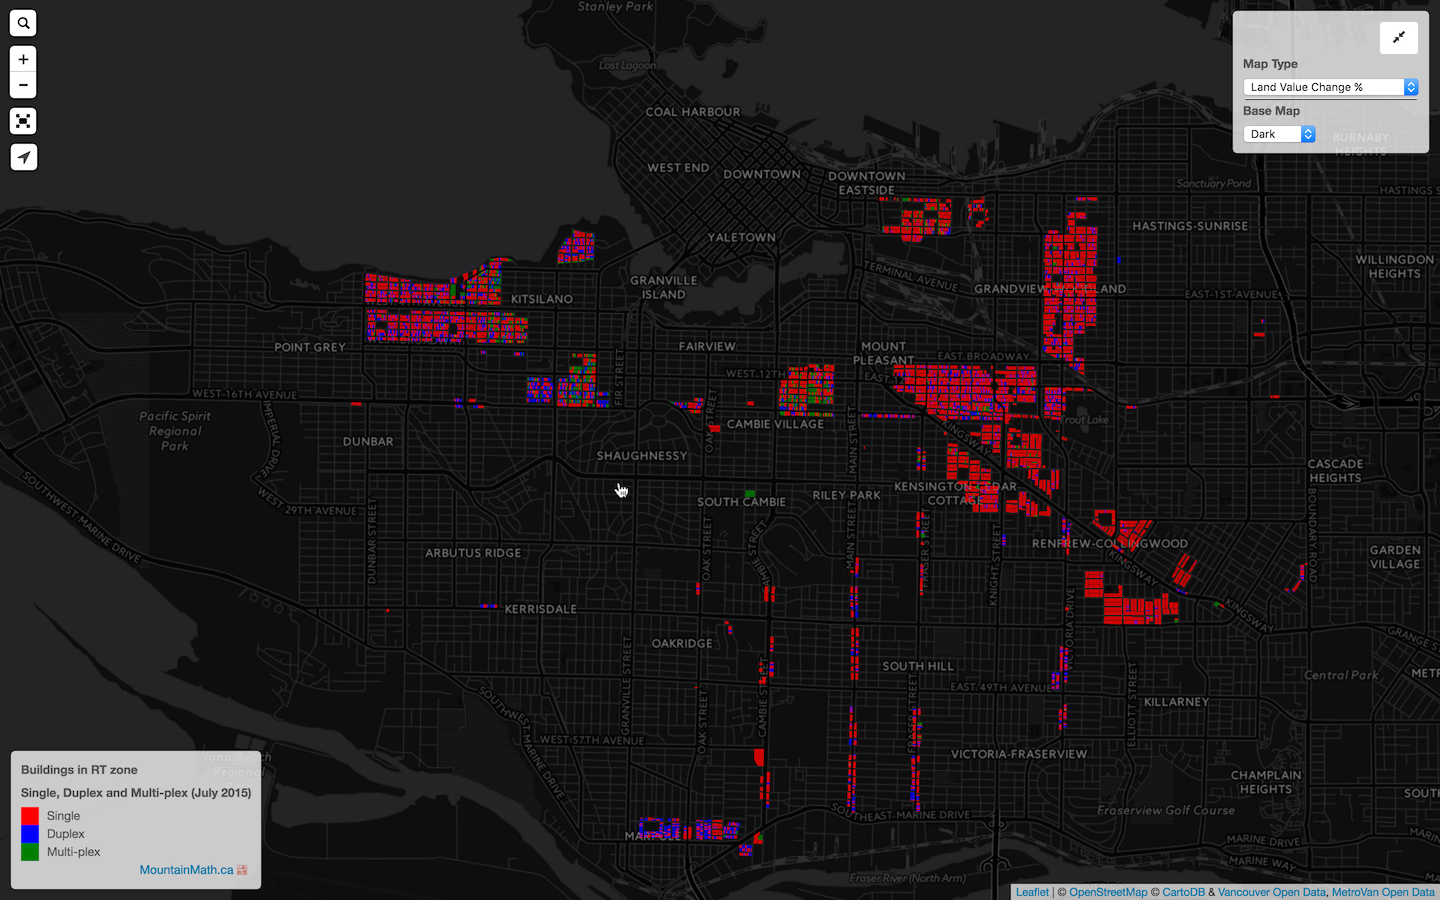 We can also study this by mapping out all residential lots in RT zones, and color them depending if they are single family lots, duplexes or multi-plexes.
Some RT areas are essentially indistinguishable from RS areas, they are almost entirely comprised of single family lots. A good example is the RT-4, most of which is in Grandview-Woodlands. And being in RT rathern than RS they often don’t even get the benefits of a laneway house. Coach houses, which are legal in many RT areas and could be stratified, come with such onerous side setbacks that they are very hard to build on regular lots.
There is a lot of untapped “zoned capacity”. Similarly, some of the newer RM zones show little appetite for realizing “zoned capacity”, possibly due to the added difficulty of having to assemble lots to do so.
One can argue about whether this is good or bad. Or one can look at the variation between the different types of RT and RM zones to see what causes the difference.
Downzoning
To understand how downzoning works we want to consider two different types on analysis. One is to look at what happened after RS zone was changed to reduce site coverage in the 1980 in response to concerns about ‘monster homes’. We ran an analysis using LIDAR data to understand the effect on the physical form of SFH and found that while site coverage indeed decreased sharply, the bulk of the building remained unchanged. and the rule change seems to have done little in easing concerns about ‘monster homes’, it simply changed some of the parameters determining what ‘monster homes’ look like.
Another way to look at the matter is to compare how re-development happened in difference zones. This is very hard, since there are many factors other than zoning that determine if a building gets re-developed. To get some idea we compiled two numbers for each of the RS, RT and RM zones (ignoring some of the delicacies in the zoning code and lumping together all sub-zones with the same leading number. So for example we lumped RT-4, RT-4A, RT-4N and RT-4AN into one category we simply label “RT-4”.
First we check how many residential properties got re-developed since 2000.While there is some correspondence between re-development activity and ratio of teardowns, there are a number of notable exceptions. RT-1 and RM-9 stand out, but these are oddball cases with just a few properties.
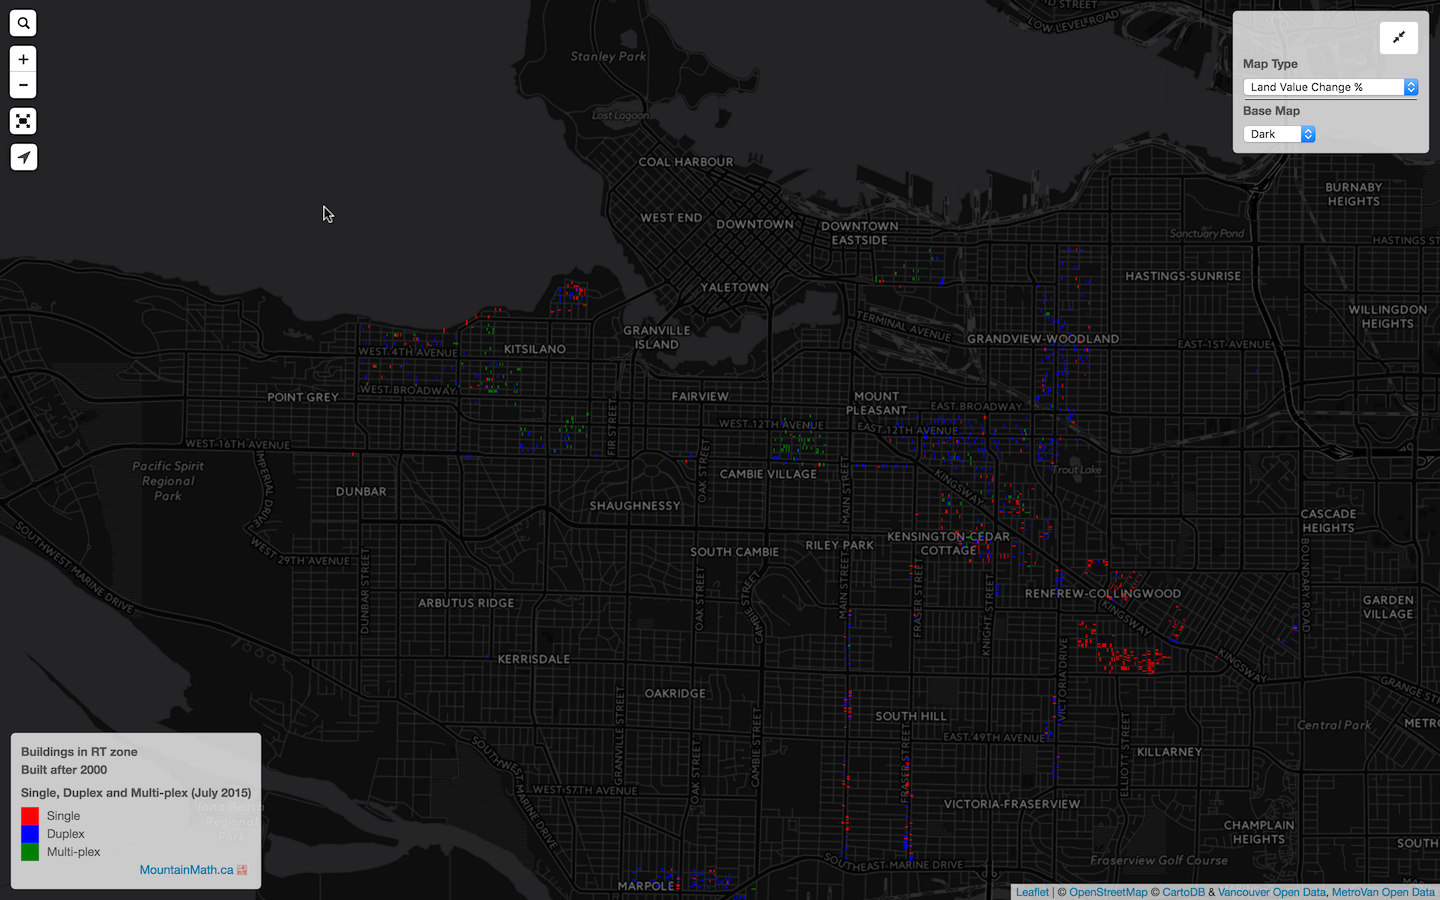 We can also map just residential properties in RT that were re-developed since 2000 and colour them by SFH, Duplex and Multi-plex status. We can clearly see how some RT areas, like RT-7, don’t see much re-development, others, like RT-6 see mostly multi-plexes being developed. Some zones, like RT-10, 11, 12 are too new to be judged on development happening since 2000. For example, zooming in on developments in RT-10 since 2009 paints a very different picture.
There is lots of stuff to explore, but for today I want to look at RT-7 and RT-6 in more detail.
RT-7
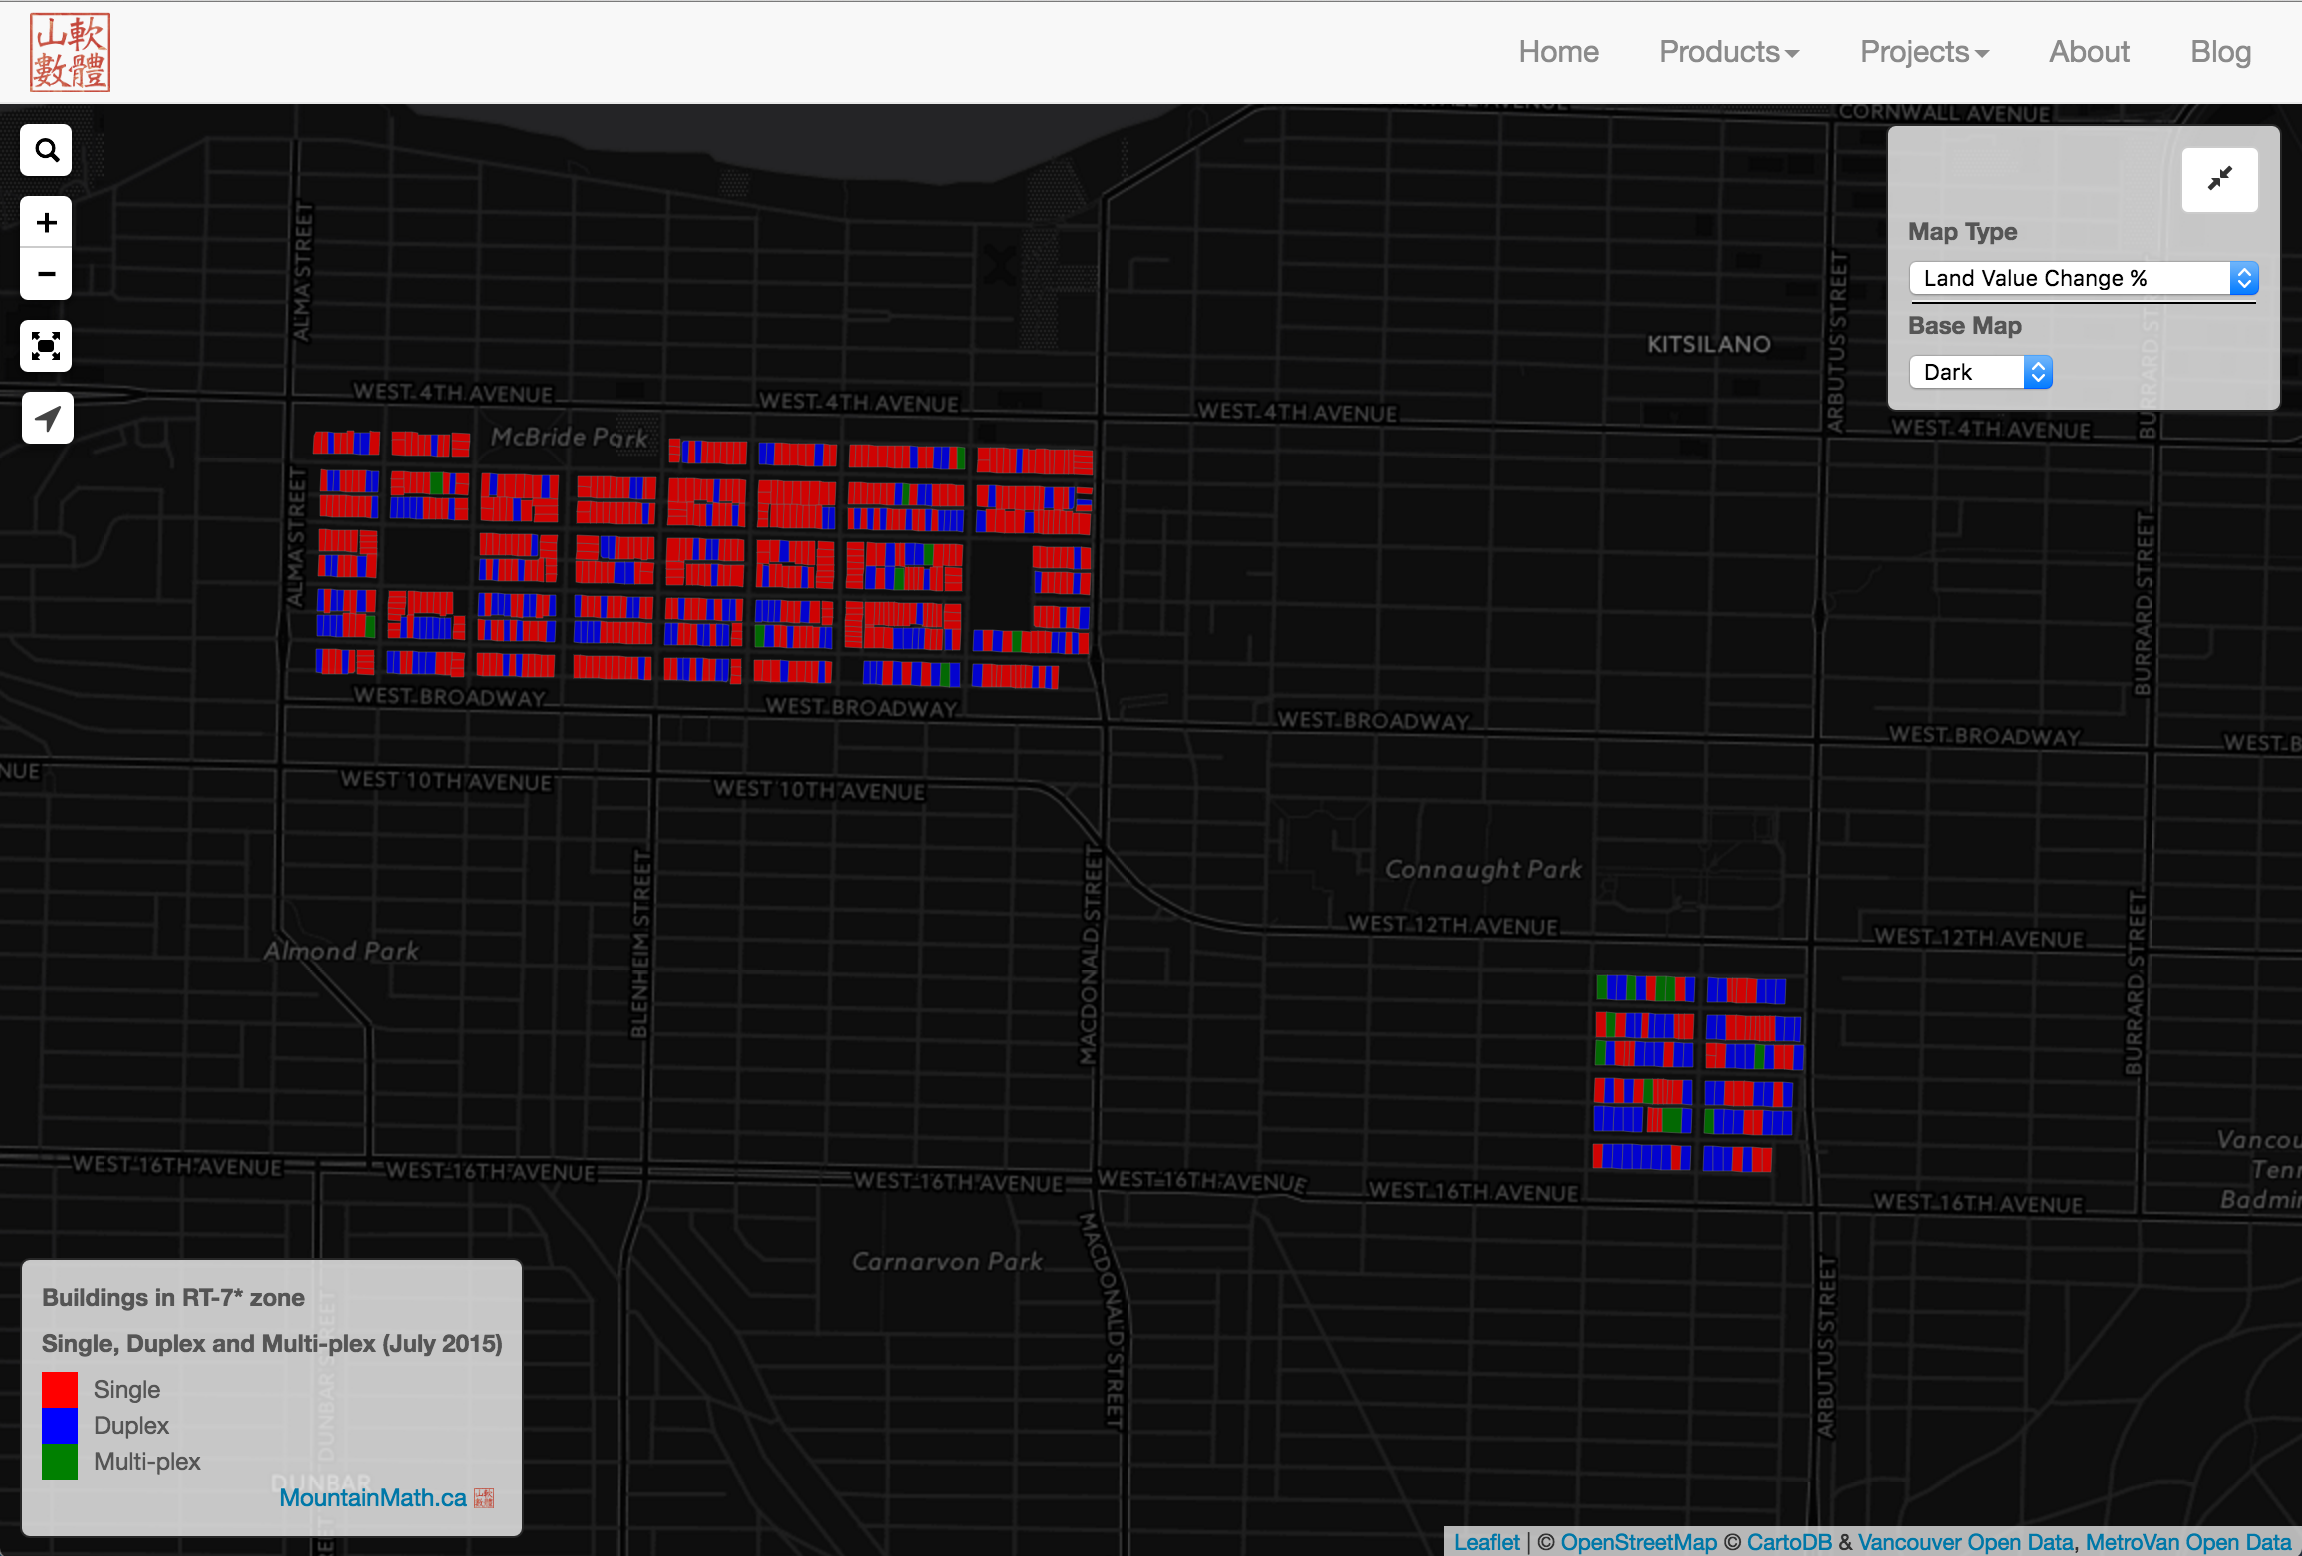 A much more interesting case is RT-7, with 35% of properties teardowns but only 4.1% of properties re-developed since 2000. Looking at the map we see that RT-7 is comprised of two pockets on the west side, and the teardown candidates stand out in red and orange. Filtering further to see what has been re-developed since 2000 we see that, considering the size of the two pockets, re-development favours the eastern pocket near 16th and Arbutus. We can clearly see that that the eastern pocket has an overall more valuable building stock, although it is not clear if that is due to higher rates of re-development or for other reasons, for example the presence of some slightly larger lots. We also note that re-development does produce duplex units and even some multi-plex.
So what is going on here? Looking at the RT-7 zoning we see that the area has been downzoned to 0.4 FSR as was rencently pointed out to me, which can conditionally be upzoned to 0.6 FSR. Additionally, there are caps on the number of units per hectar to further restrict density.
RT-6
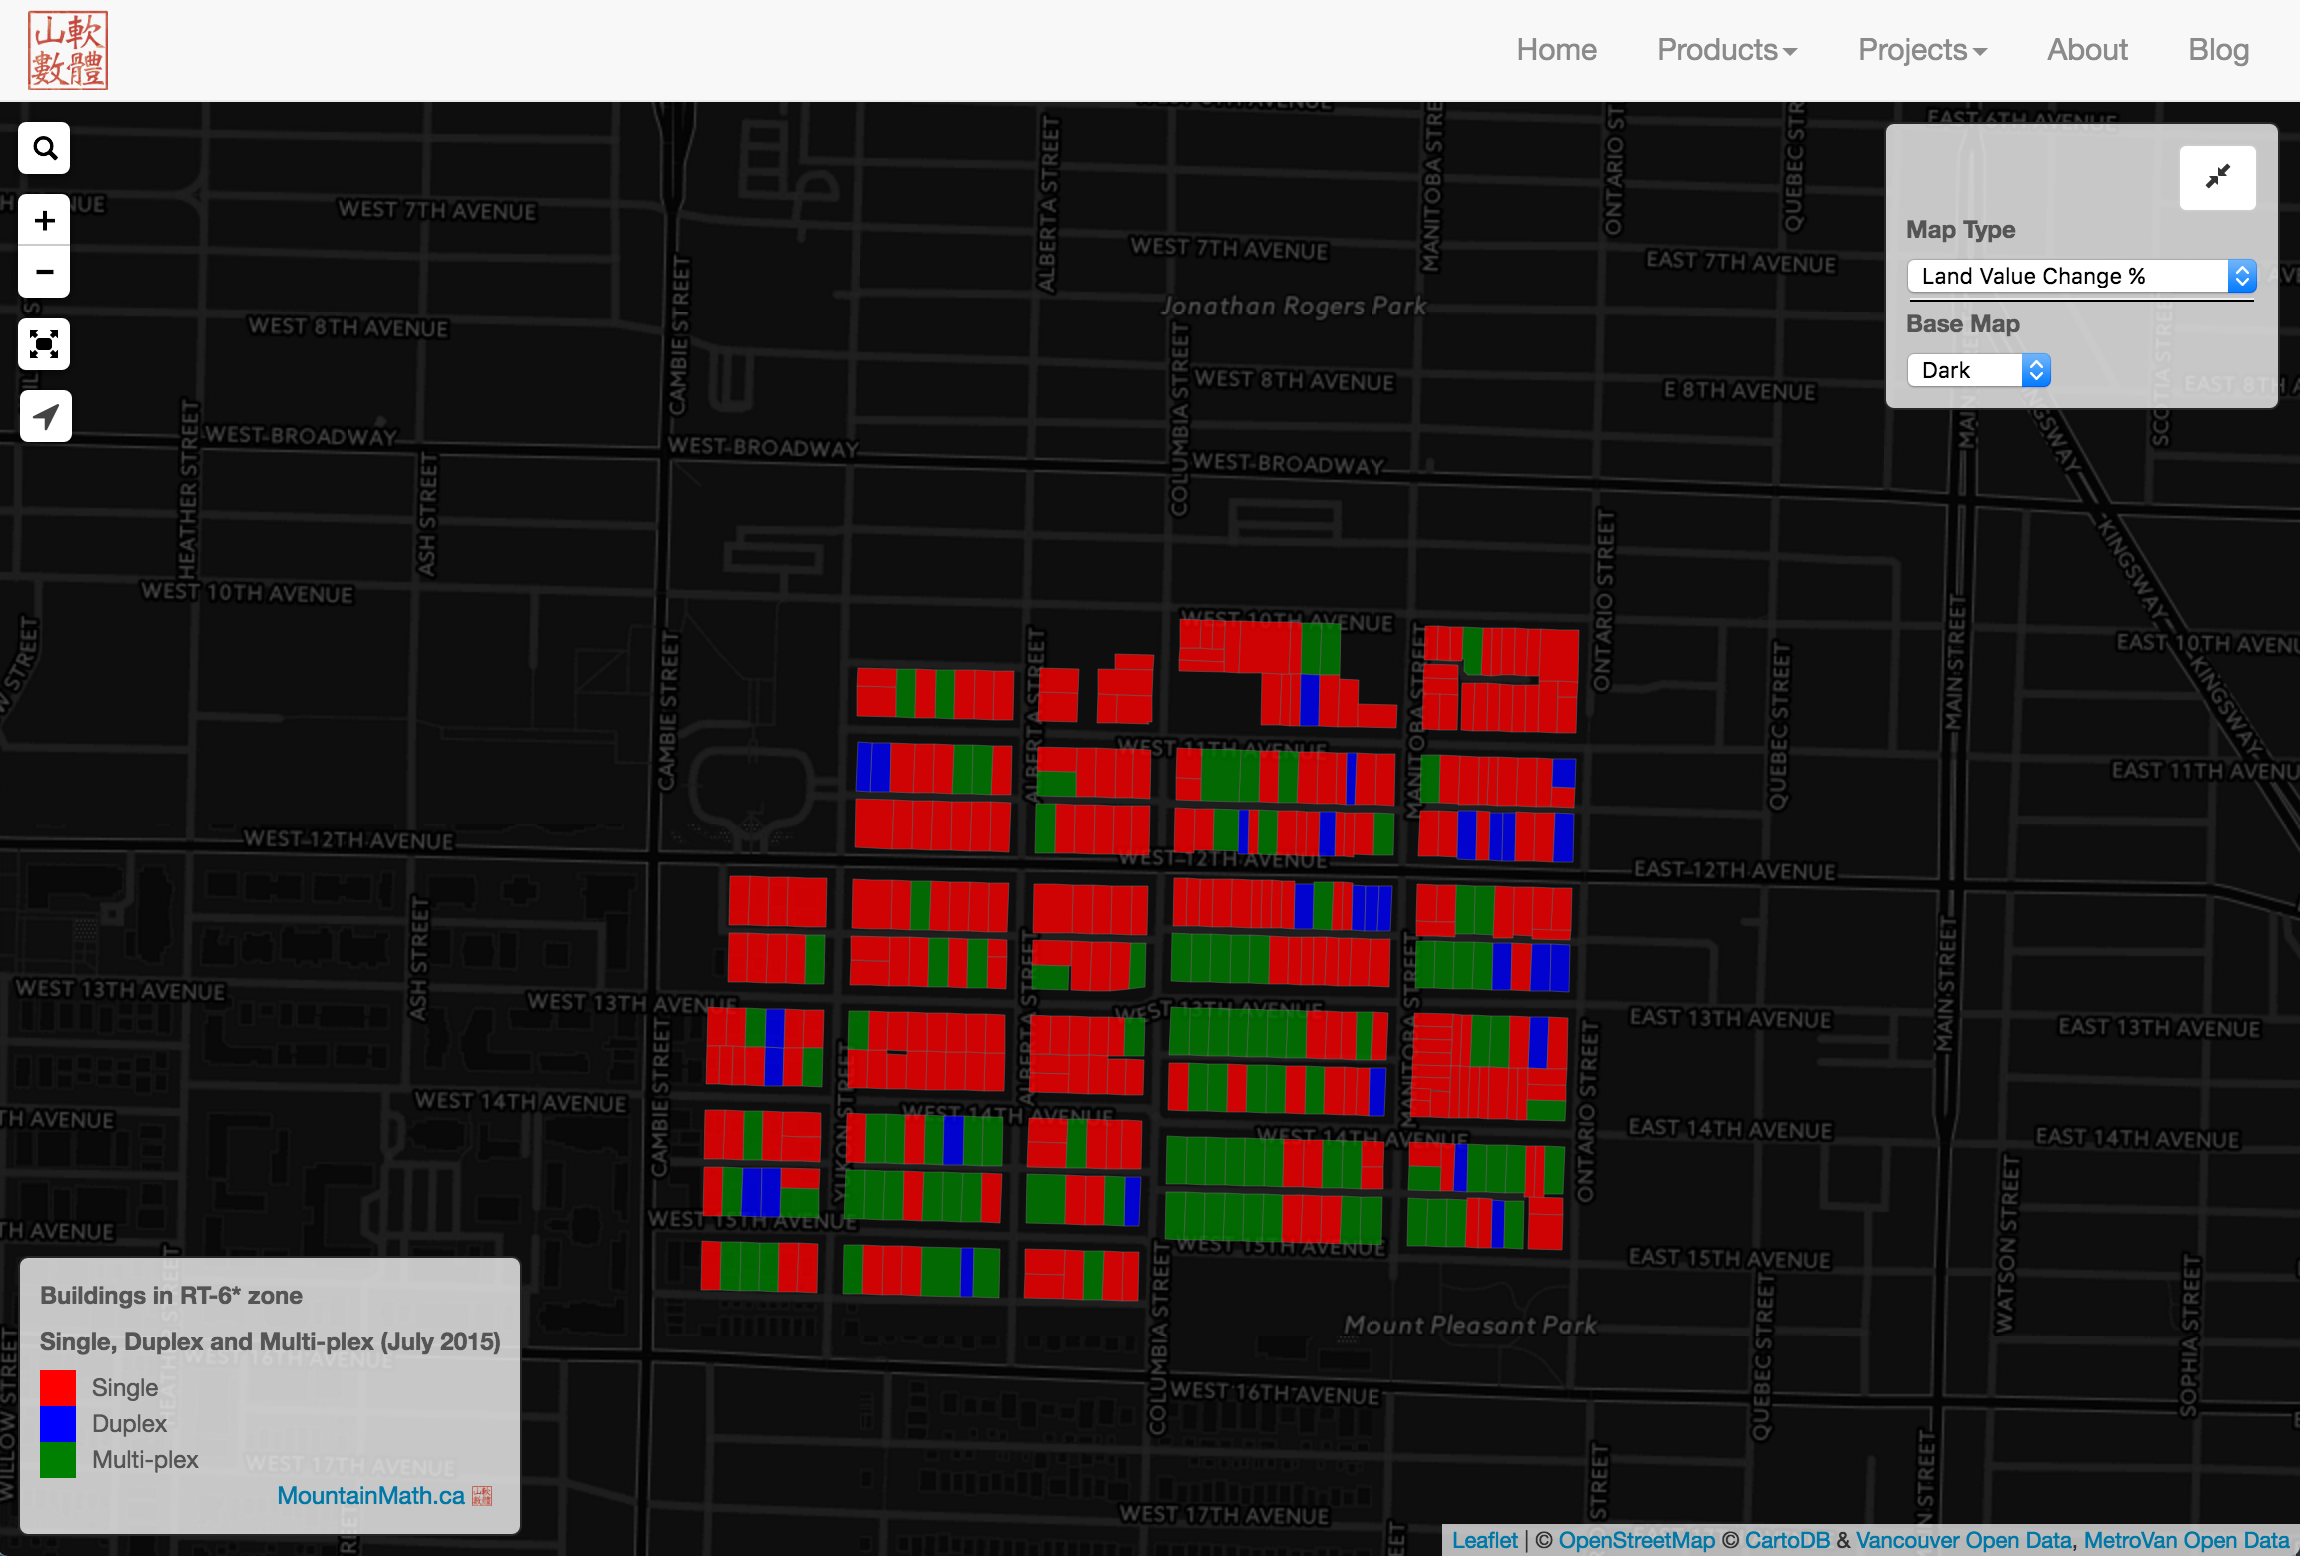 Another interesting example is RT-6. RT-6 has seen modest levels of re-develpment and has a relatively healthy building stock. What’s even more interesting is that it contains many multi-plexes. And more importantly, developments since 2000 have mostly produced multi-plexes.
Prime examples of the gentle density that we keep hearing about. I would say that something is working very well here.
So what’s the difference? In contrast to RT-7 RT-6 zoning allows for 0.6 FSR outright, conditionally increased to 0.75. But there are other important differences too. The RT-7 lots are typically smaller with many at about 340m² compared to the 580m² typical RT-6 lots. (Although RT-7 also contains some 580m² lots).
Conclusion
Does downzoning work? It depends what the goal is. Looking at the RT-7 example, downzoning has slowed re-development compared to other areas in the city, but it also lead to a deterioration in building stock in RT-7. This is a stop-gap measure, eventually that lower value building stock will get re-developed.
The combination of larger lots and the heritage retention program in the RT-6 zoning seems to work in producing gentle density, except that the permitting process takes too long and it is not immediately clear what purpose the heritage preservation has that allows stripping the building down to the studs and possibly moving it to the front and then building an infill in the back. There must be a better way to deal with concerns behind heritage preservation (not much is “preserved” in this process) and at the same time cut down on the time it takes to jump through all the permit hoops involved.
It is clear that RS and RT (and RM) zoning would hugely profit from a clearer vision what these zonings should accomplish and by using data to benchmark how these targets are met.
Reuse
Citation
@misc{rt.2016,
  author = {{von Bergmann}, Jens},
  title = {What’s up with {RT?}},
  date = {2016-08-04},
  url = {https://doodles.mountainmath.ca/posts/2016-08-04-rt/},
  langid = {en}
}
