Some time ago I saw Geoff Boeing’s excellent package to generate Jane Jacobs style street grid images. It’s lots of fun to compare different cities that way.
It can be hard to represent one city by one square mile, so I thought it would be neat to use this to compare different parts of Vancouver. Some common themes emerge for the central parts, the more outlying areas display very differnet patterns.
So I dropped a couple of points on a map, downloaded the geojson and ran the script below. These are the results:
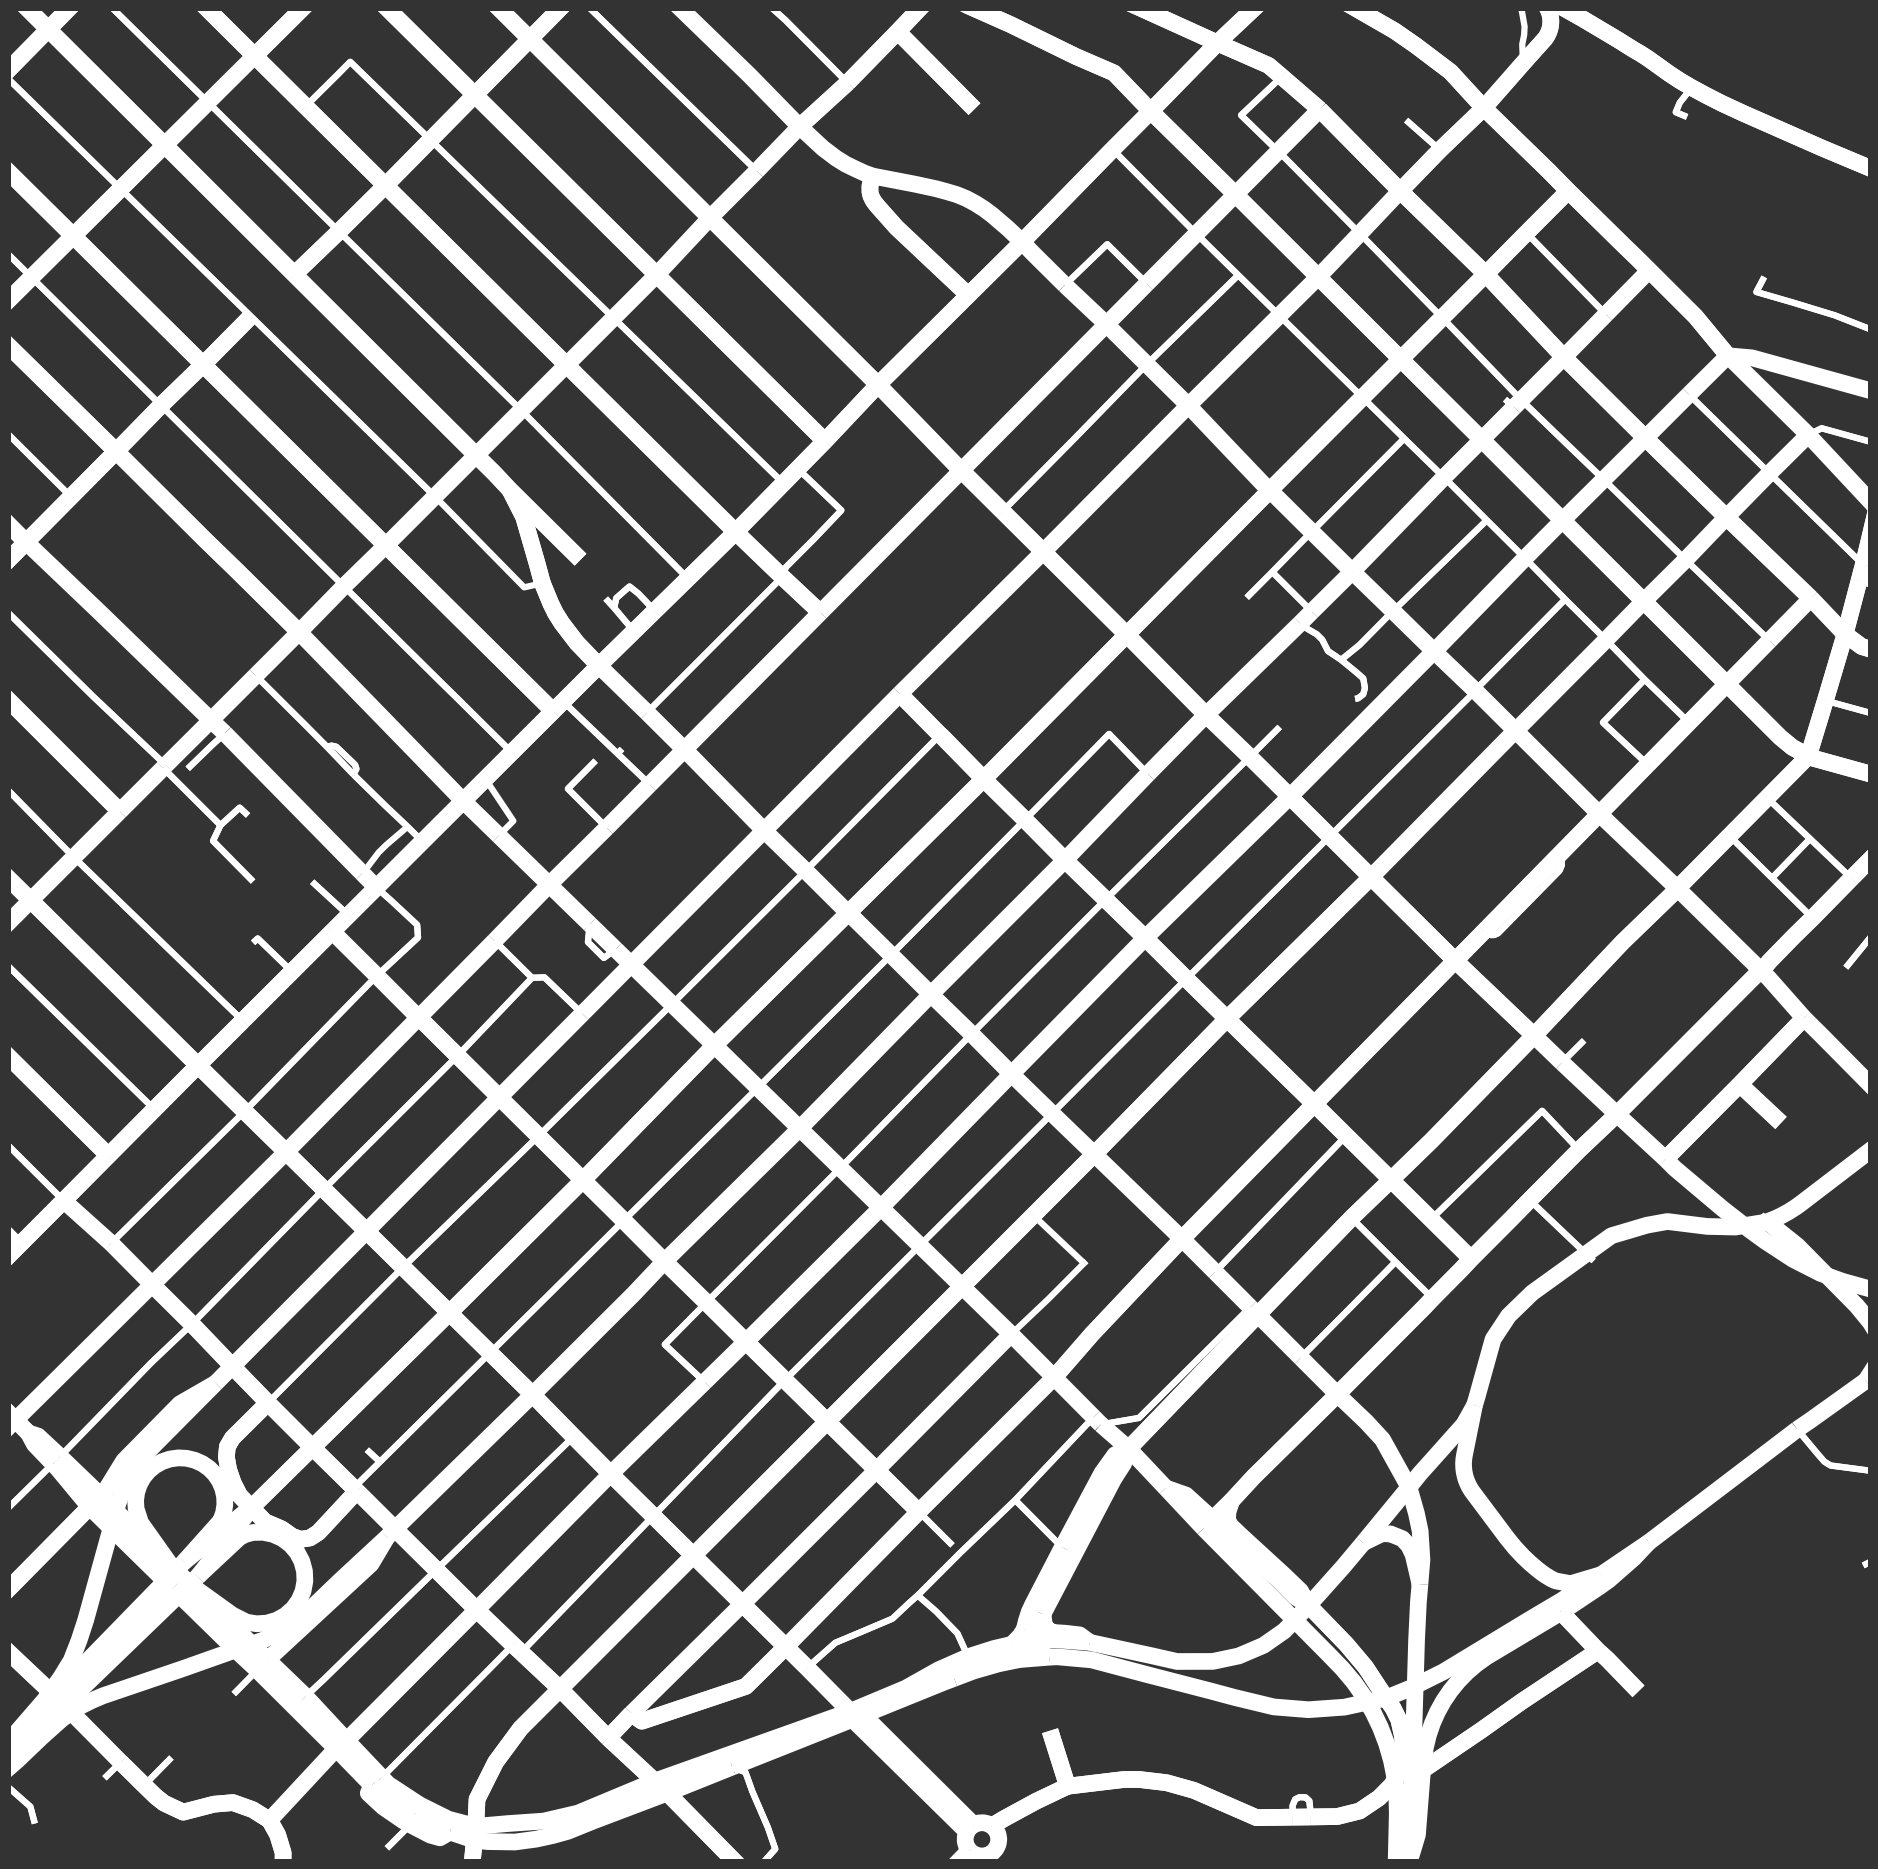
Downtown
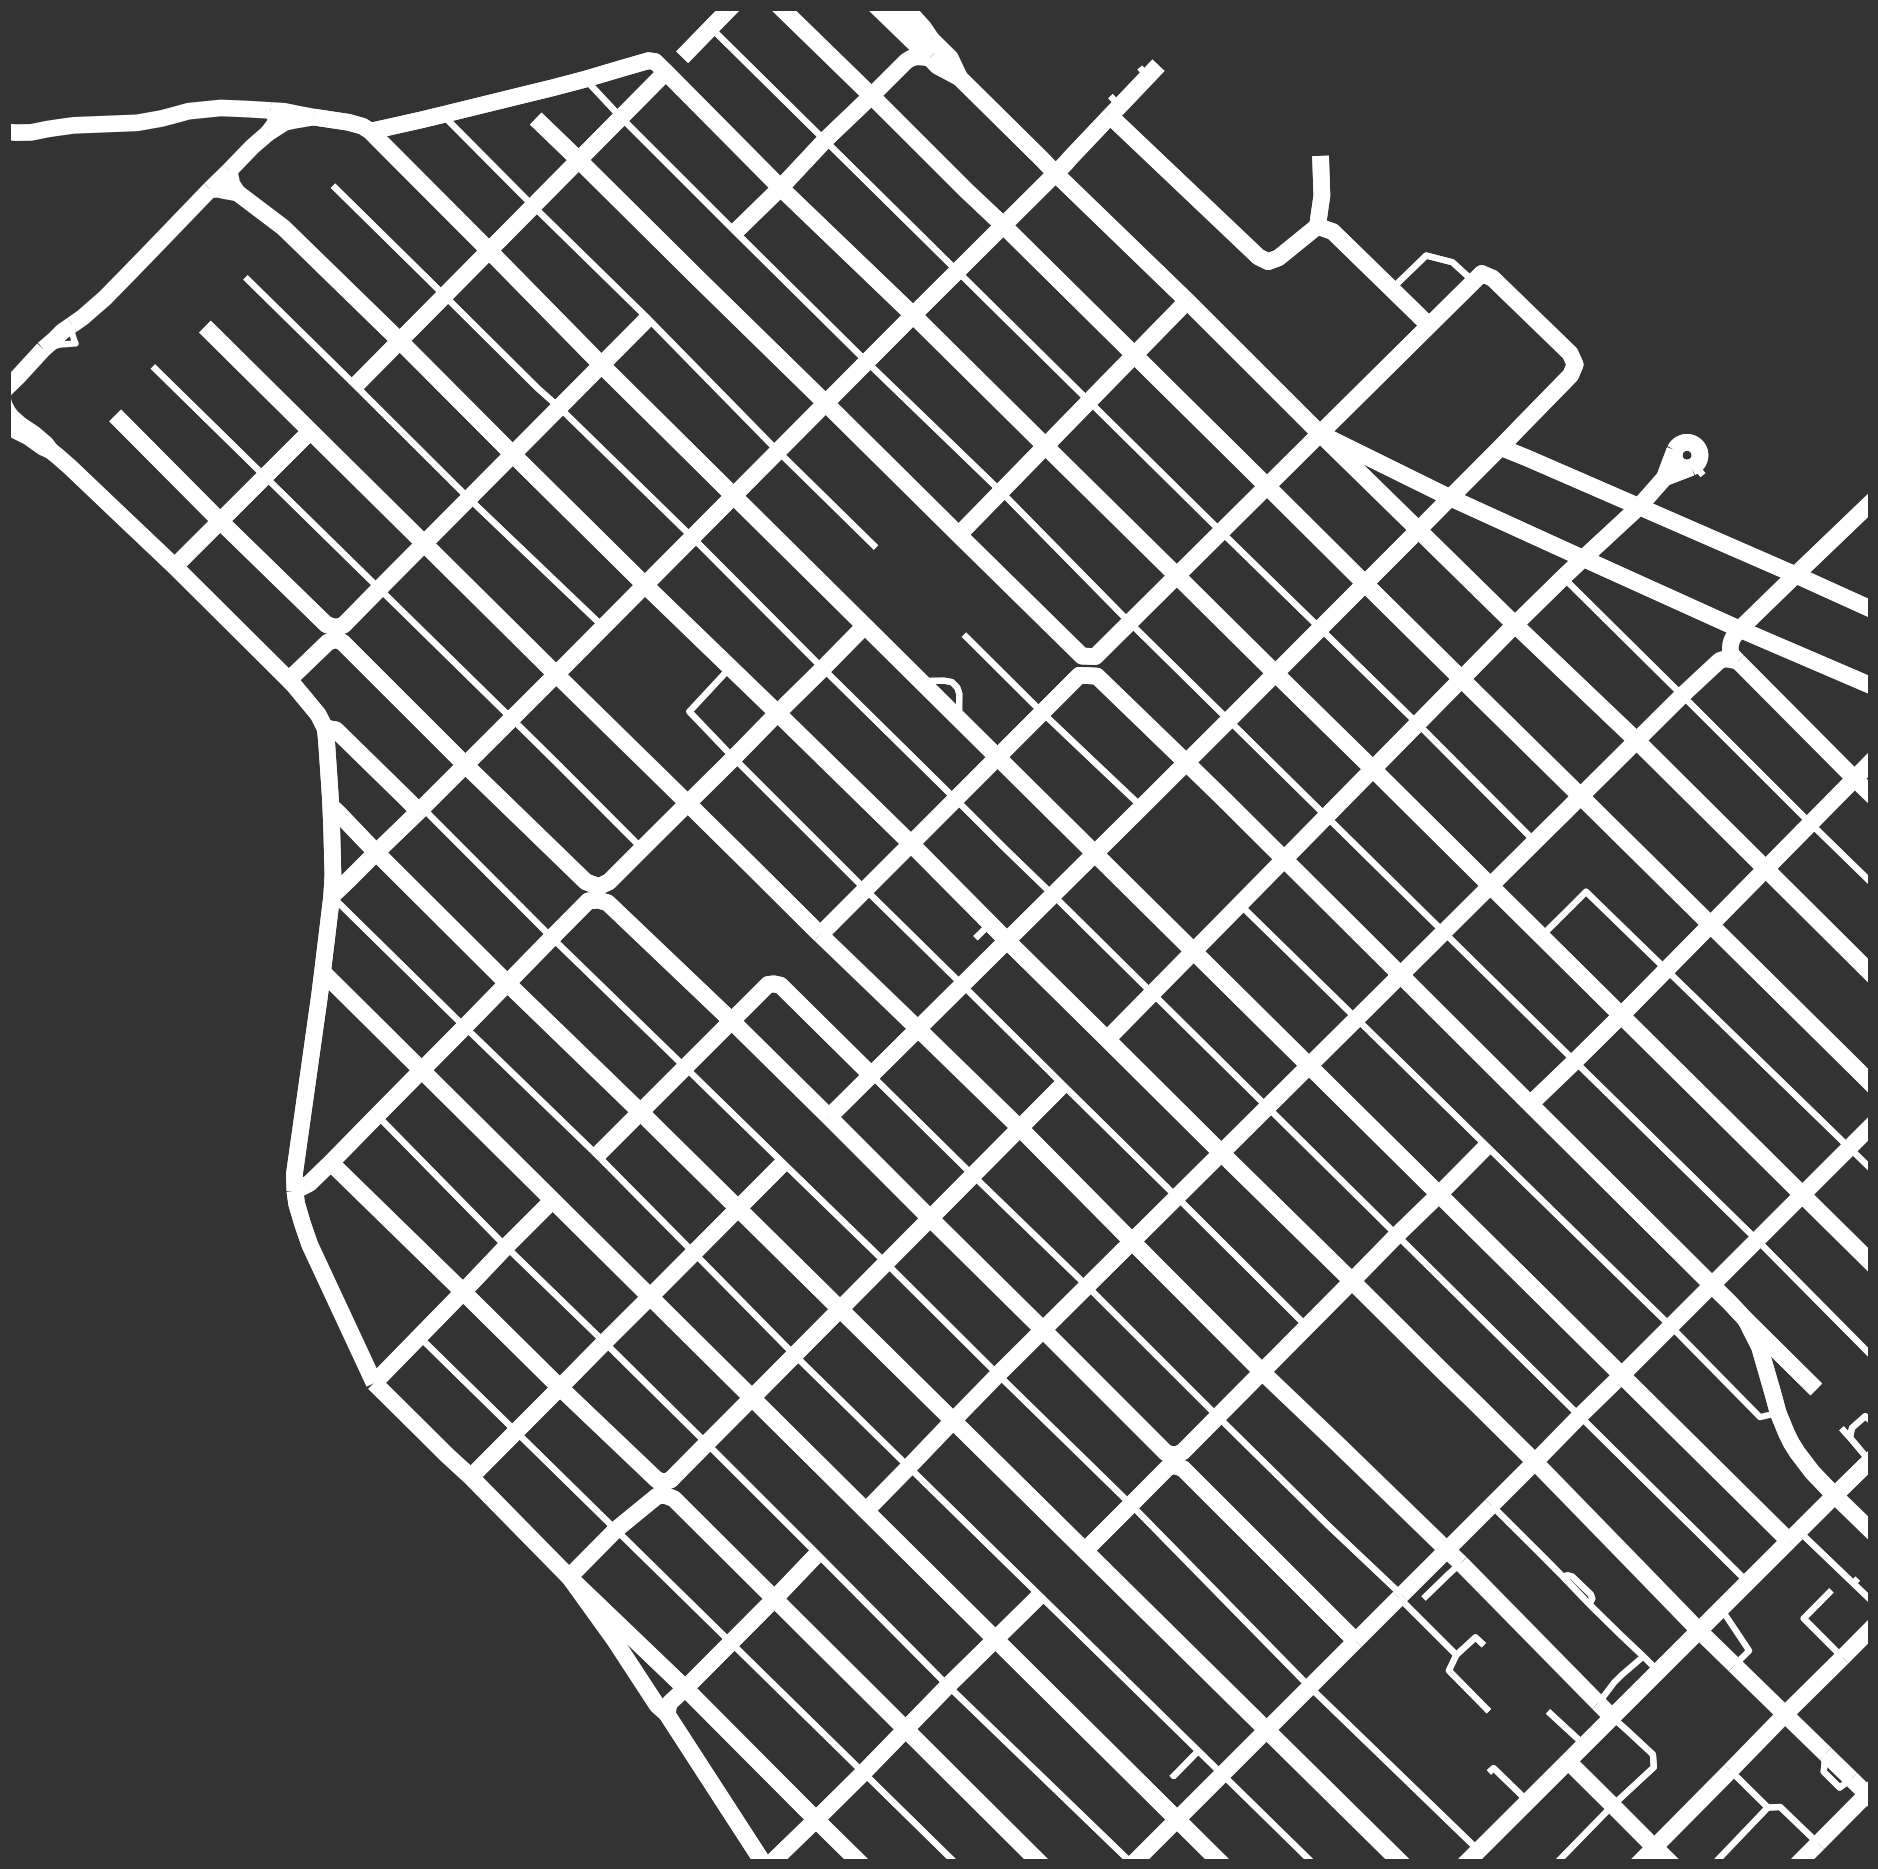
West End
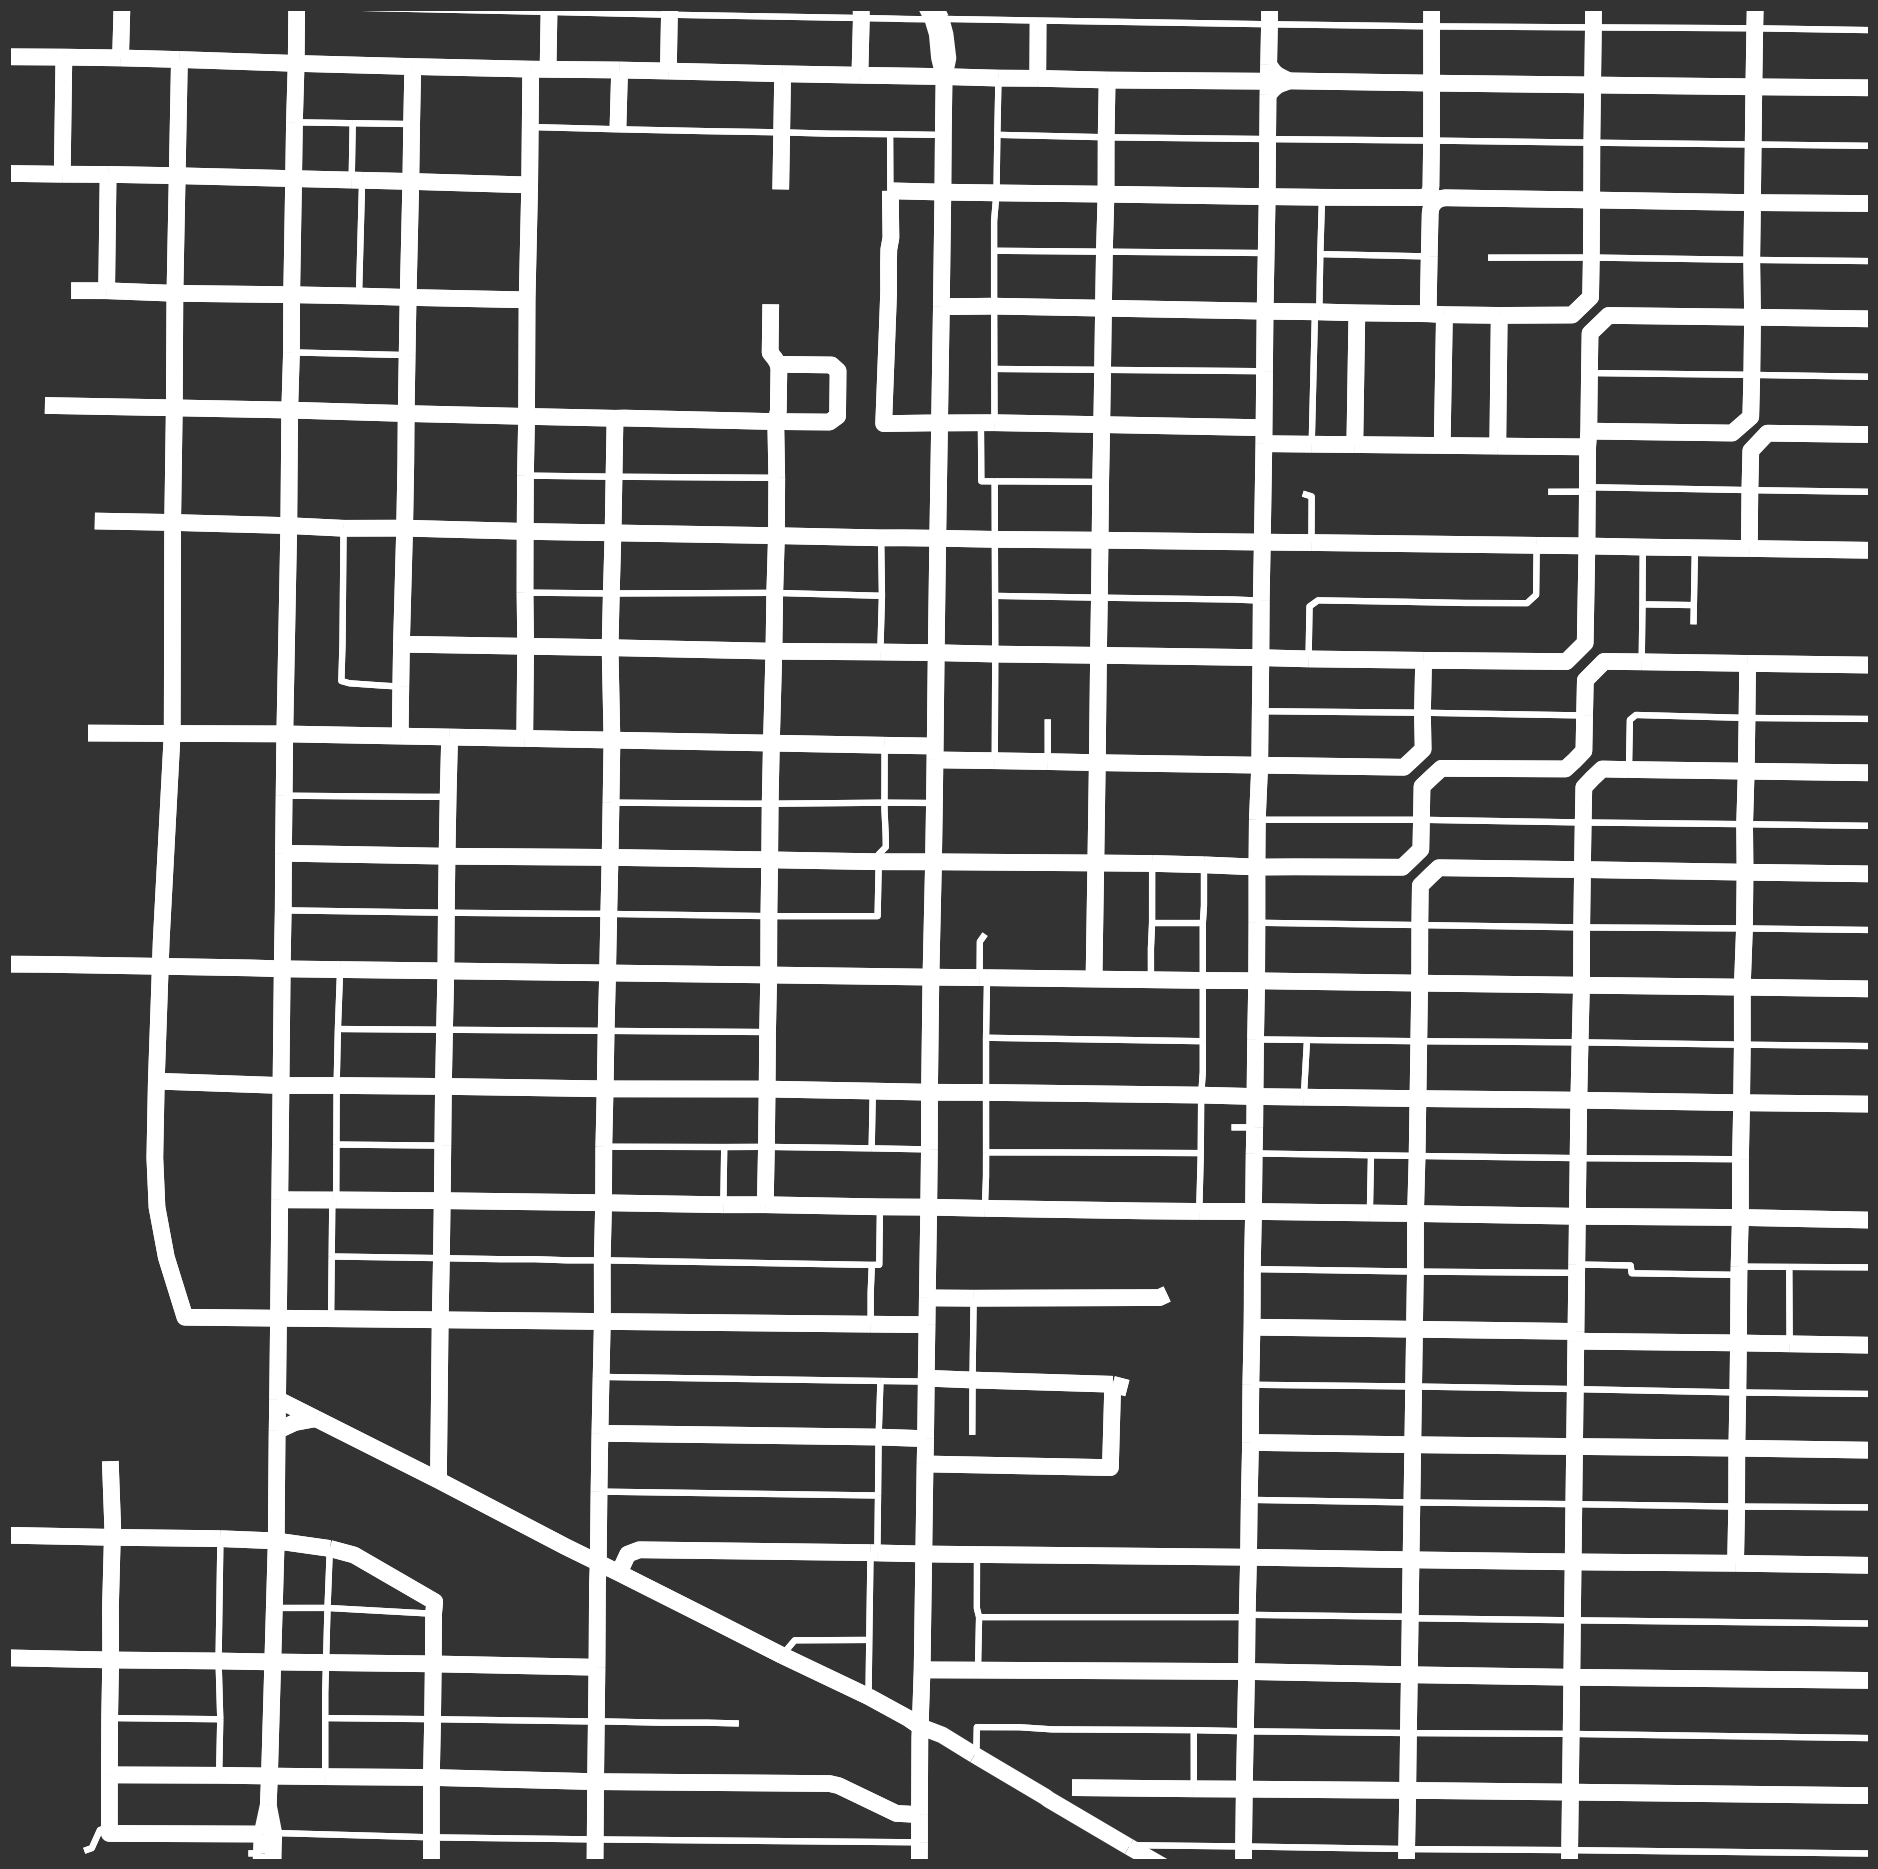
Grandview Woodlands
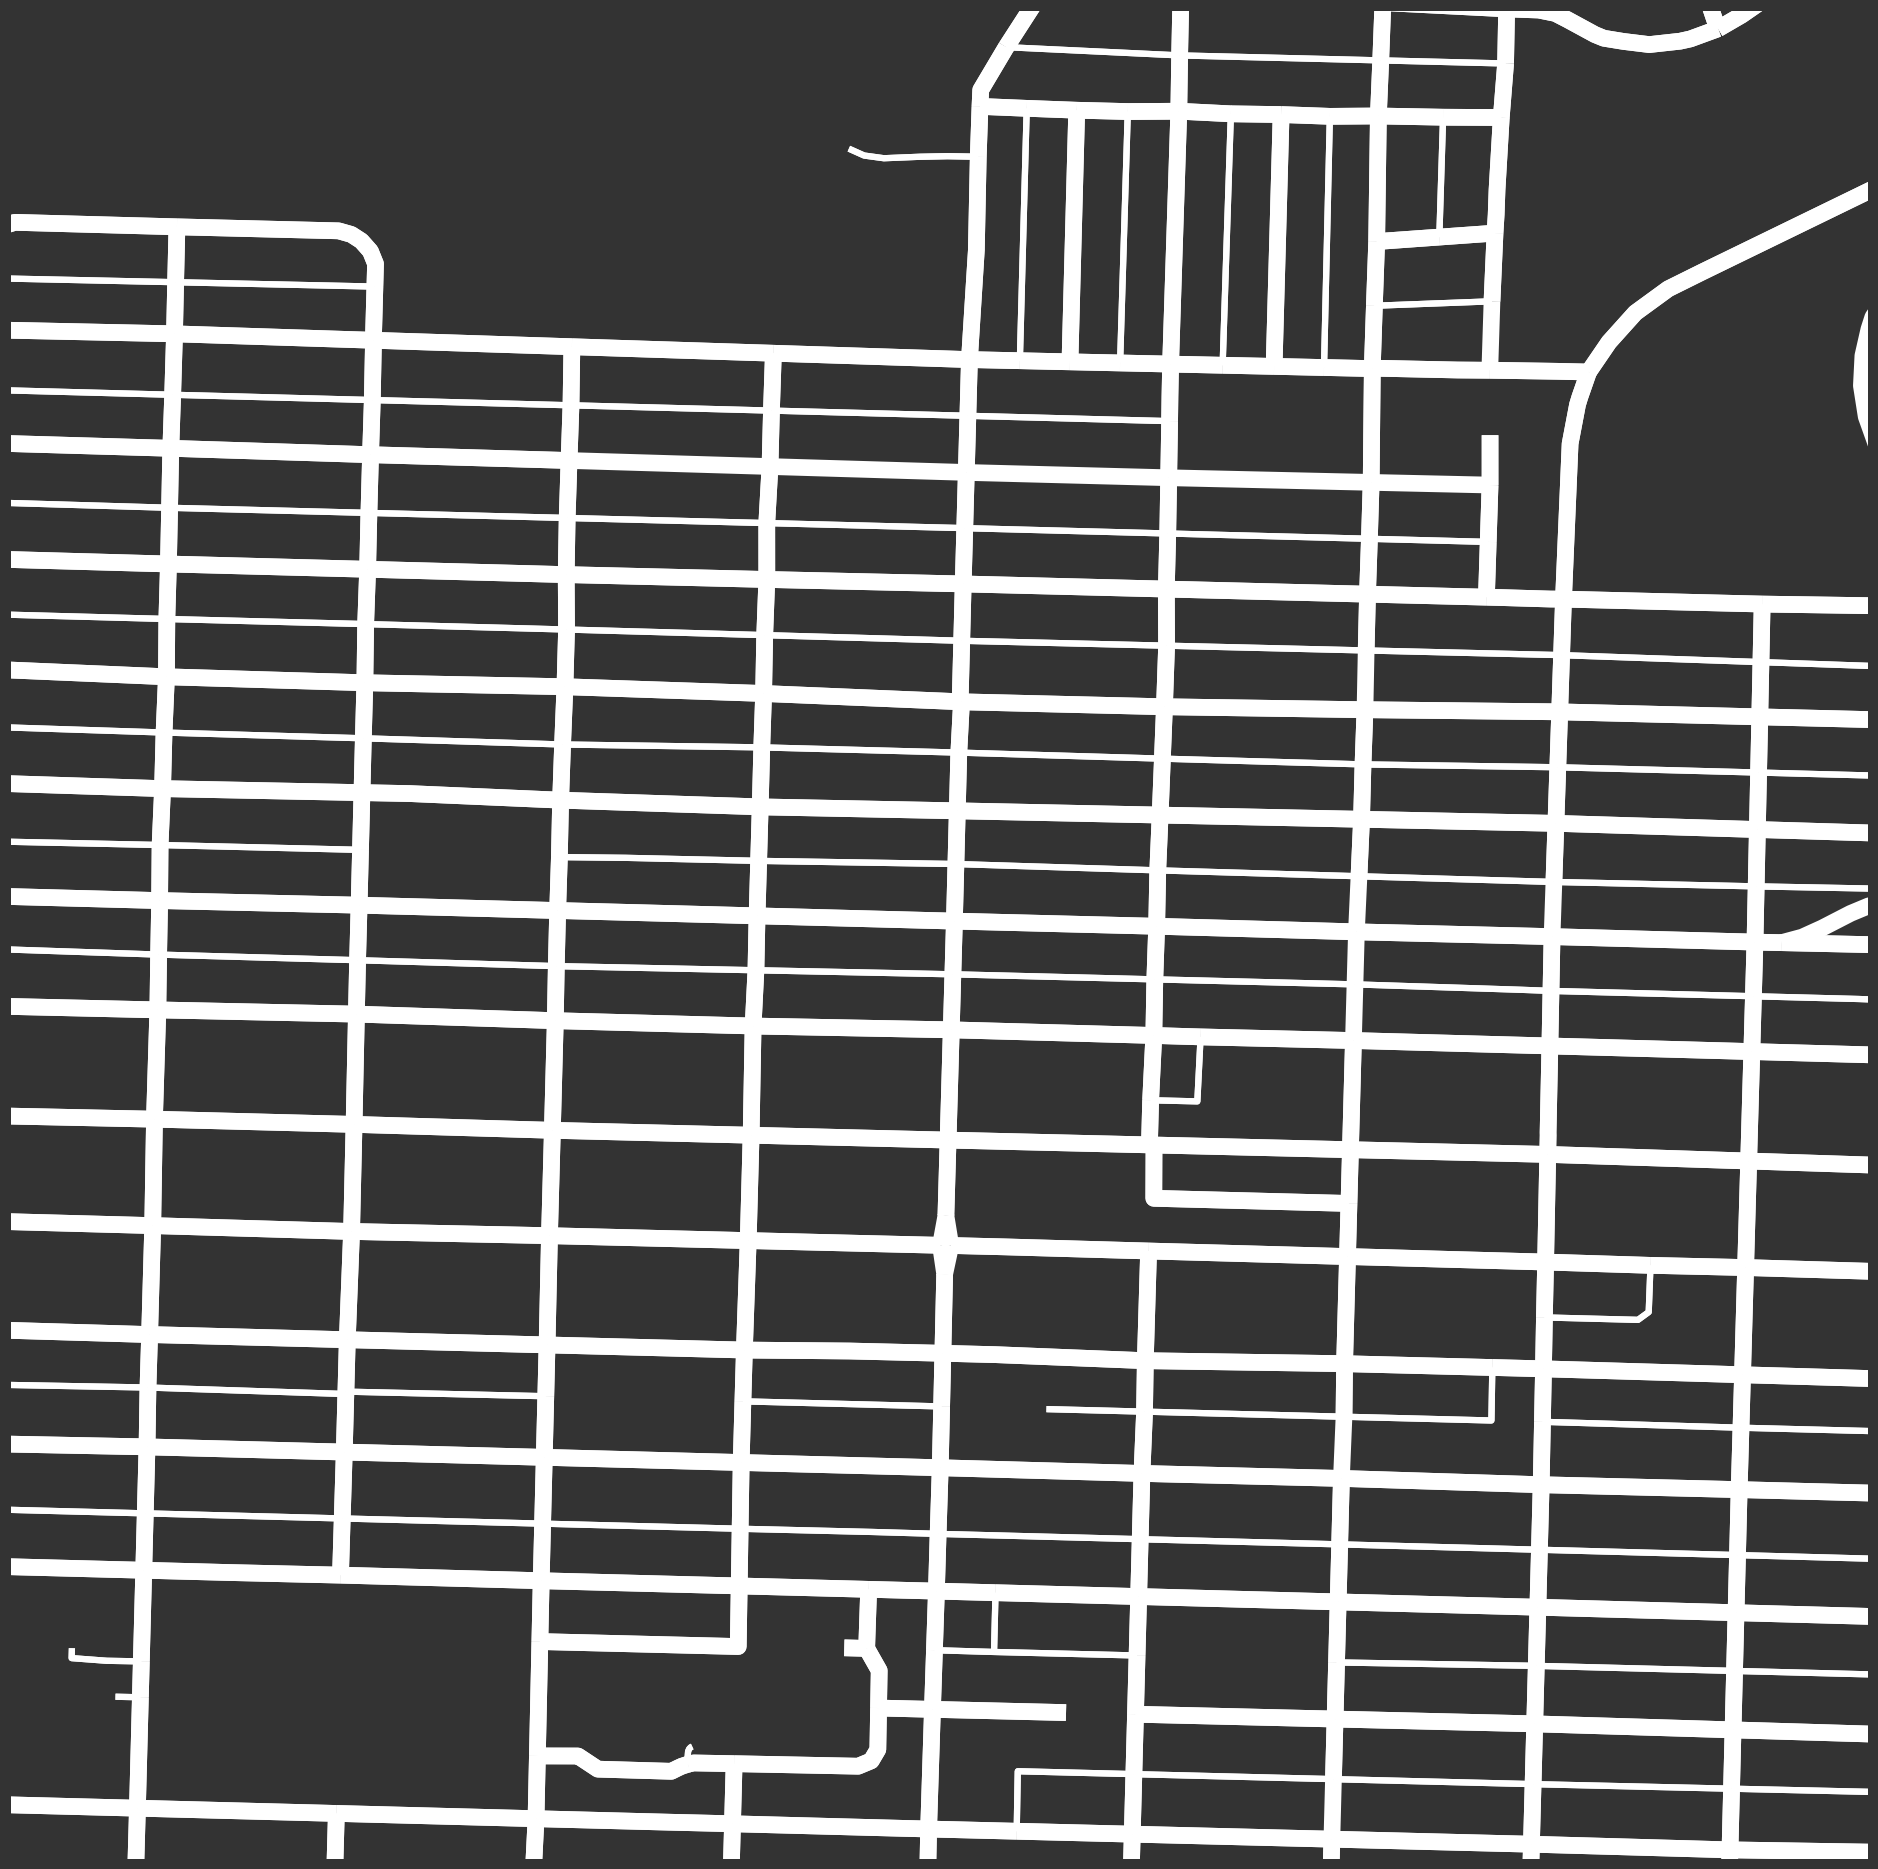
Kitsilano
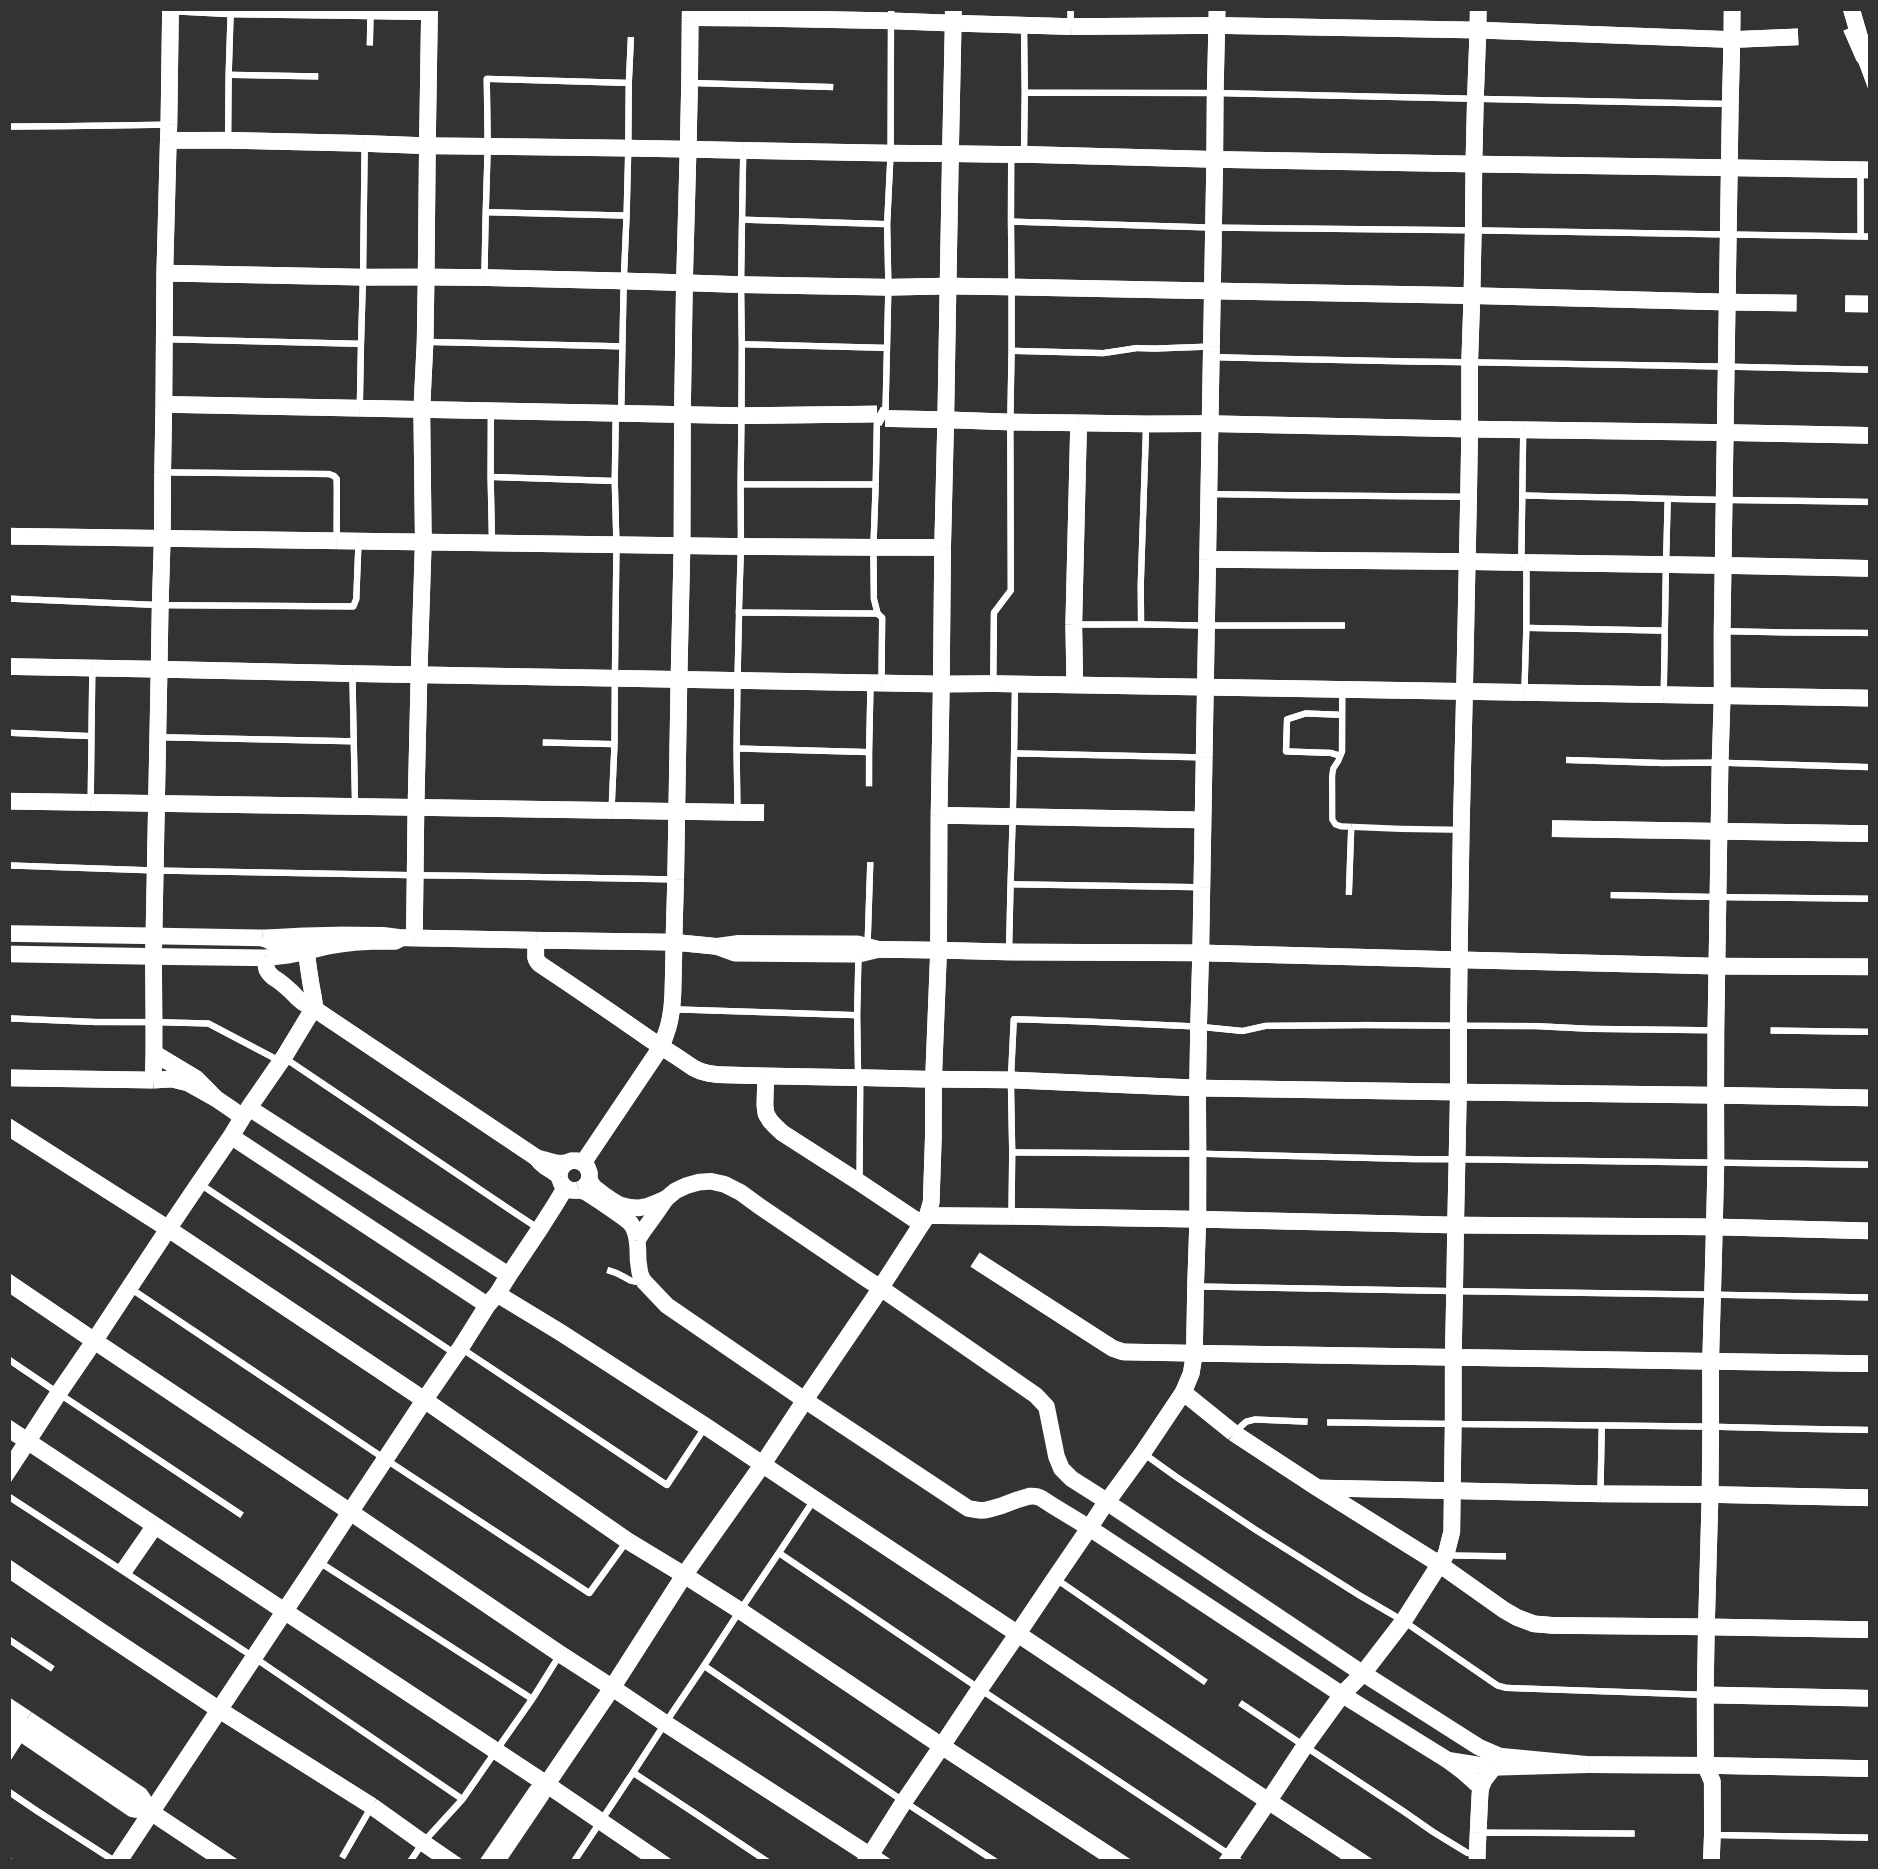
North Vancouver
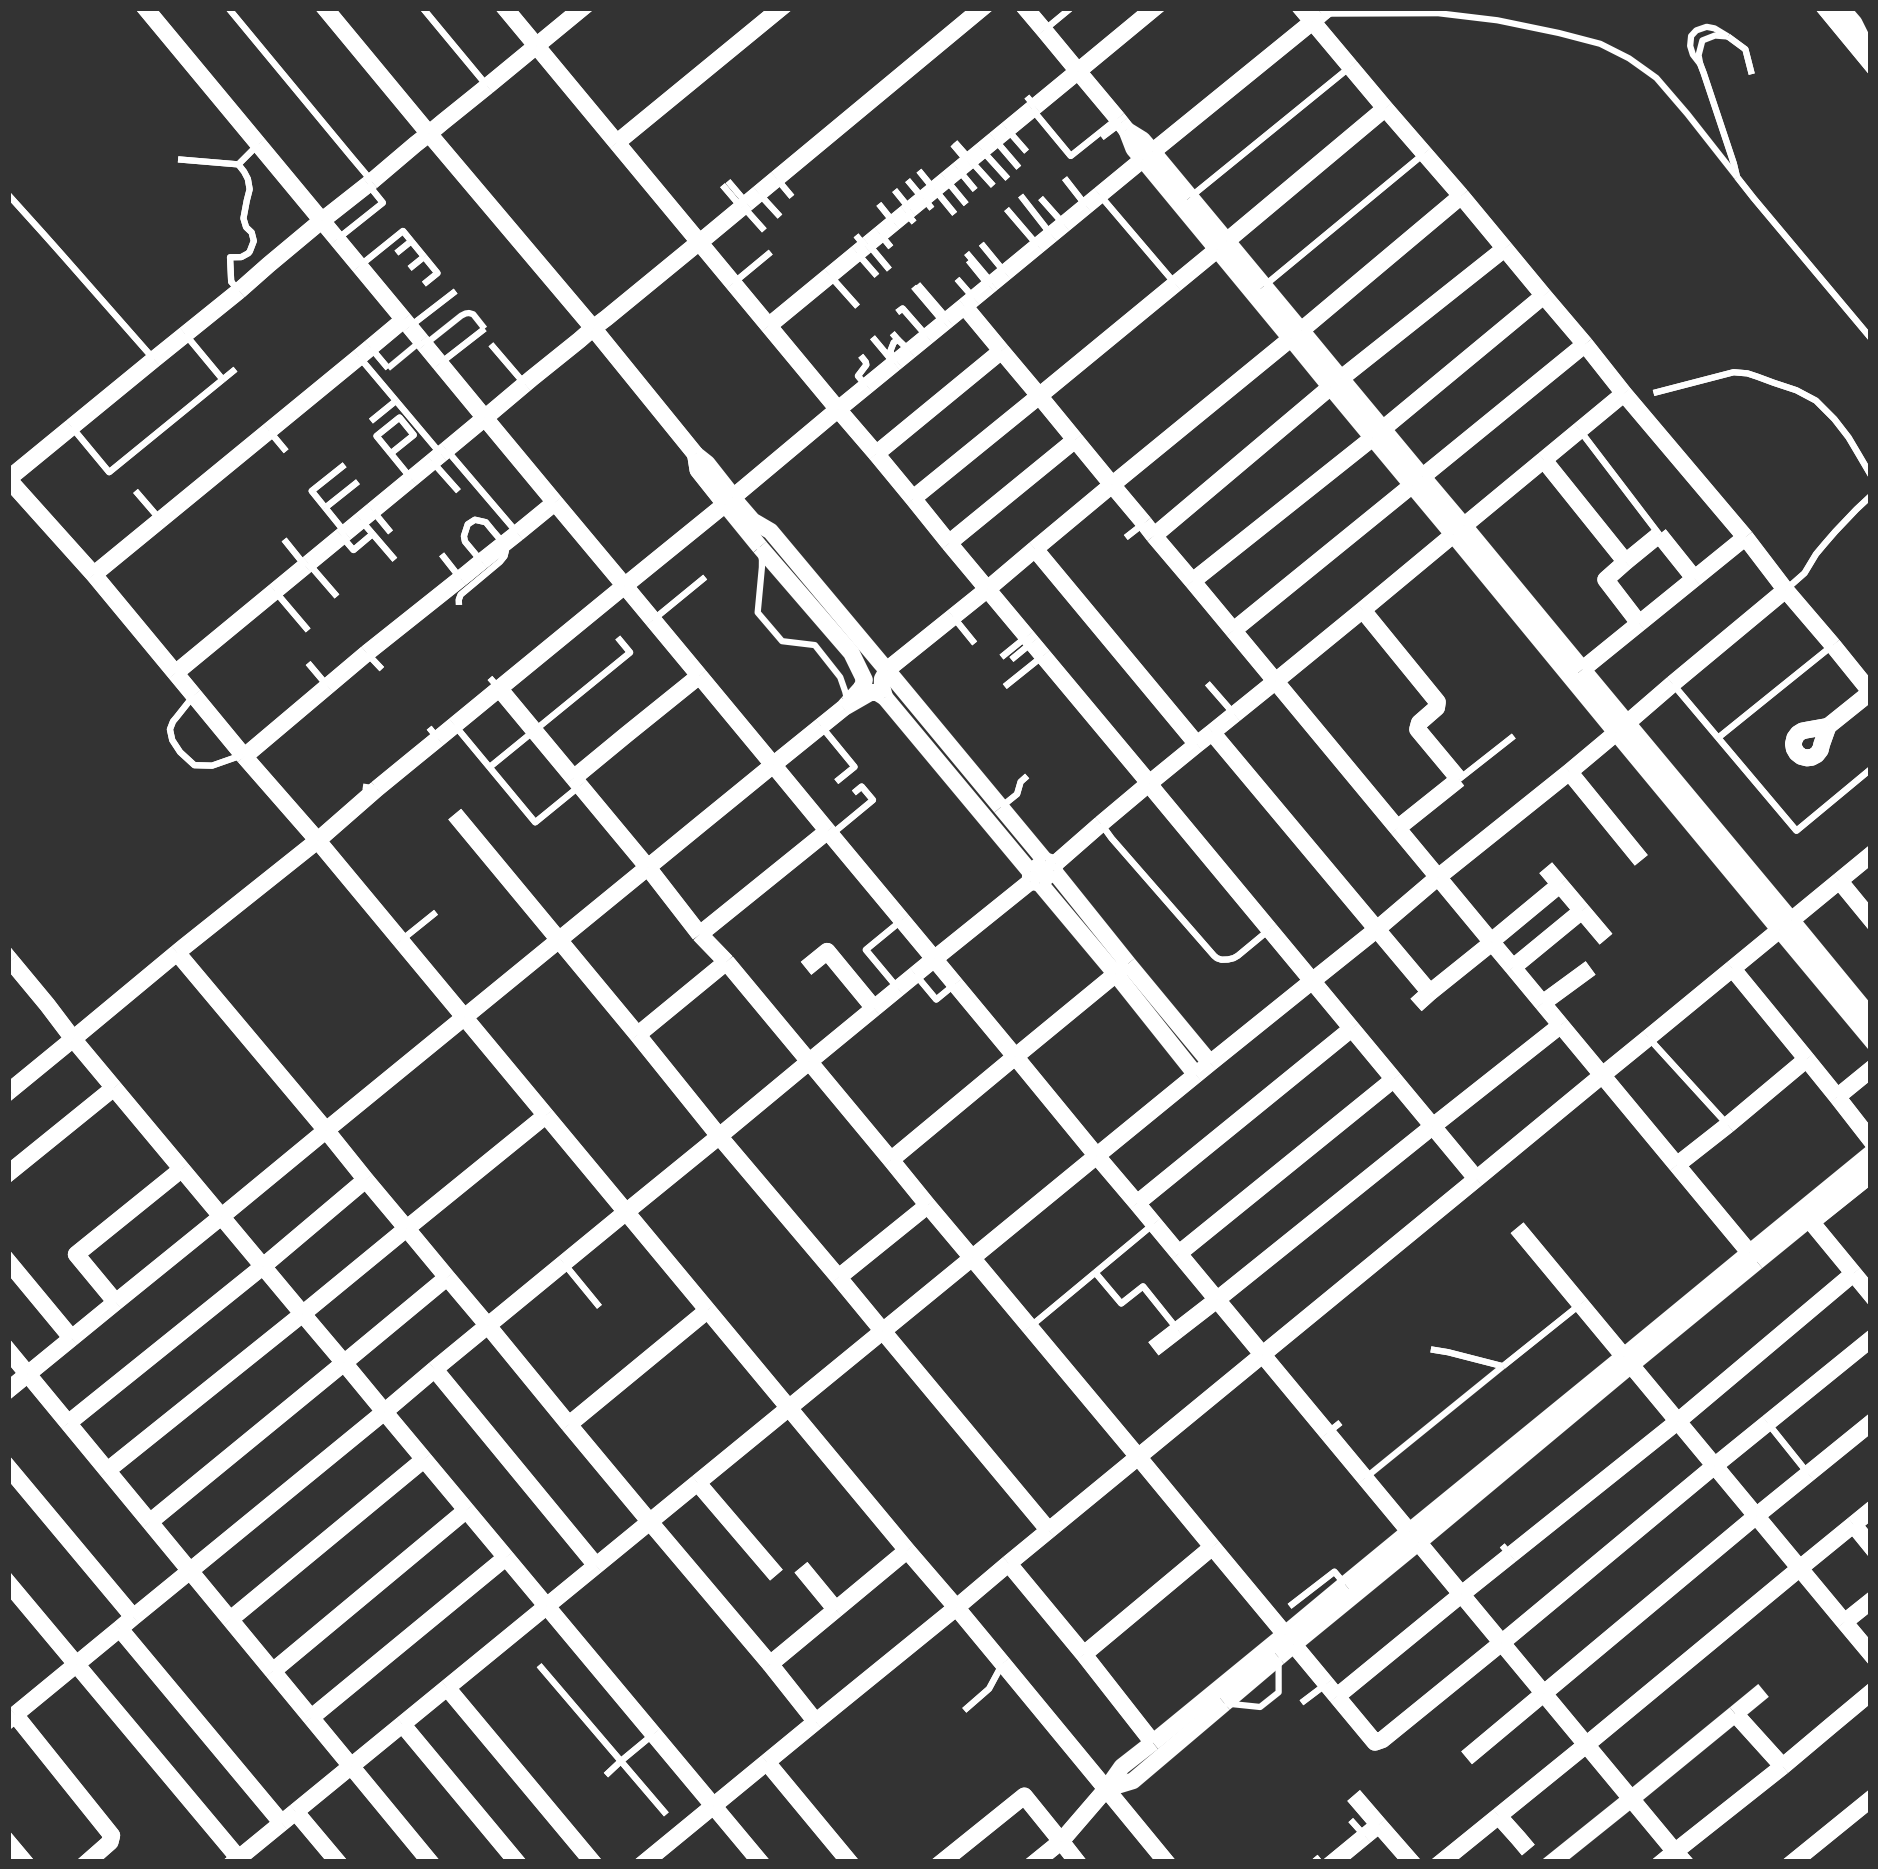
New West
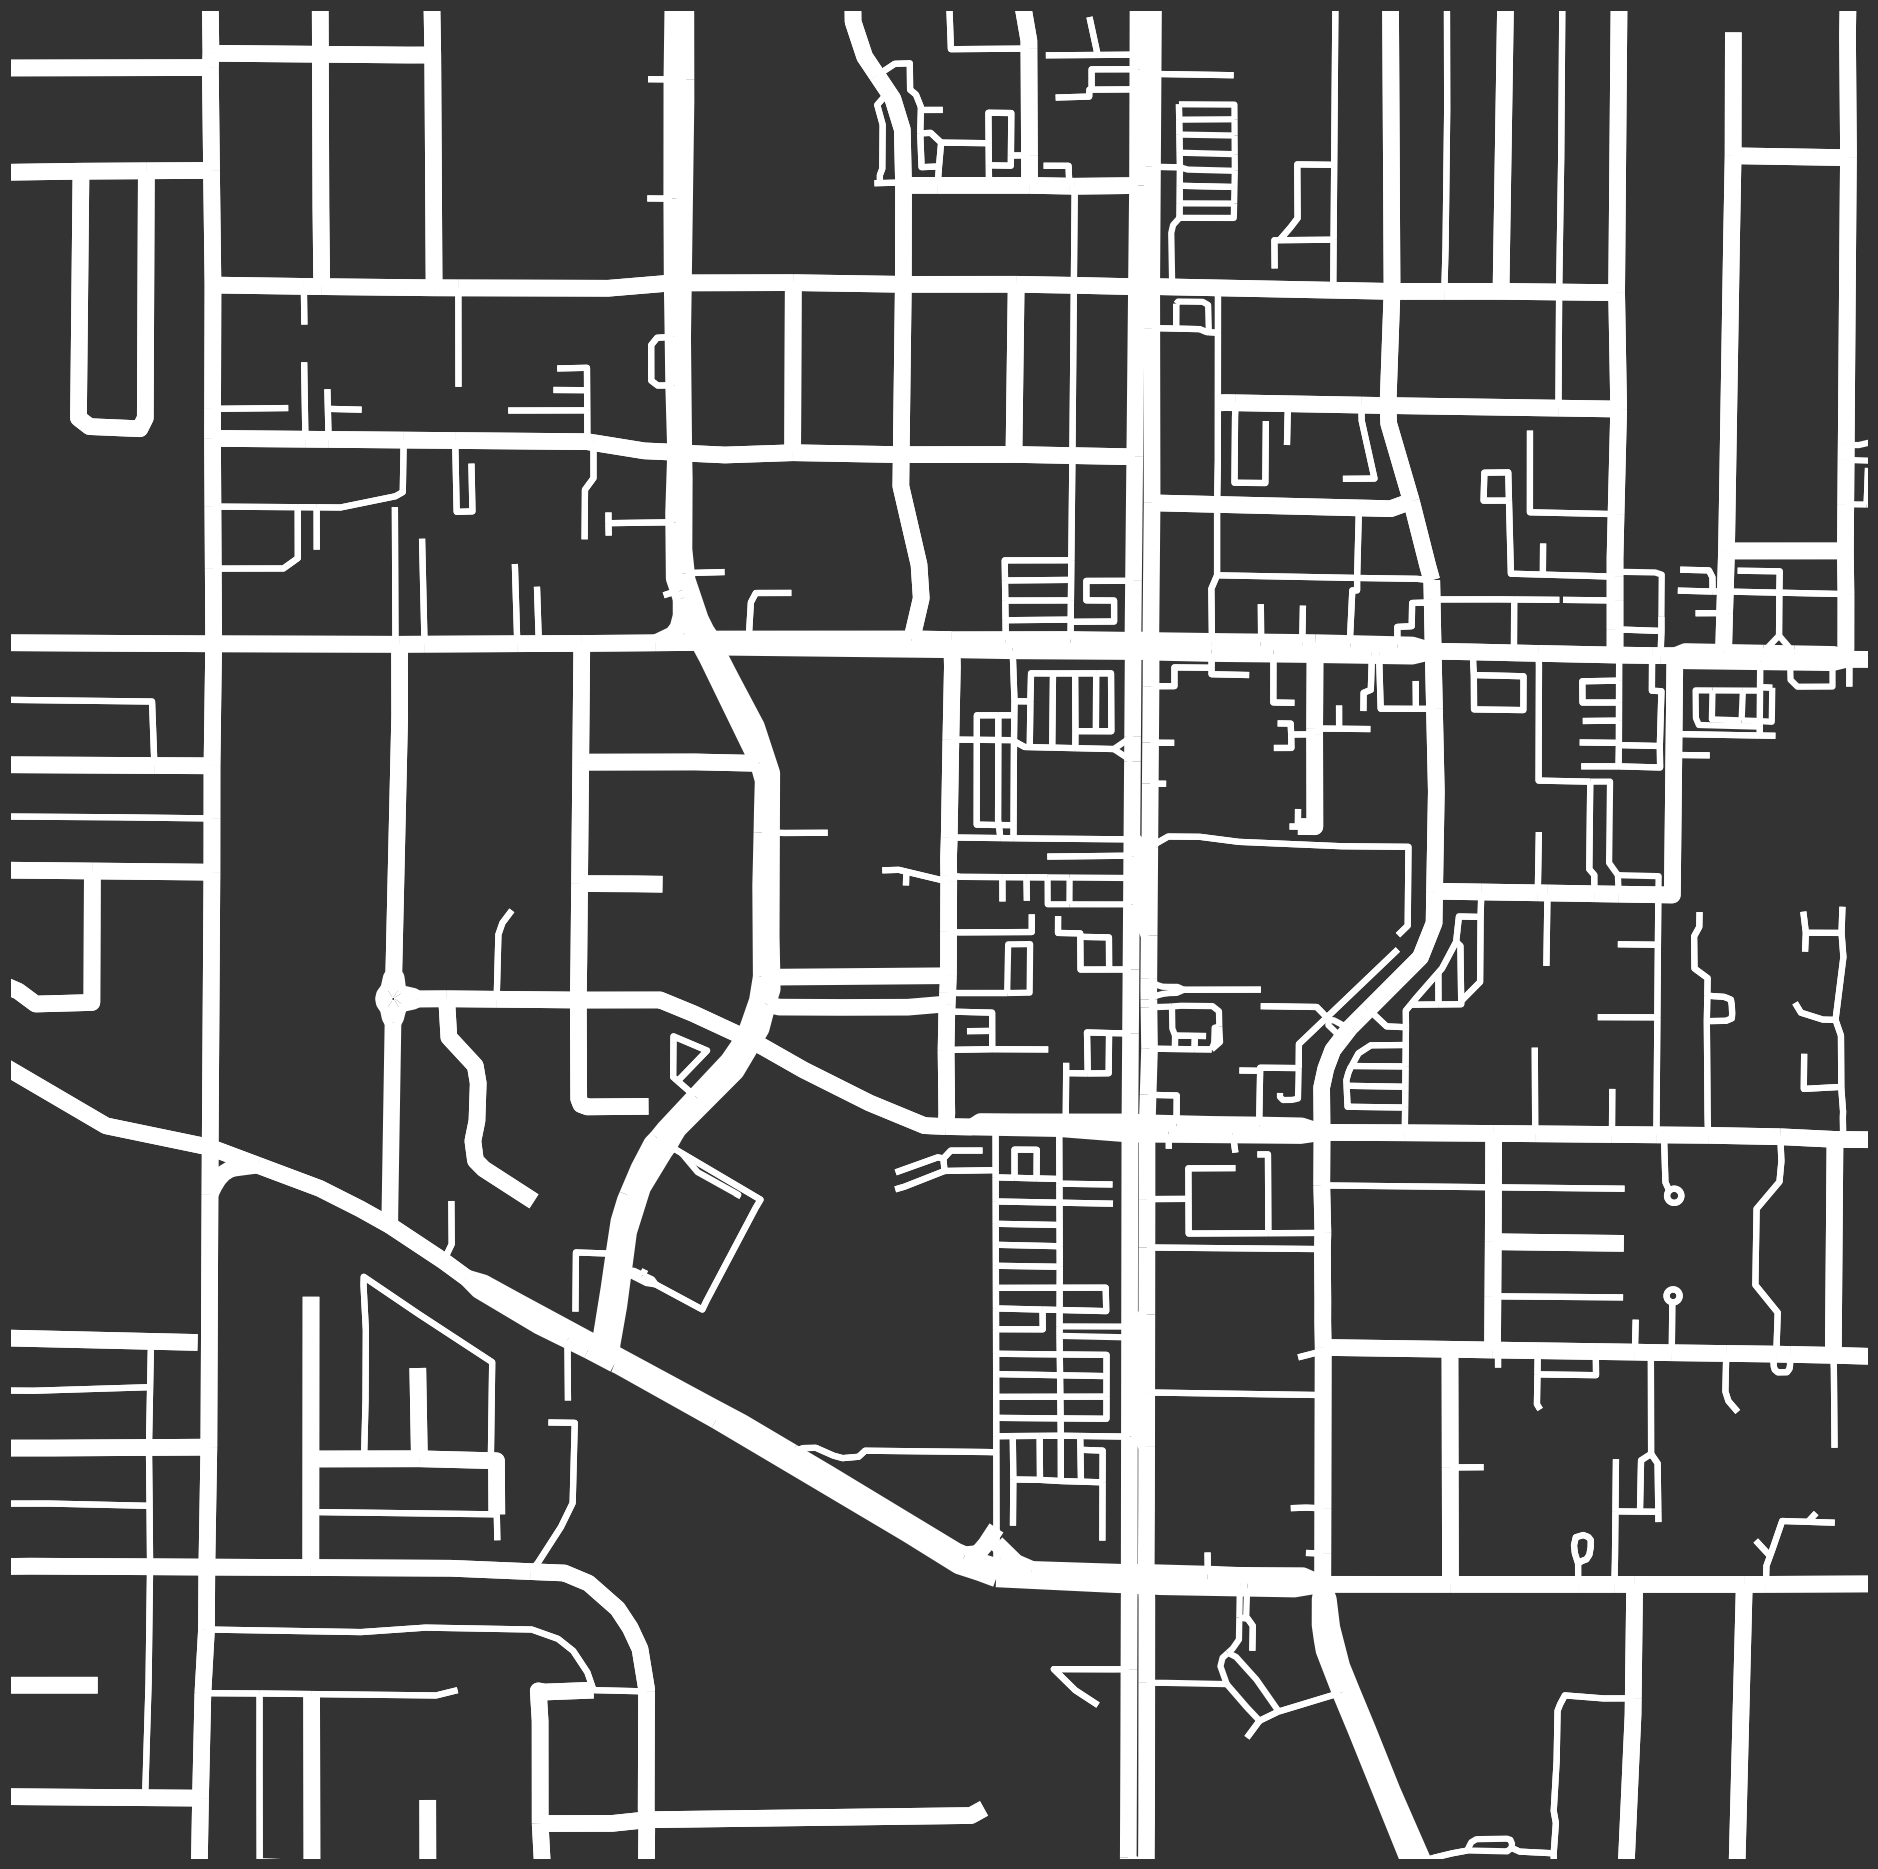
Surrey
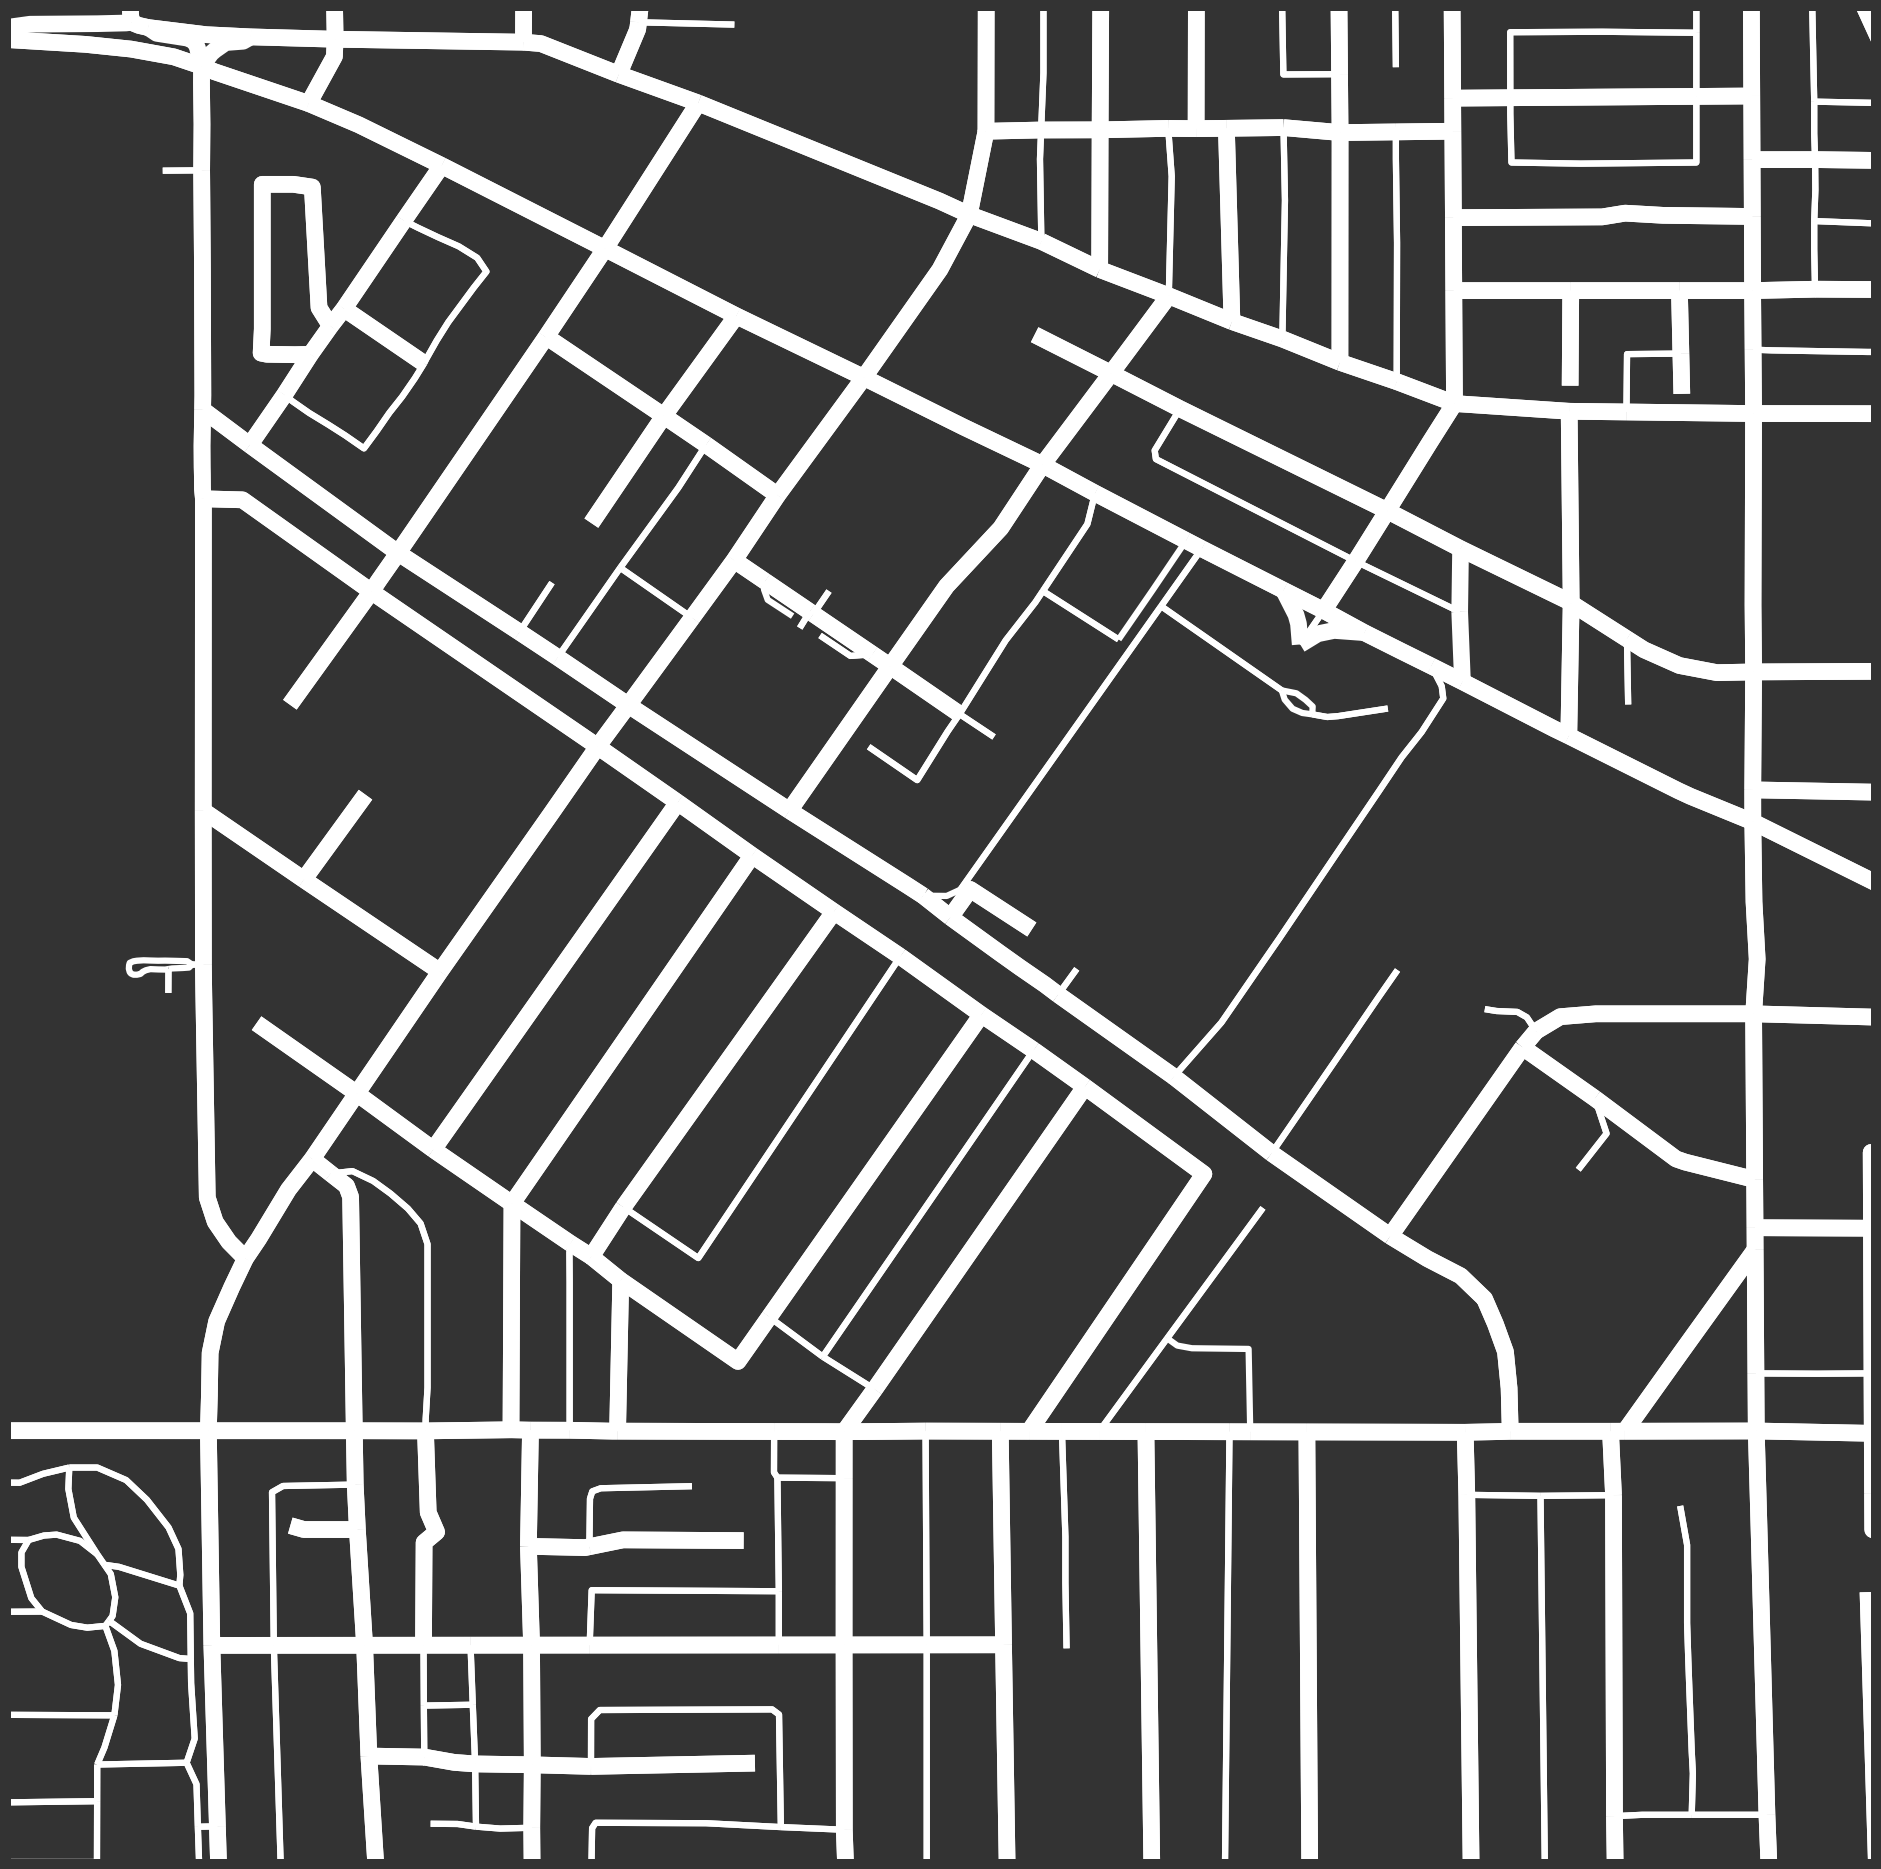
Metrotown
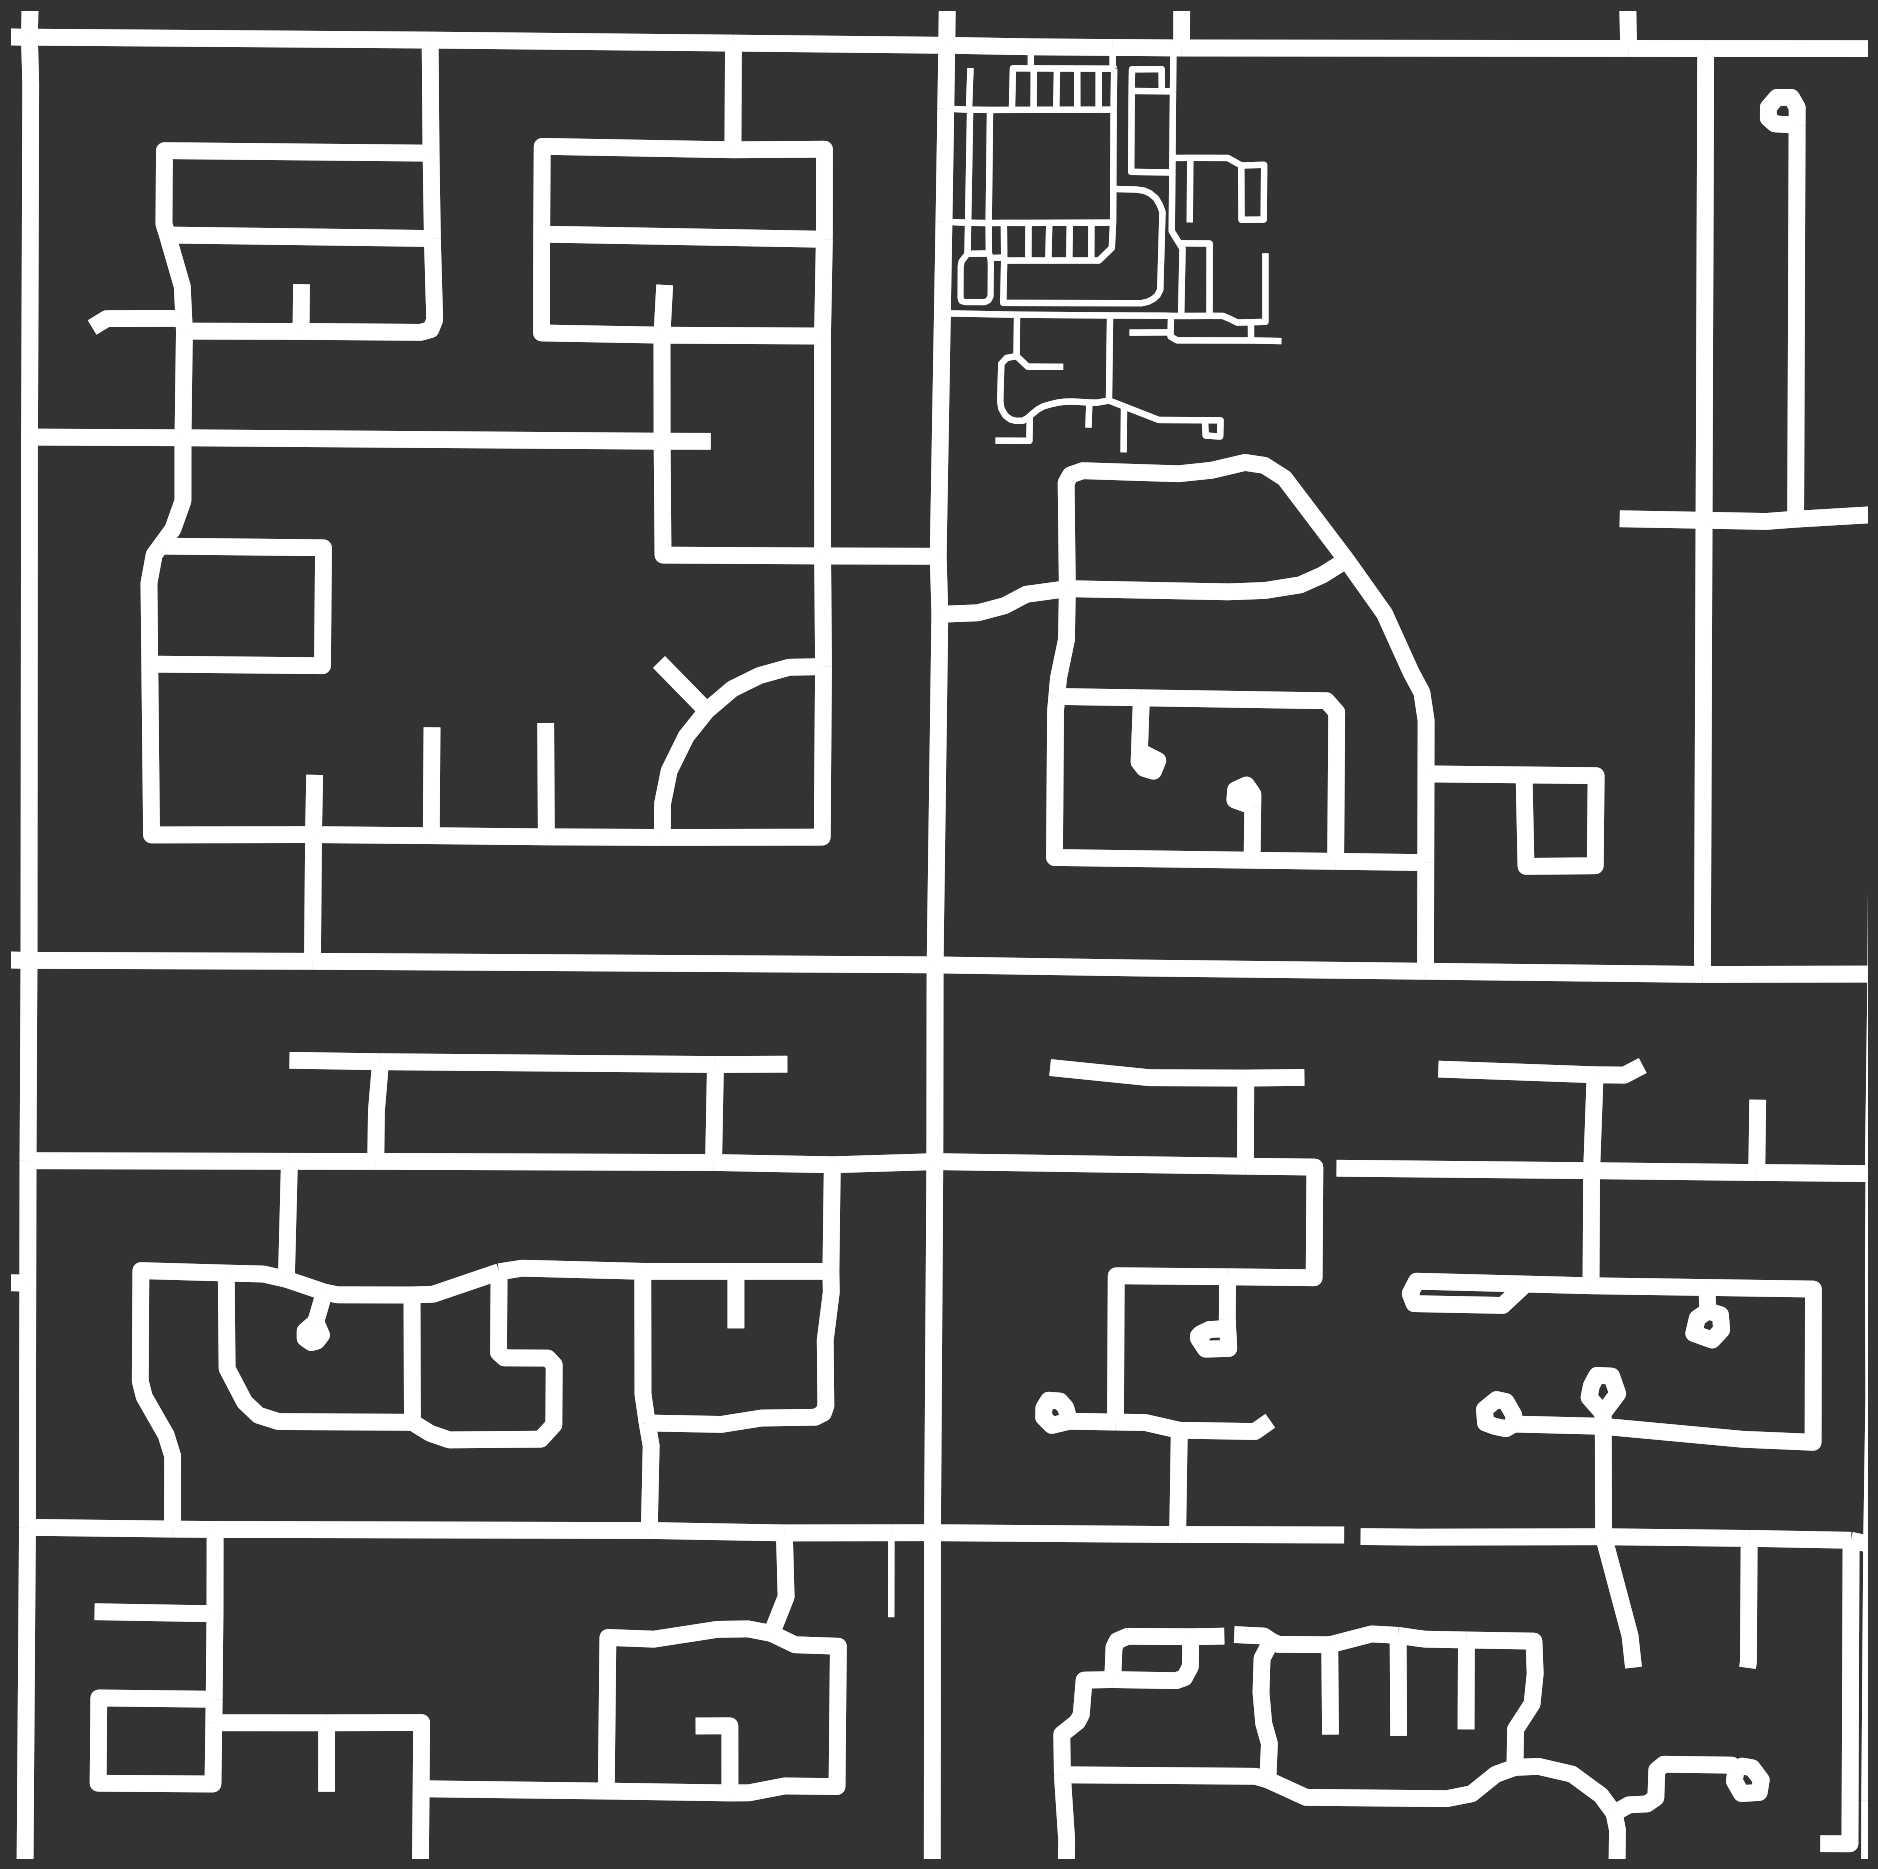
Richmond
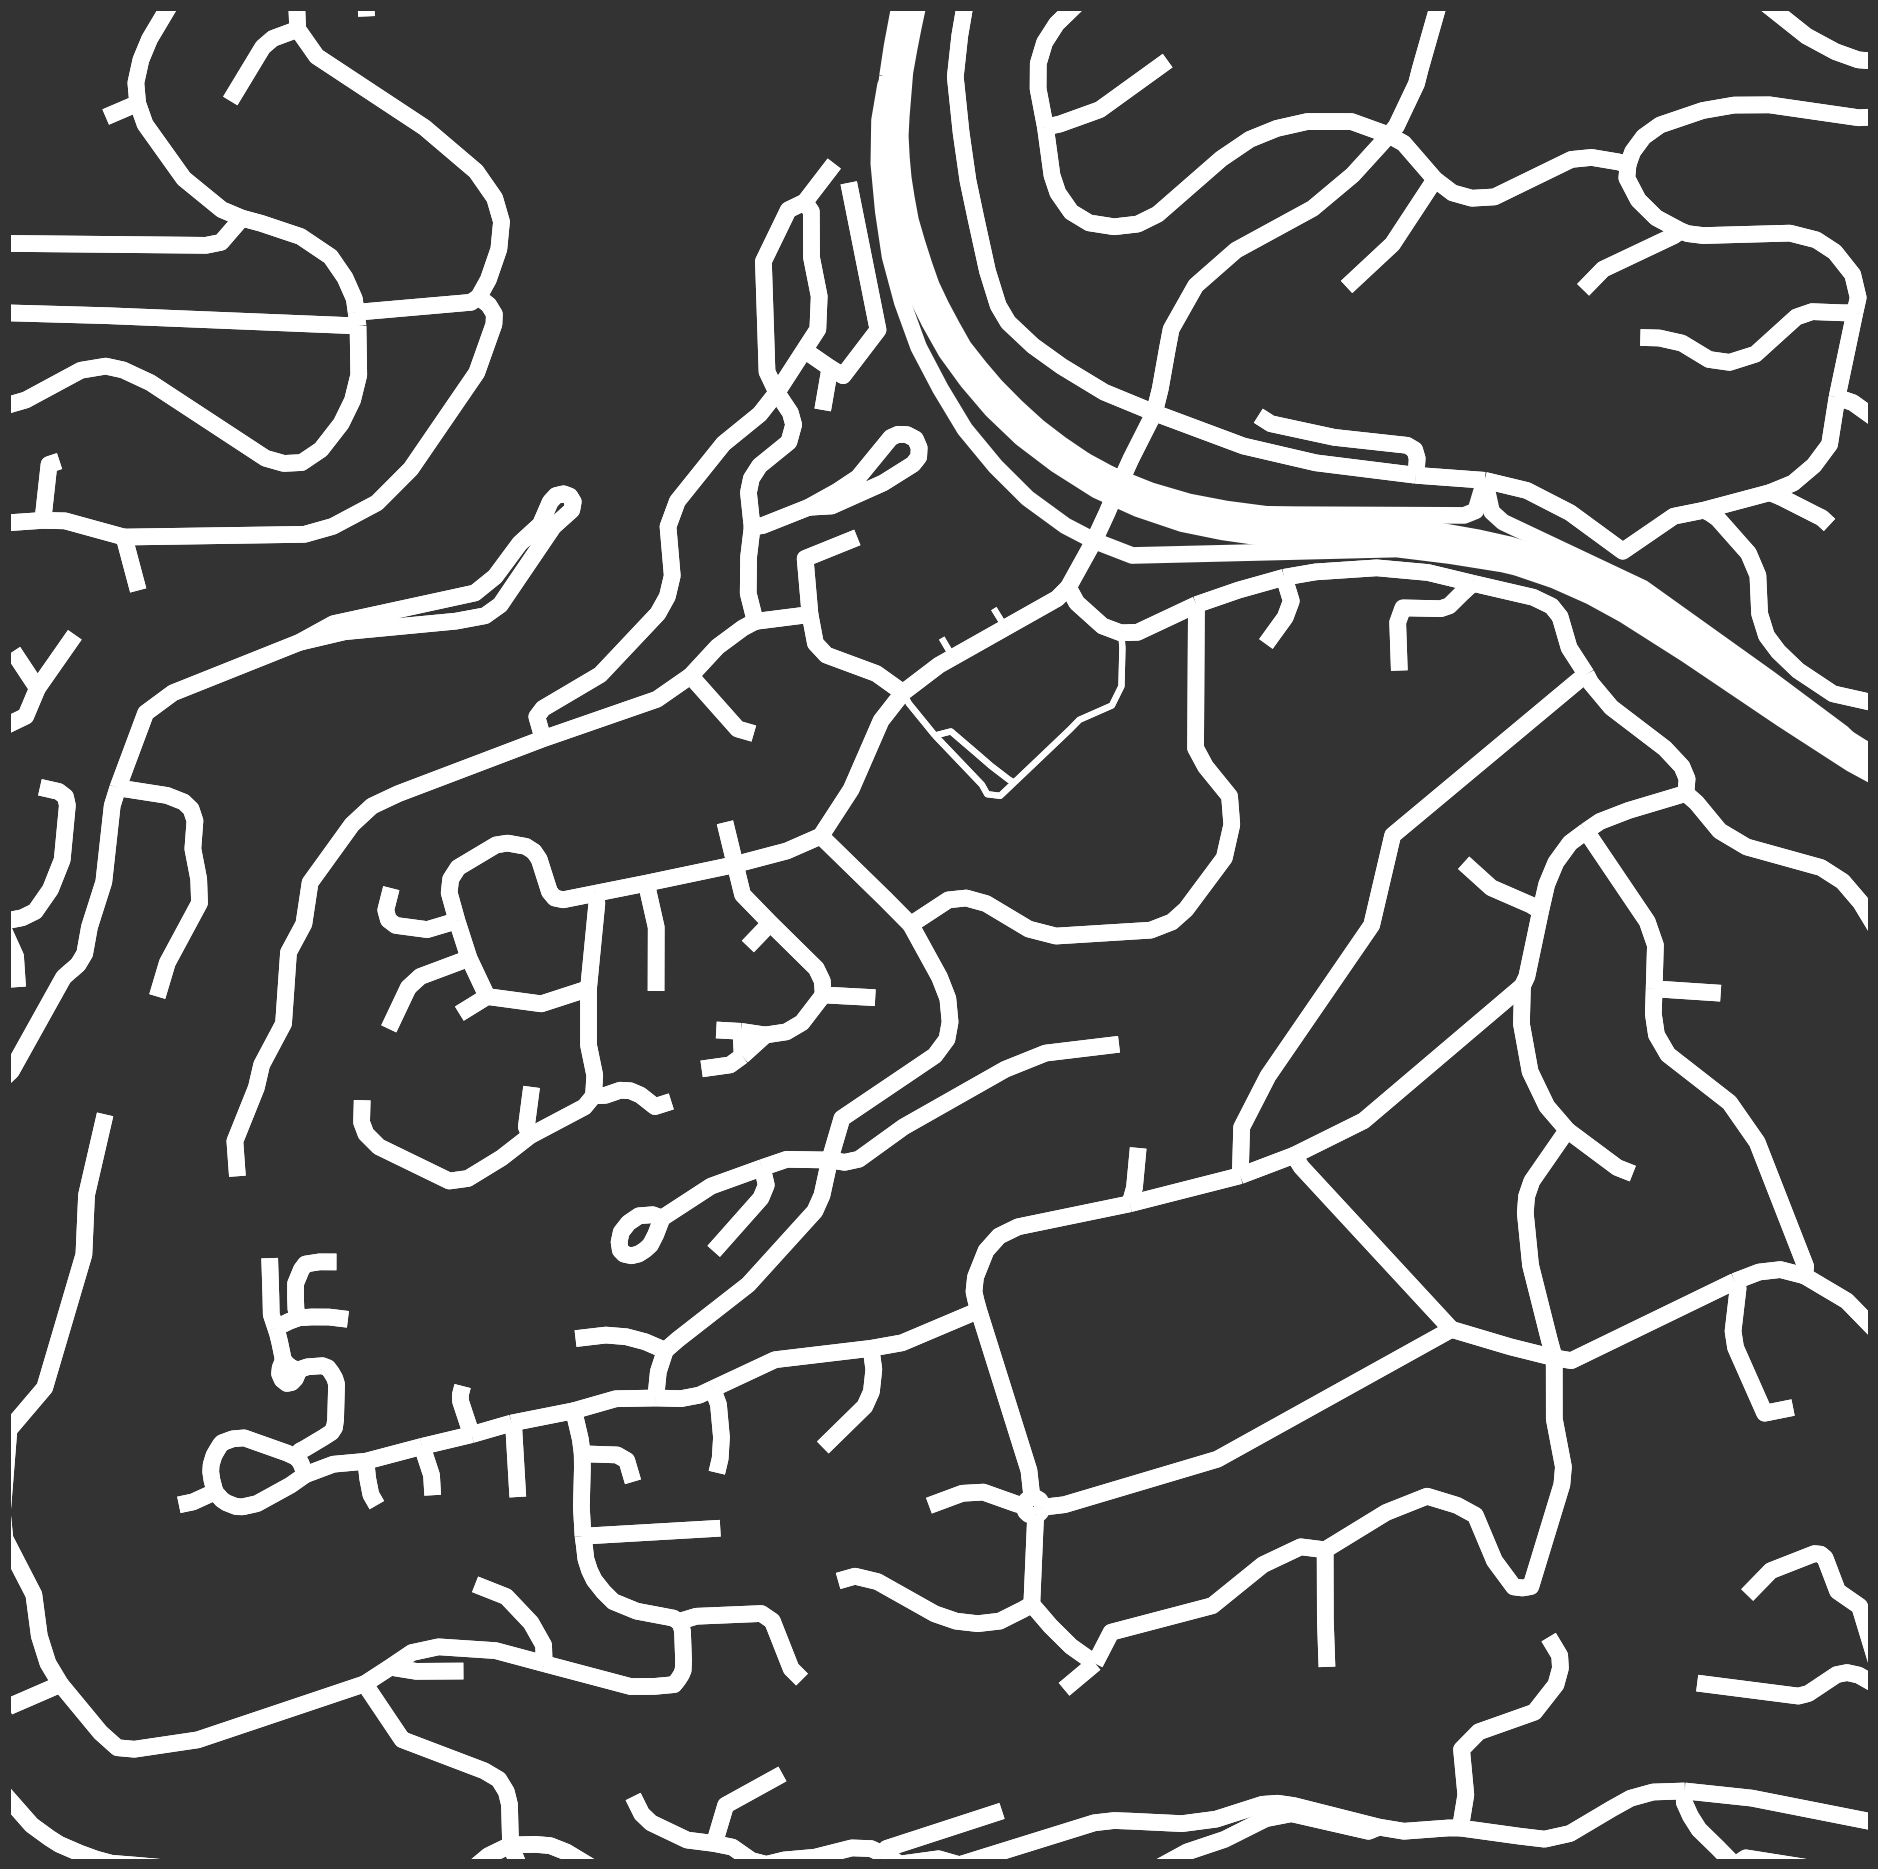
West Vancouver
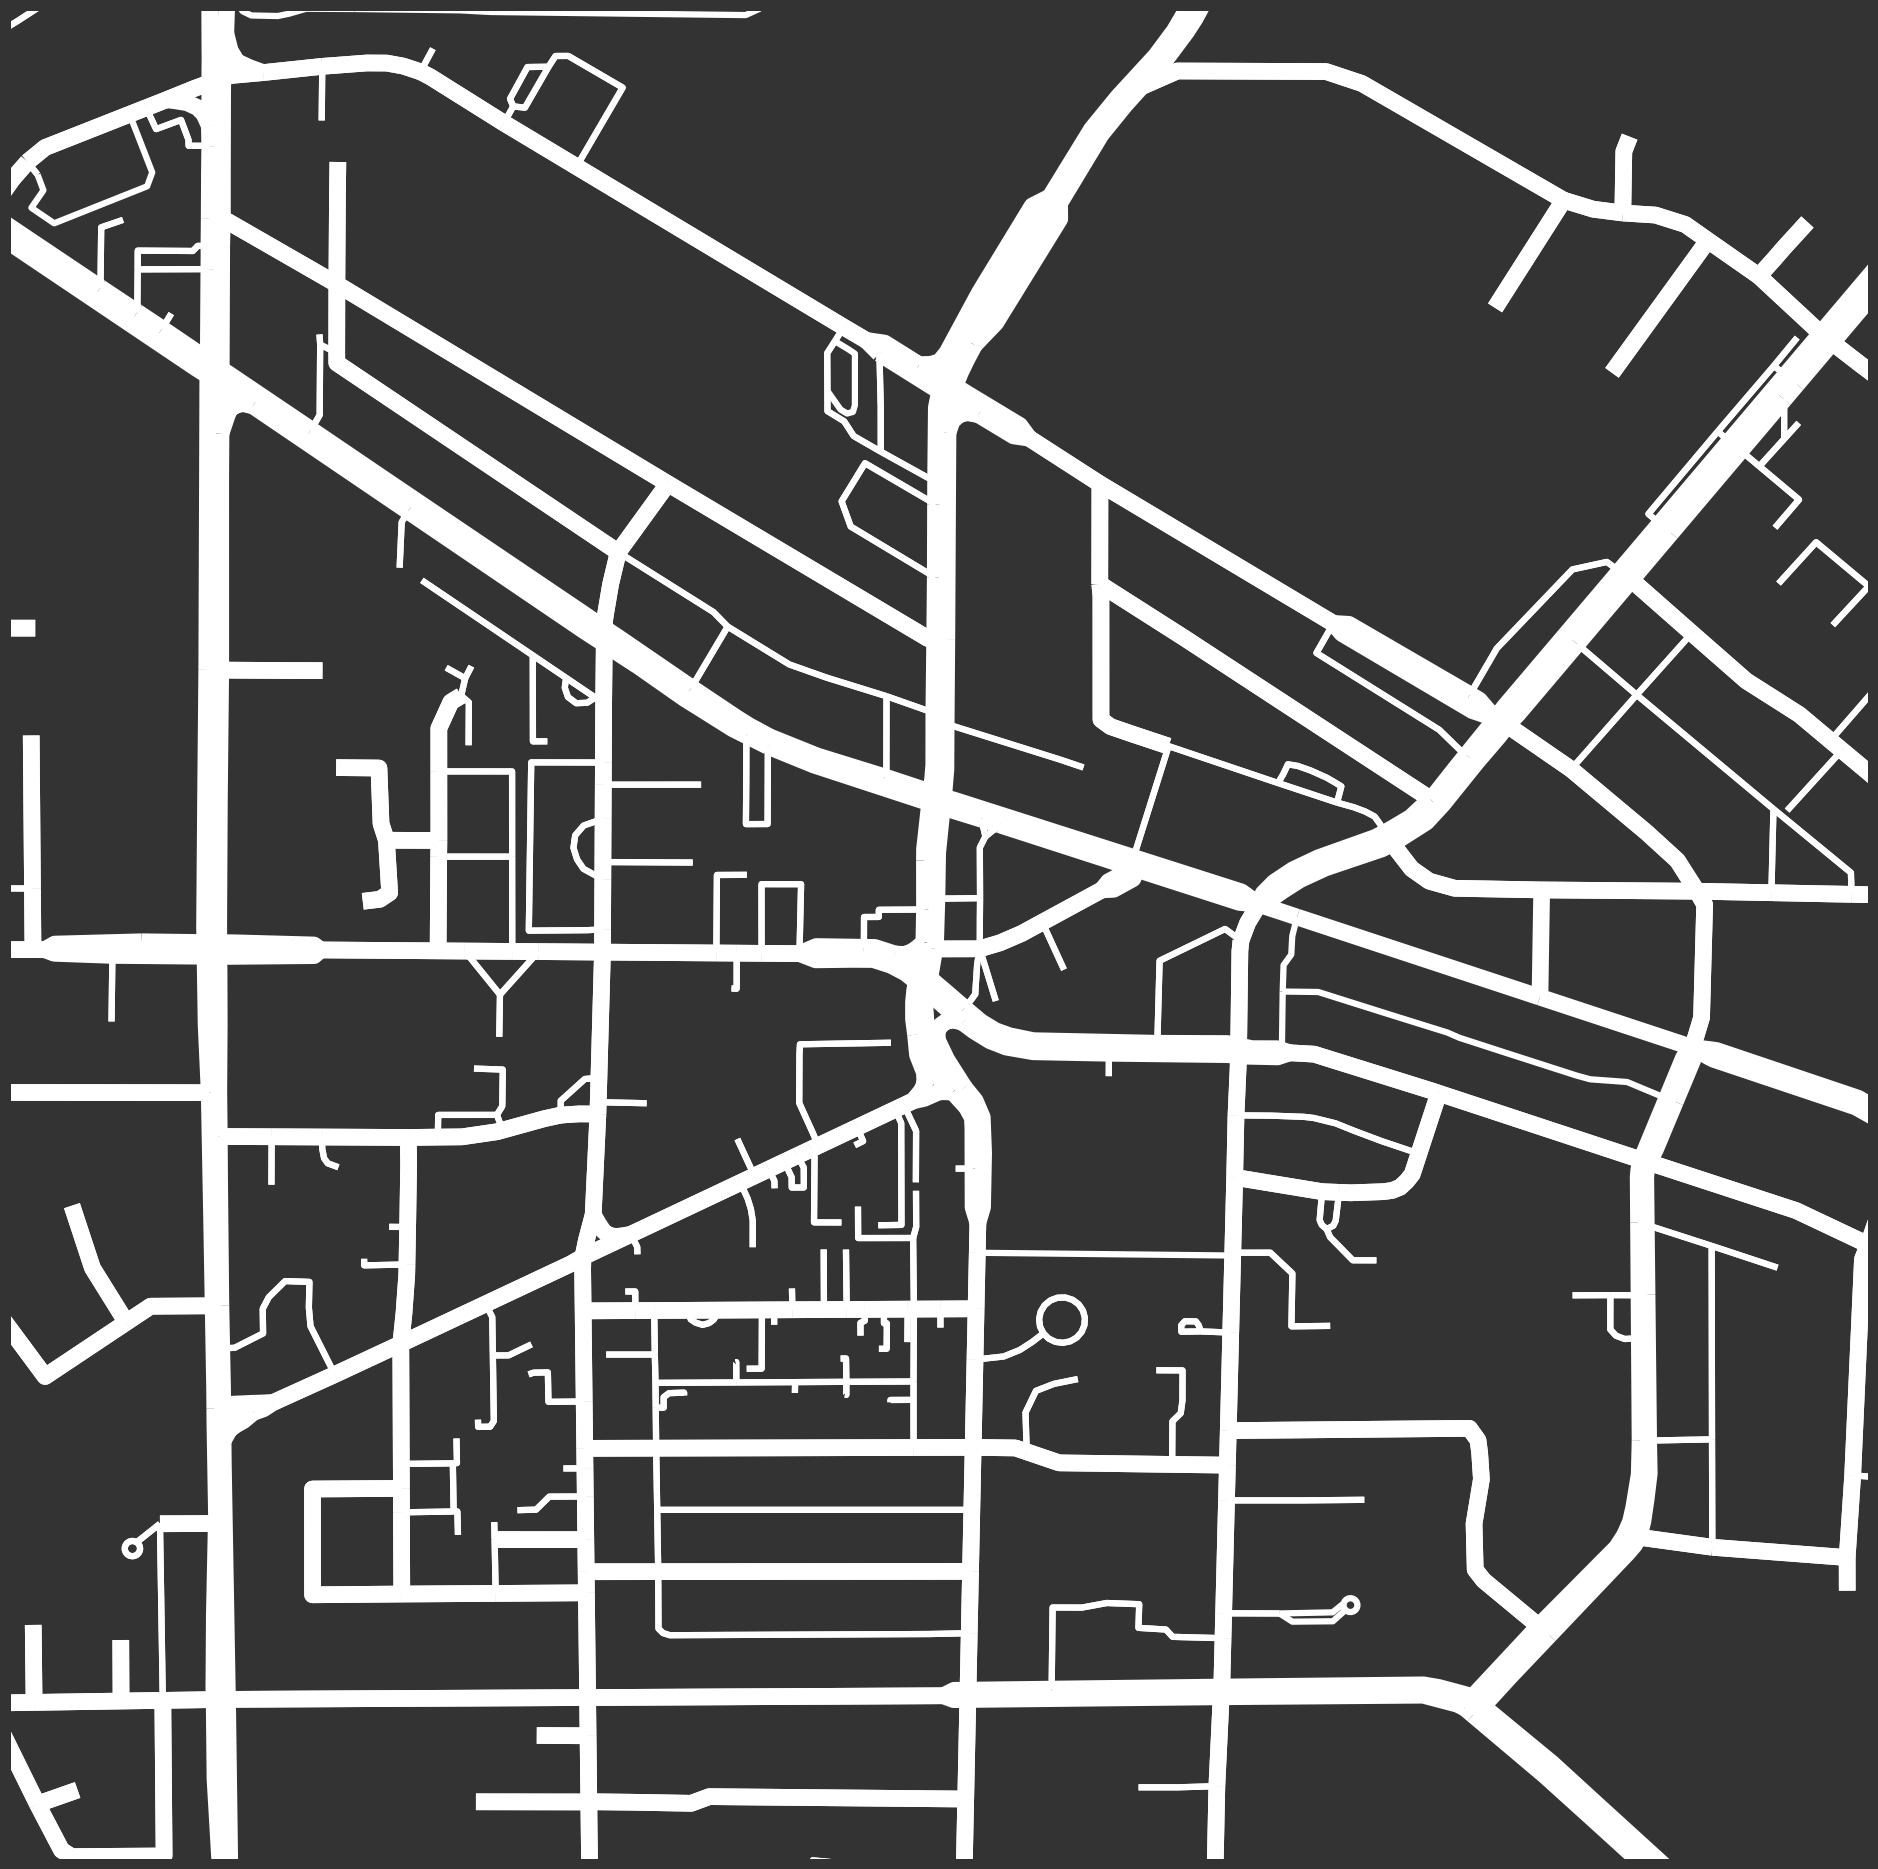
Langley
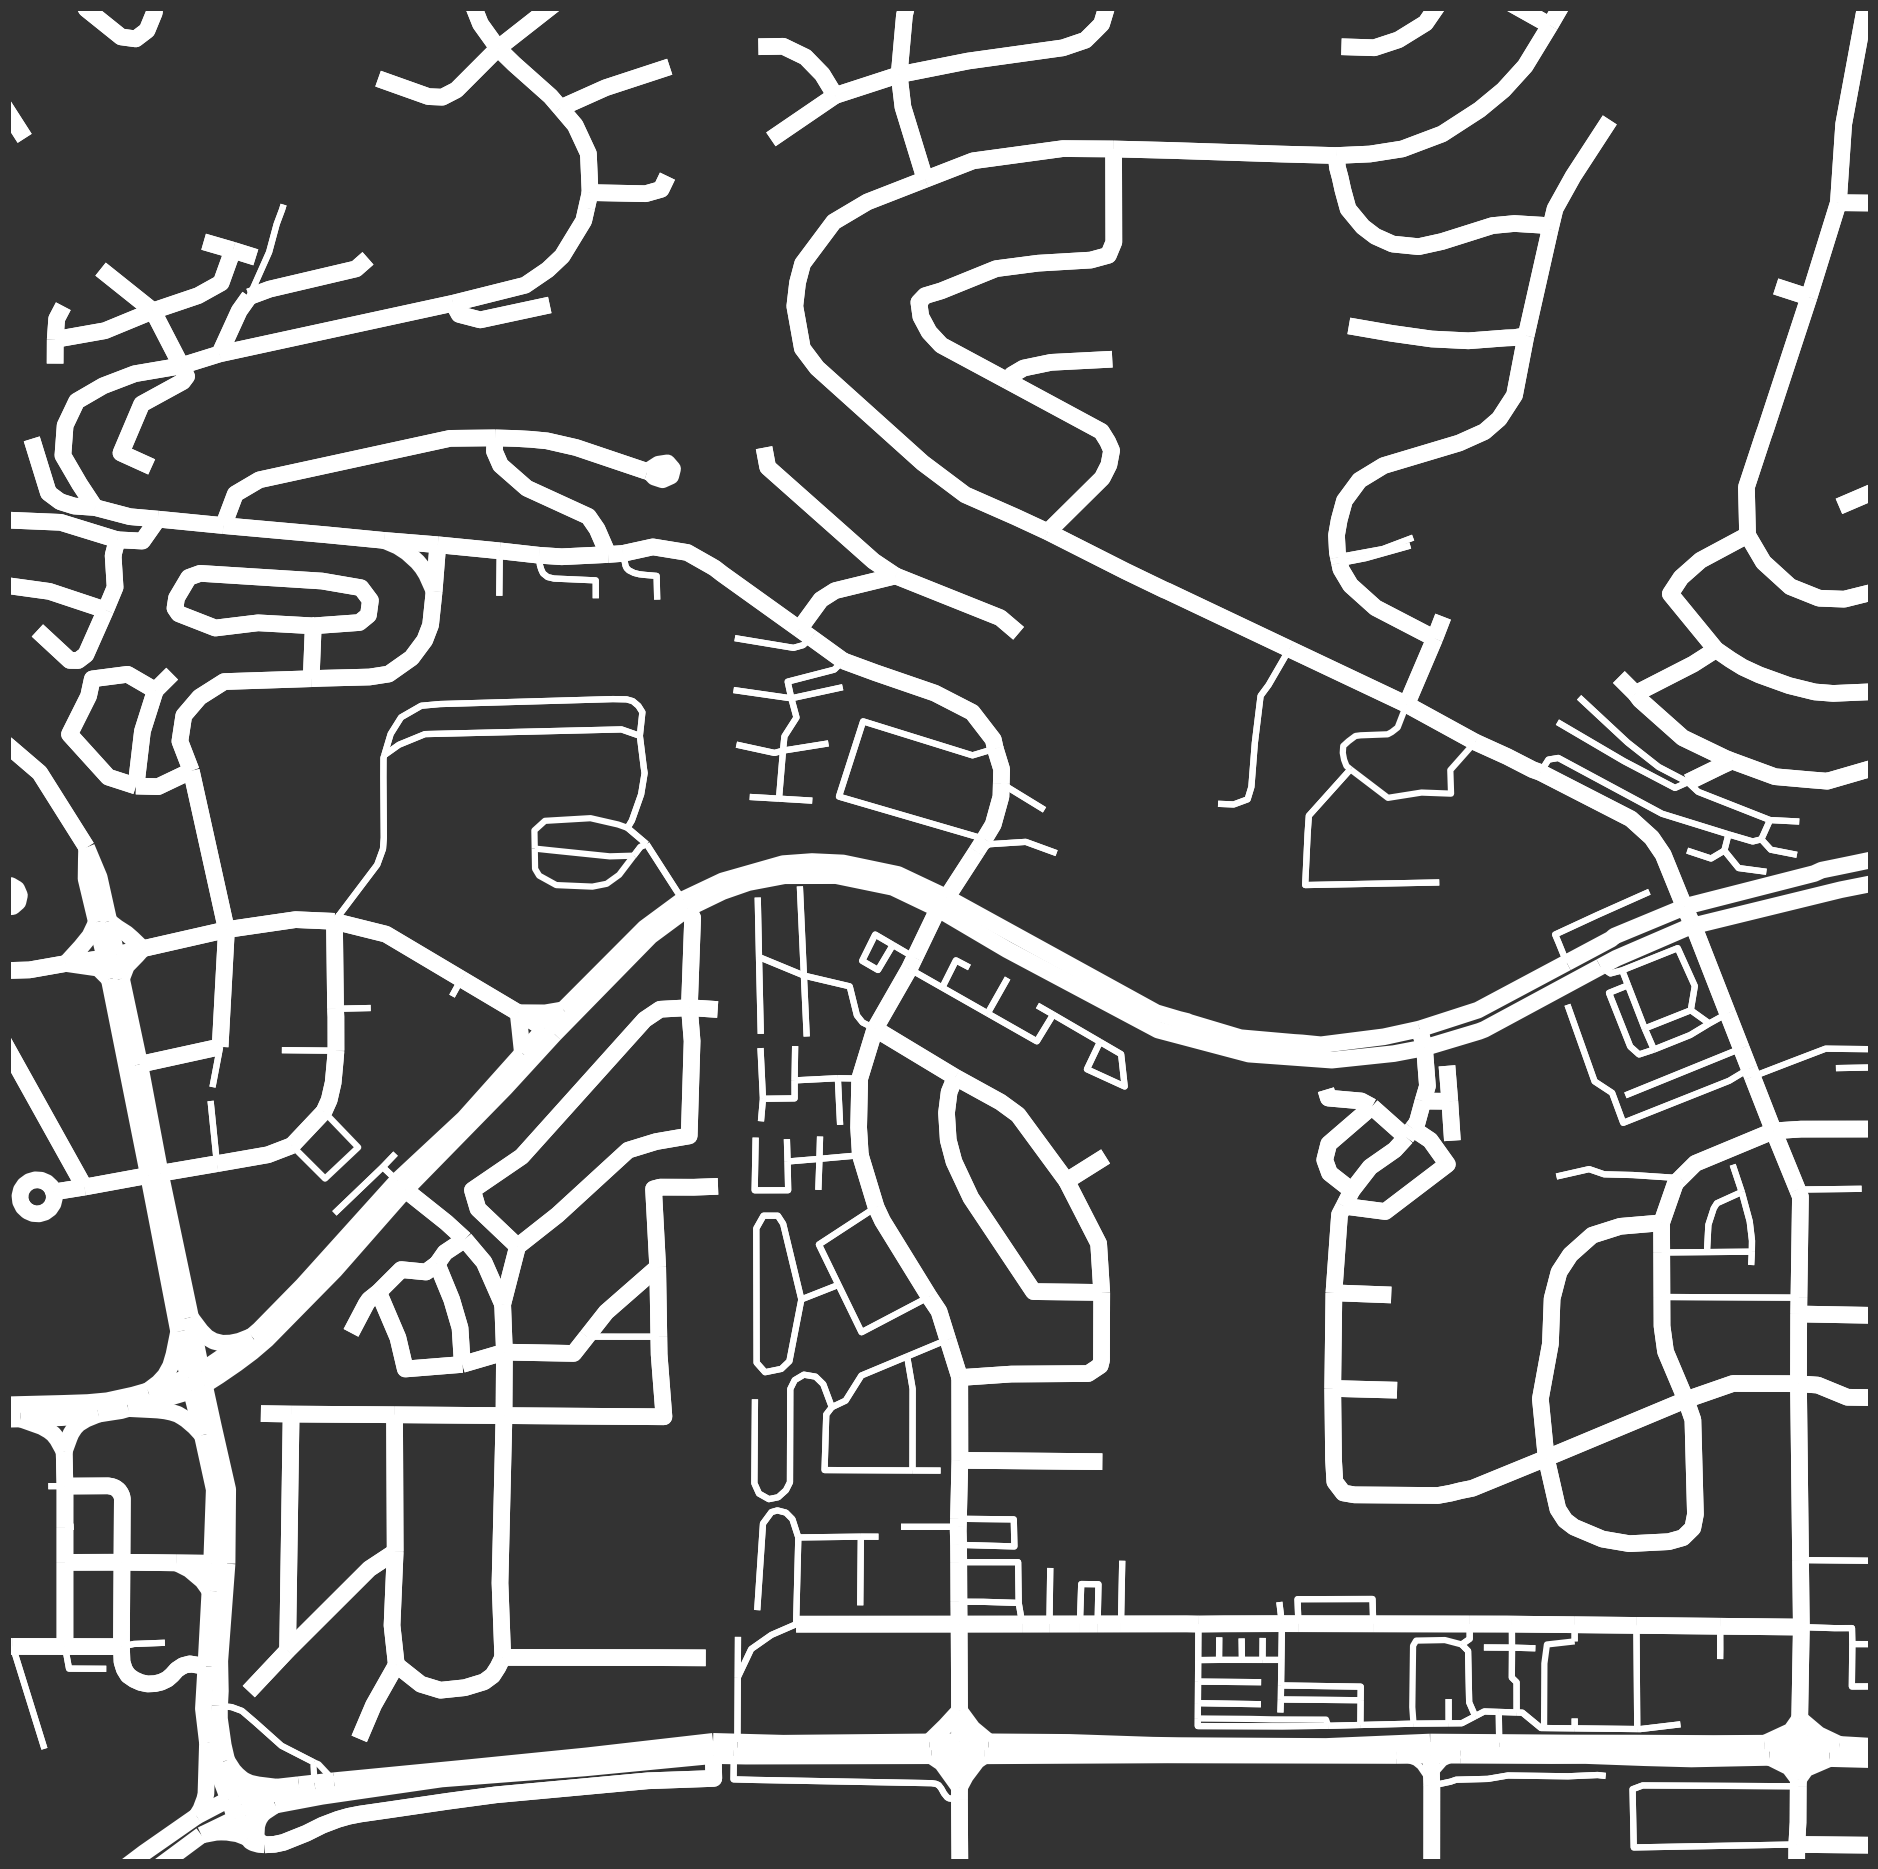
Port Moody
If you want to make your own, just grab the lightly adapted code below. Yes, it is that easy.
Code to generate the images
# jane_jacobs.py
import geojson
import osmnx as ox
from IPython.display import Image
ox.config(log_file=True, log_console=True, use_cache=True)

file="data/van_cities.geojson"
img_folder = 'images'
extension = 'png'
size = 350
dpi = 90

cities=geojson.loads(open(file,"r").read())
for city in cities.features:
    place = city.properties['name']
    point = (city.geometry.coordinates[1],city.geometry.coordinates[0])
    fig, ax = ox.plot_figure_ground(point=point, filename=place)
    Image('{}/{}.{}'.format(img_folder, place, extension), height=size, width=size)
Reuse
Citation
@misc{jane-jacobs-vancouver.2017,
  author = {{von Bergmann}, Jens},
  title = {Jane {Jacobs’} {Vancouver}},
  date = {2017-01-25},
  url = {https://doodles.mountainmath.ca/posts/2017-01-25-jane-jacobs-vancouver/},
  langid = {en}
}
