Finally the first batch of 2016 census data has arrived on Tuesday AM and CensusMapper was updated with the new census numbers by mid-morning.
Dissemination Block data was a little harder to find, but with the help of some friendly StatCan people I finally managed to locate the data and add that too this afternoon.
Time for writing up some observations. I am hoping to find time to do this regularly as more data gets released.
The first batch of data only comes with three variables: Population, dwellings and households. And two more, a data quality flag indicating areas with incomplete enumeration and the area of each geographic region. Area itself is more tricky than it seems at first, one has to make decisions what to count. Lakes? Rivers? National or Regional Parks?
Next to these variables, we also got the corresponding 2011 population for all geographic regions at the CT/CSD level and above to aid the comparison, but these were not available at the DA or DB level.
The variables seem straight forward, but nothing is simple when it comes to big projects like a census, so it might we worthwhile to spend a little bit of time looking at them. ## Population 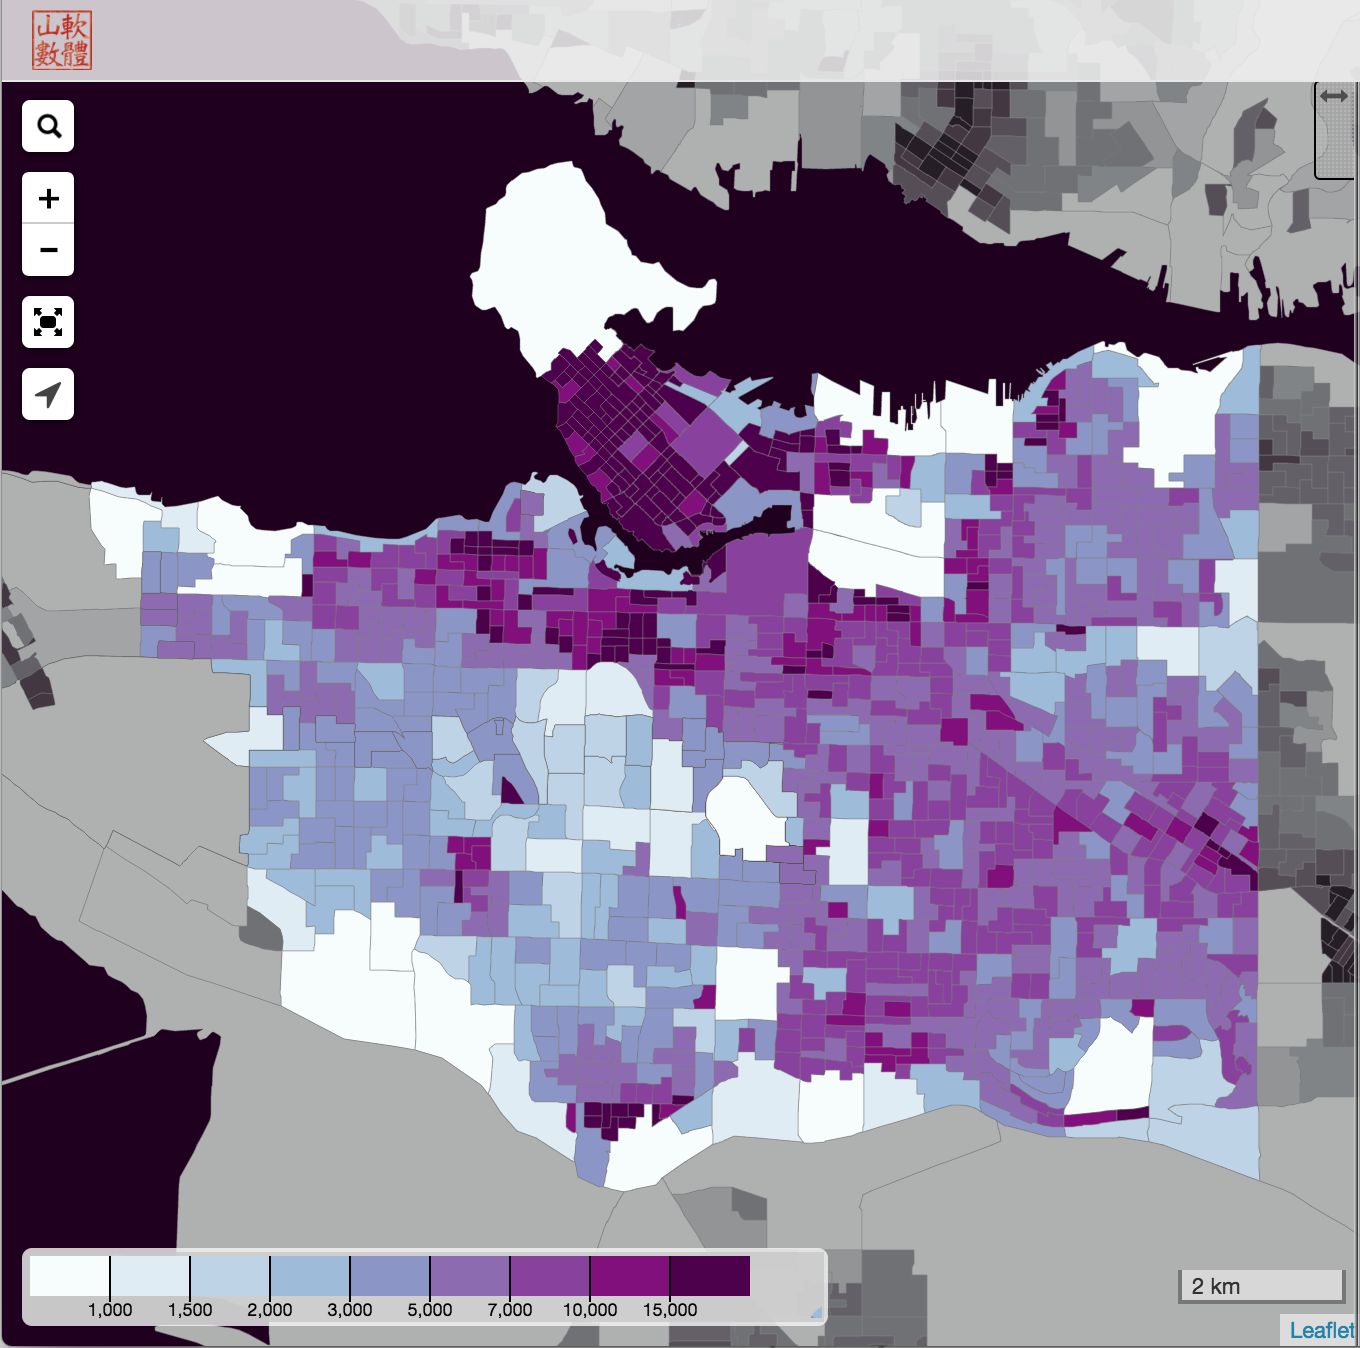 The quintessential census variable counts the number of people in each census region. With the exception of people that have a primary residence elsewhere in Canada or abroad. There are several reasons for this, the simples one is to avoid the double-counting of people.
Dwellings
“Dwellings” is short for “private dwellings”, this does not count collective dwellings like prisons, student dorms, hospitals or nursery homes or even some coops. This can lead to interesting situation where there are zero private dwellings (and zero households) but non-zero population. Metro Vancouver has 45 such dissemination blocks. But these people are only counted if they don’t have a primary residence somewhere else, which often is the case for students in dorms. But not for all students, as the Dissemination Block on UBC campus that’s wedged between NW Marine, University, Lower Mall and Agronomy shows. It has zero dwellings, zero households, but a population of 890 people.
Households
The “dwellings, occupied by usual residents” is also called “households”. It refers to a private dwelling that is used as a primary residence, and the inhabitants make up a household. If inhabitants of a dwelling only live there temporarily and/or has a primary residence somewhere else in Canada or abroad, then they are not counted in the population nor the household counts.
Unoccupied Dwellings
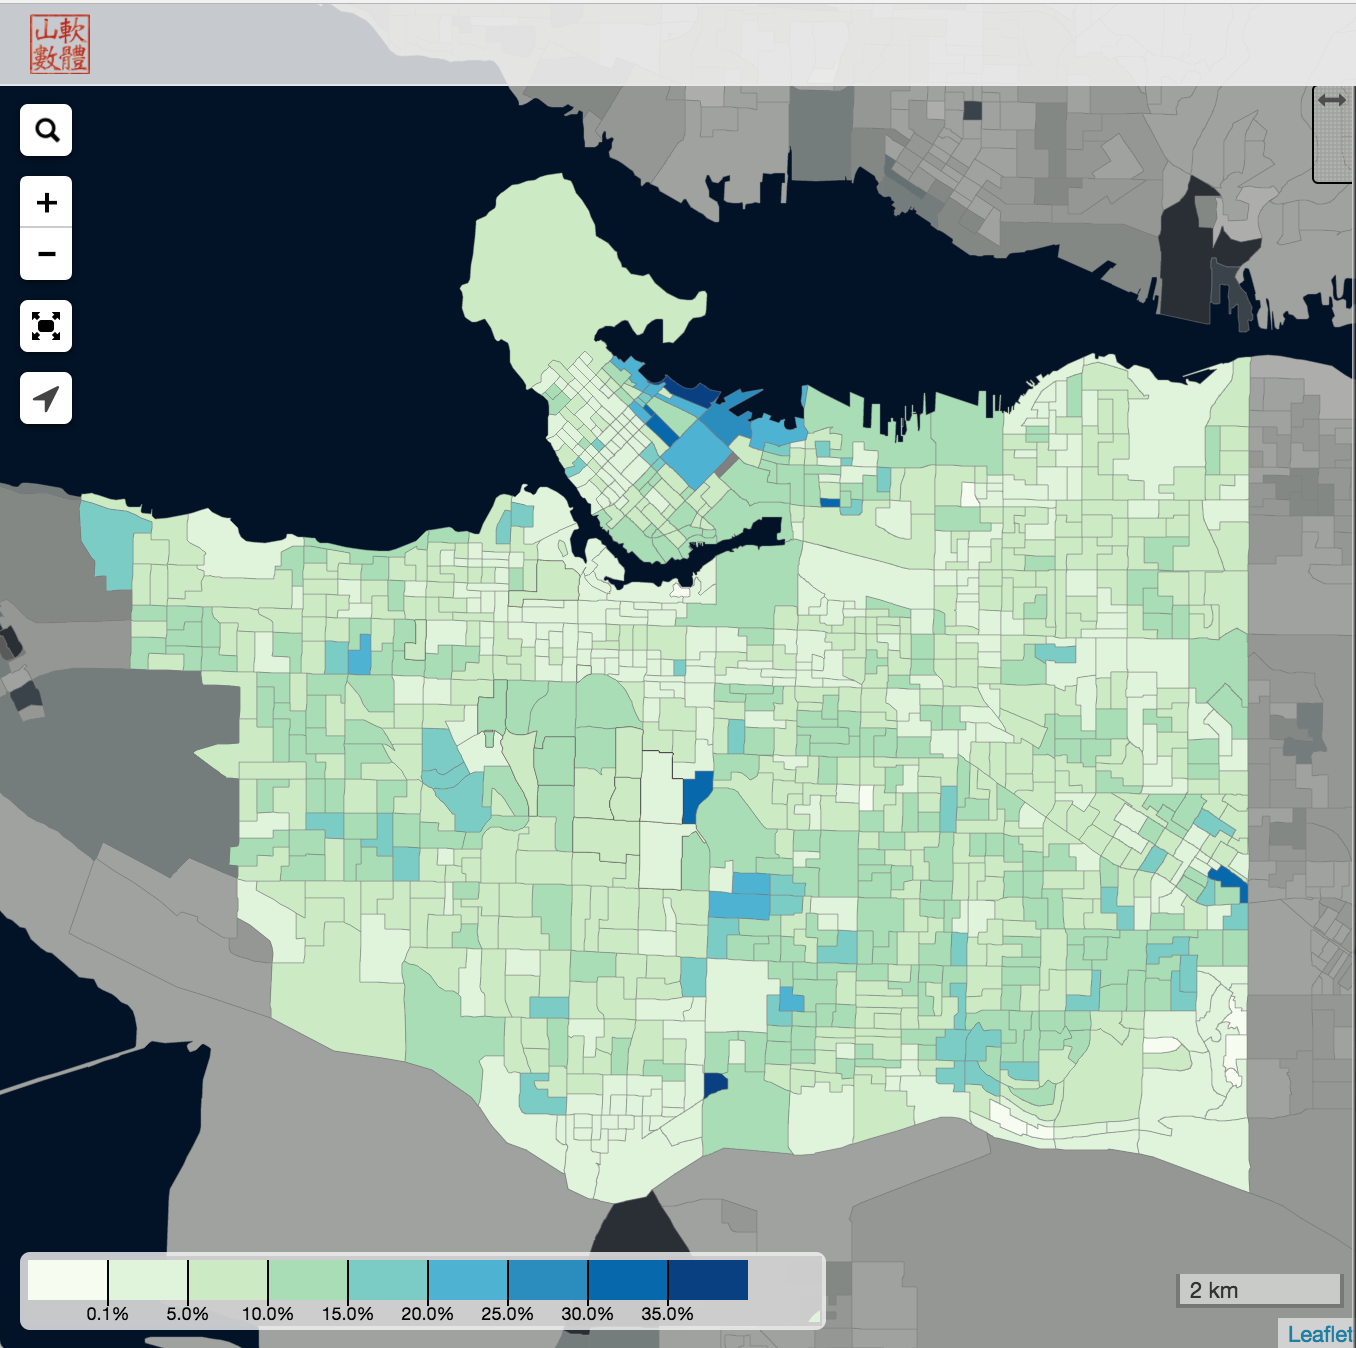 The difference between dwellings and households is “dwellings, not occupied by usual residents”. Essentially, that’s dwellings that are not used as primary residences. It’s a fun variable to look at, and it is available at the very fine Census Block level. In some cases, a Census Block can contain just one apartment building.
Mixing Variables
The fun starts when we mix these variables. And compare them to the previous censuses. And there are lots of ways to do that, here are a few:
Population Change
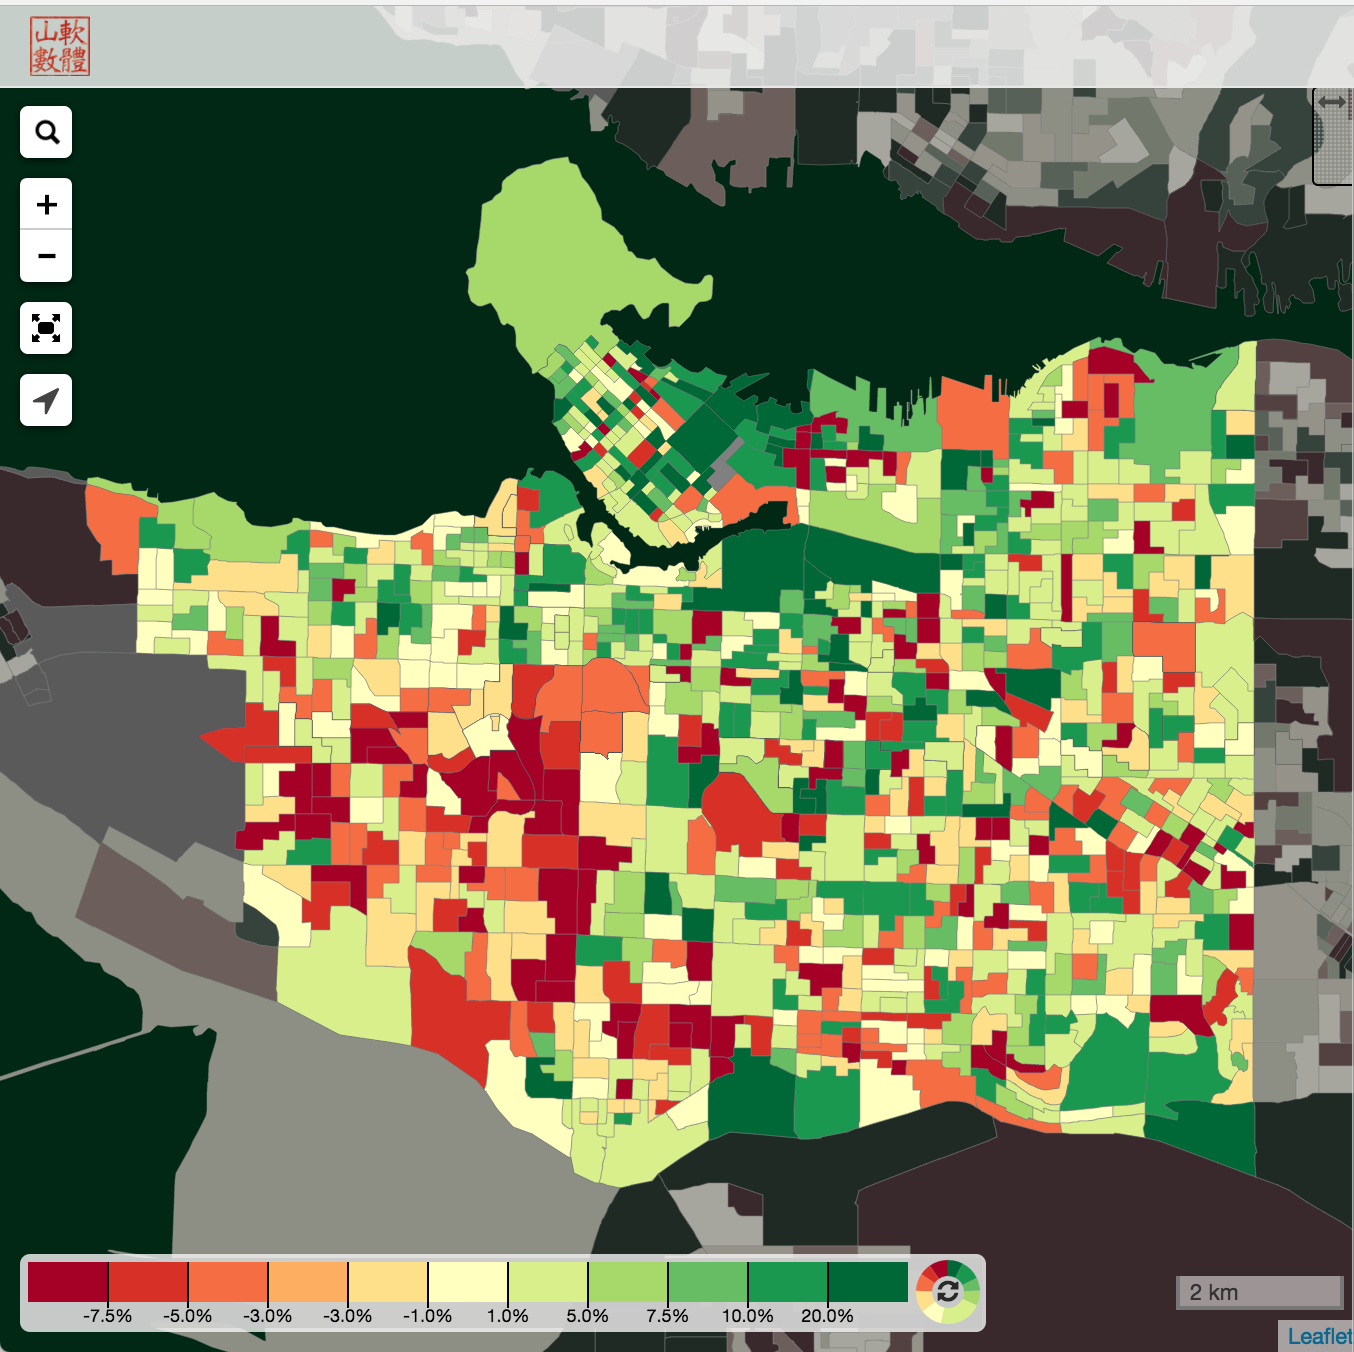 The most immediate variable to look at is population change. We have complete Canada-wide data at the CT level or above, but if we are really interested we can also view this data for DAs and DBs that stayed the same across the census years. The issue with doing that is that some regions will have not data, and one has to be very careful not to read too much into an incomplete dataset. Which is why I usually don’t like giving out maps that contain incomplete data like this. But this is great for diving into specific regions to get more information.
Dwelling Change
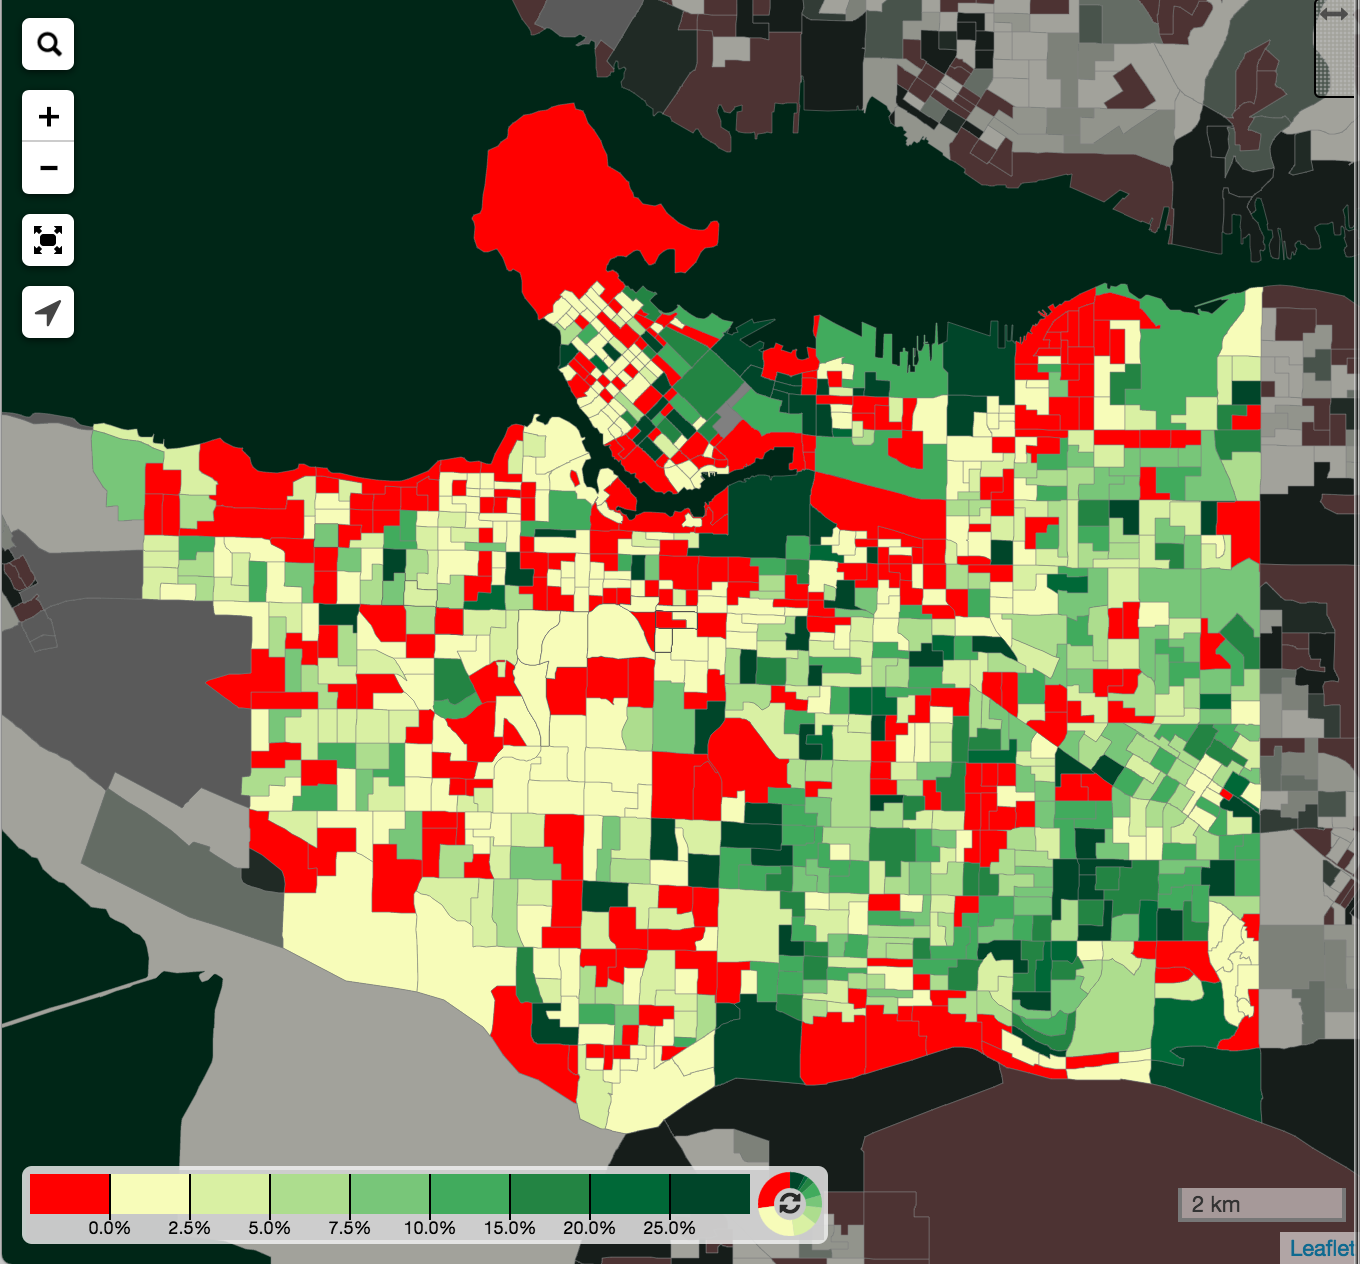 This is a great way to see where more dwellings got built. This only measures net changes, so even if a region shows zero dwelling increase, there could have been quite a bit of construction in the area. In particular, if houses with secondary suites get torn down and replaced by houses without secondary suites, it will show up as a decline in the number of dwelling units.
Non-primary residence dwellings
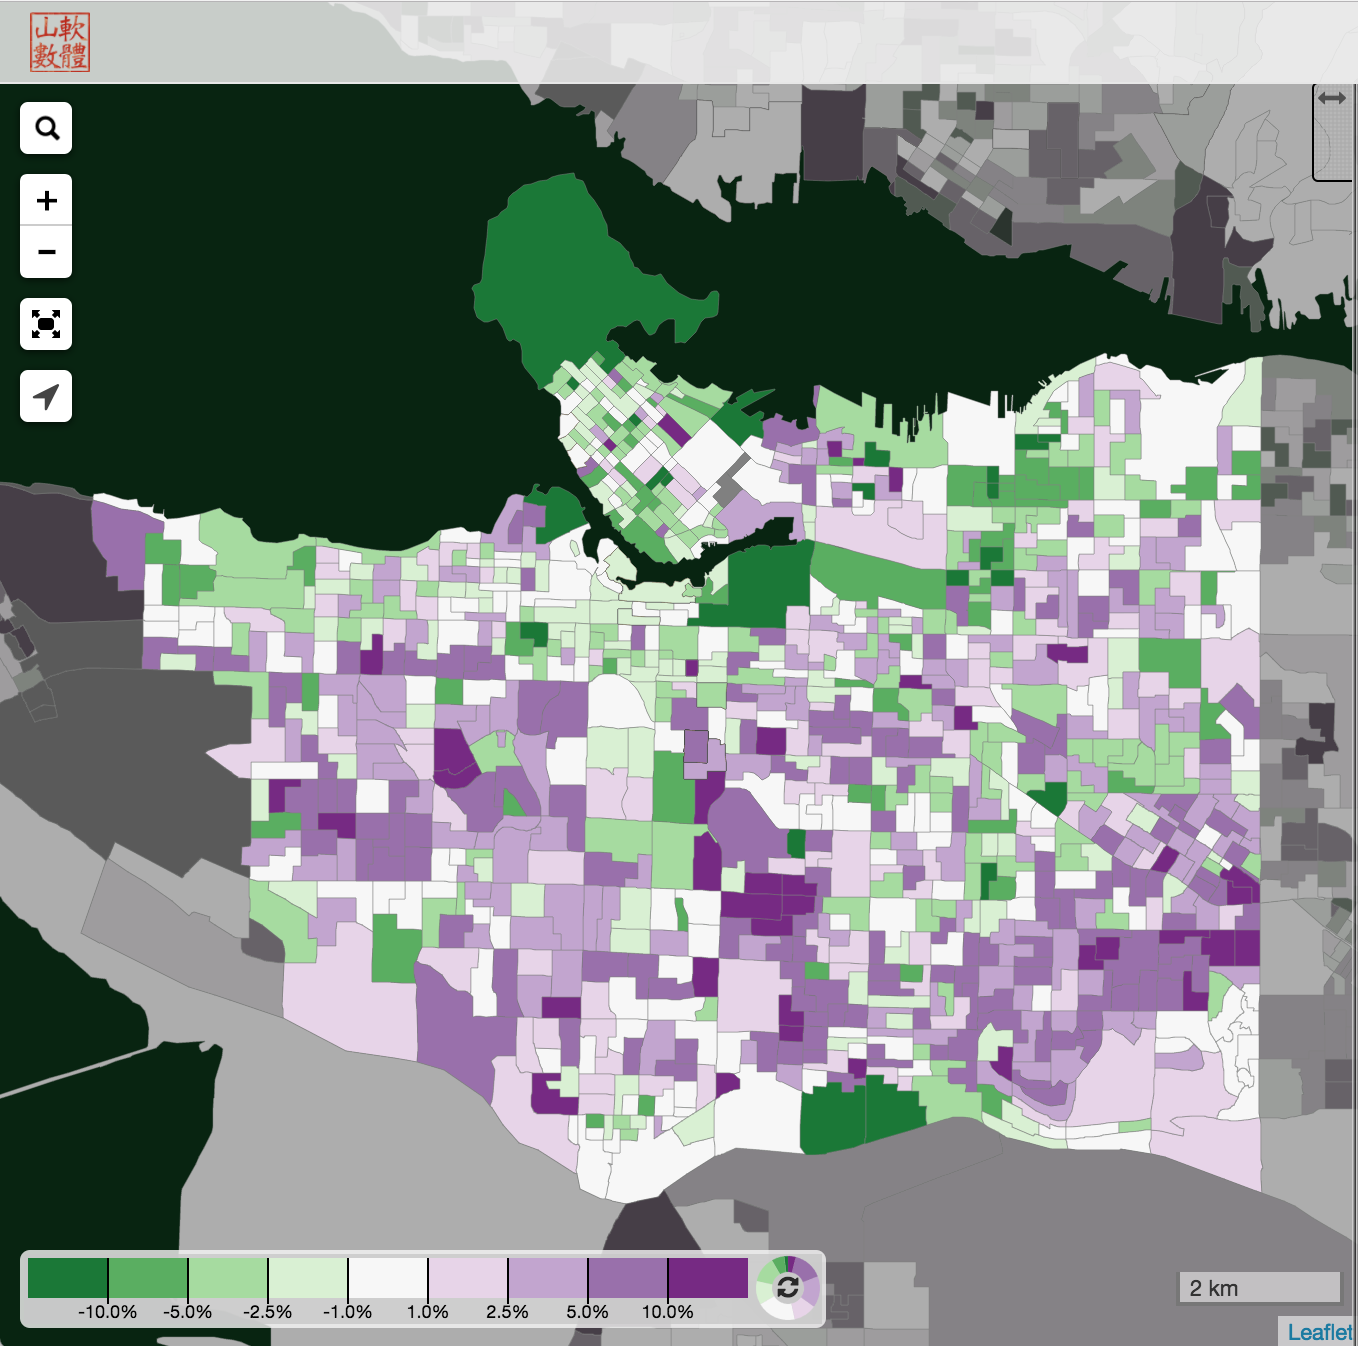 More formally, these are “dwellings not occupied by usual residents”, it’s the difference between dwellings and households and the object of continued scrutiny in Vancouver. And a good portion of these are the target of the upcoming empty home tax to either monetize non-primary resident homes or nudge them into the rental market.
Household size change
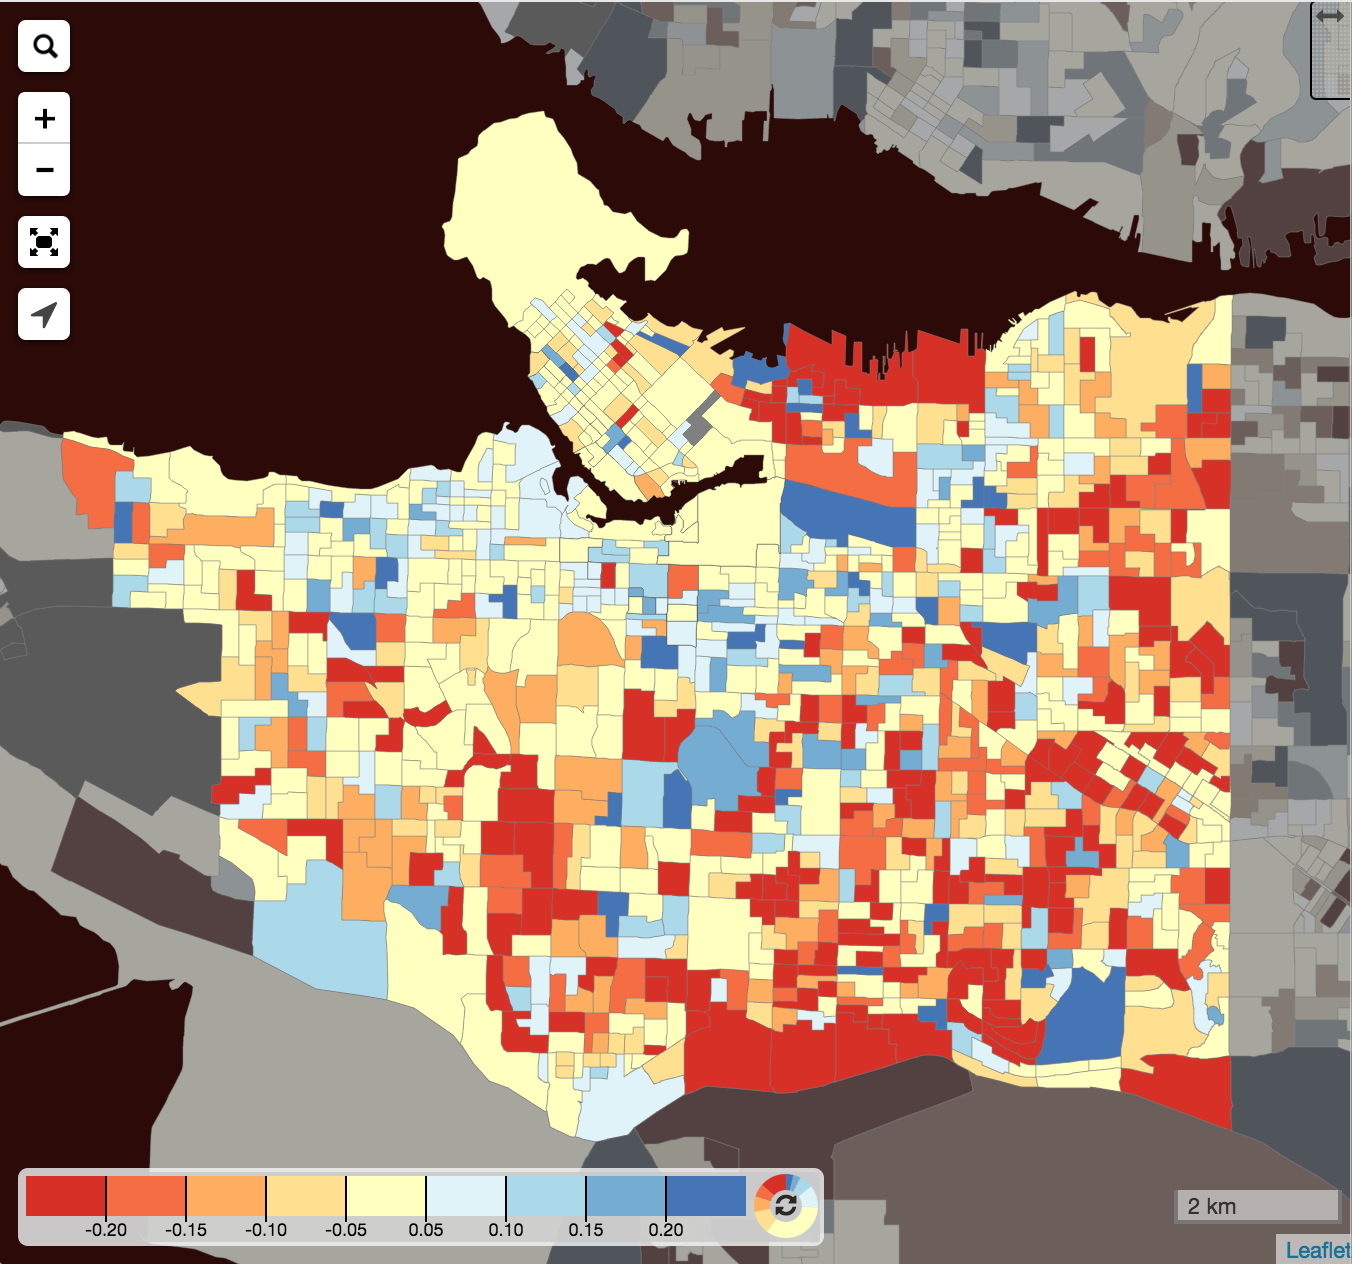 A big part of population change is the change in household size. Canada wide the trend to smaller households is continuing. That means that if the number of dwellings and the rate of unoccupied dwellings in a region remain unchanged, then the population in the area will decline if it follows the national trend to smaller household size.
Population Change Null Sum Game
From looking at CensusMapper, the variable that got by far the most attention nationally in the past three days is Population Change. It’s great to see where population grew or declined. But almost immediately people wonder why population change was different in one region compared to another.
The first step to this is the Population Null Sum Game. You need the
- Dwelling Change
- Change in Unoccupied Dwellings
- Change in Household size
to play. The game is then to express Population Change in terms of those three, and thus “explaining” population change in terms of these variables. There are of course other ways to split up the Population Change variable, but I find this a useful one.
Nathaniel Lauster kicked the game off with this great post. Let’s follow up his inter-municipal level analysis with some intra-municipal numbers.
We will focus on the City of Vancouver only. People are welcome to use CensusMapper to repeat this for whatever region they are interested in. Vancouver has the nice advantage that at the dissemination area geography only on change was made. A 2011 downtown DA got split into two for 2016. That makes it very easy to carry this out at the DA level.
Components of Population Change
First we refine our variables a little bit it seems more interesting to use the rate of unoccupied builings as a variable, rather than the number of these. We want to express population change Δpop as a linear combination of
- Dwelling change
Δdw - Change in ratio of unoccupied dwellings
Δur - Change in household size
Δhs
More formally:
Δpop = hs₁₁ * (1-ur₁₁) * Δdw - hs₁₁ * dw₁₆ * Δur + hh₁₆ * Δhswhere hs₁₁=pop₁₁/hh₁₁ is the household size in 2011 as computed by dividing the population by the number of households, ur₁₁ is the rate of unoccupied dwellings in 2011, dw₁₆ is the number of dwellings in 2016 and hh₁₆ is the number of households in 2016.
It is simple algebra to check that the identity holds.
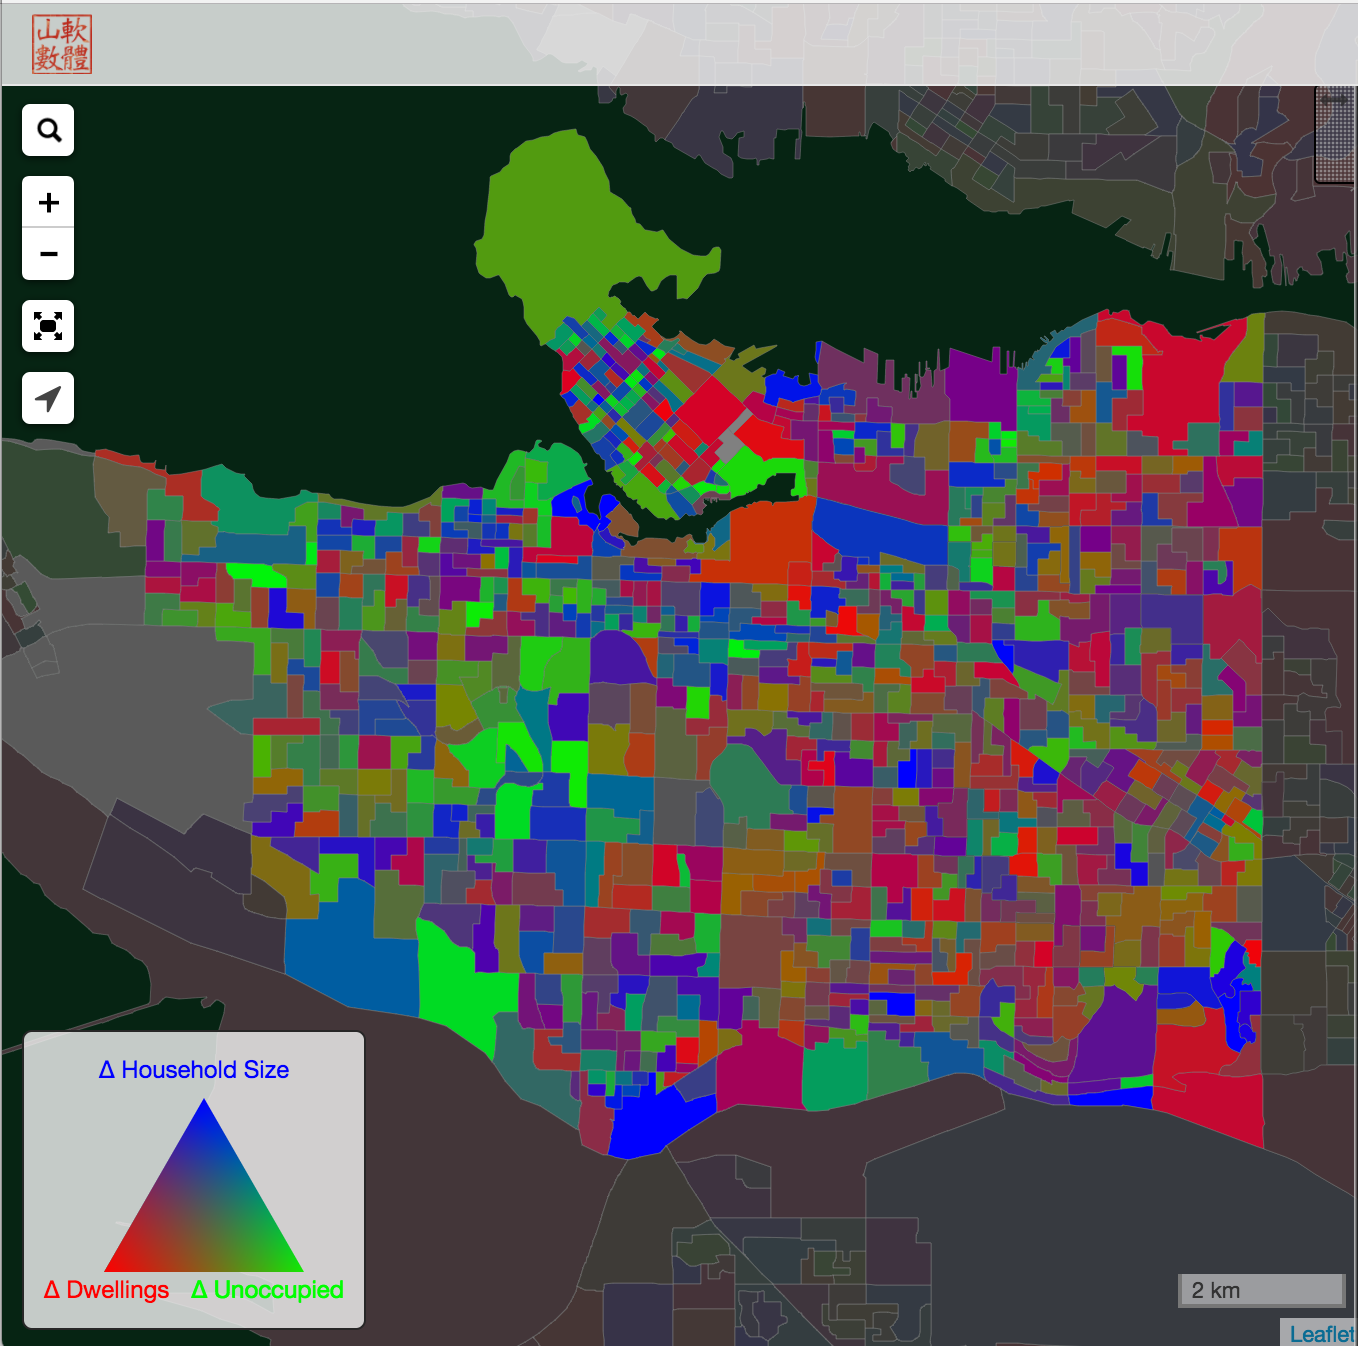 The first term gives the contribution to population growth due to the growth in dwellings, assuming that household size and the rate of unoccupied dwellings are unchanged from 2011.
The second term give the population growth due to the change in the rate of unoccupied dwellings and the third term gives the population growth due to a change in household size.
Great, all that’s left to do is to type the formula into CensusMapper and graph the relative contribution of each of these terms. To make this work we will have to make due with using only the magnitude of each term, but we can visualize the sign in the bar graph widget when we hover over an area.
This makes it very easy to compare different areas and see how the different components contribute to the change in population in each area.
Reuse
Citation
@misc{2016-census-data.2017,
  author = {{von Bergmann}, Jens},
  title = {2016 {Census} {Data} - {Part} 1},
  date = {2017-02-10},
  url = {https://doodles.mountainmath.ca/posts/2017-02-10-2016-census-data/},
  langid = {en}
}
