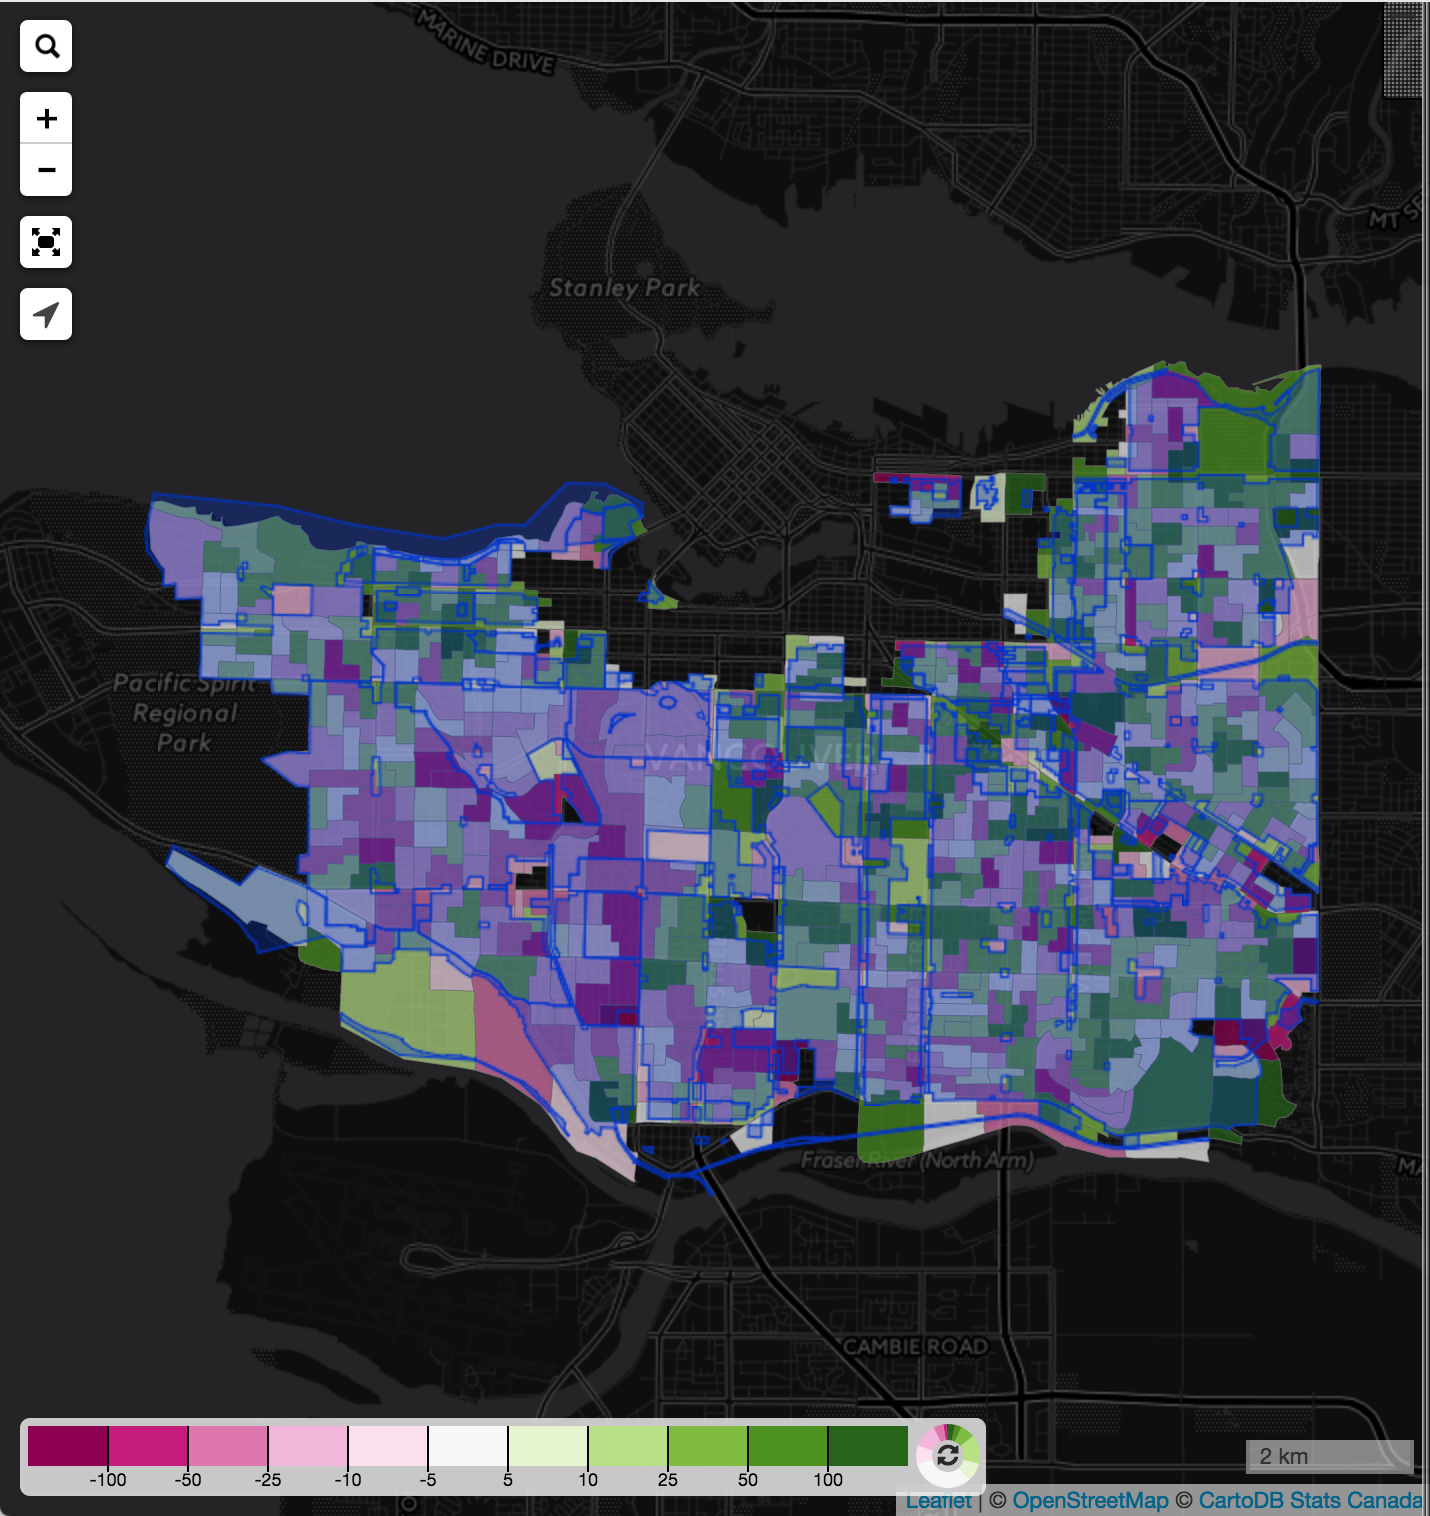
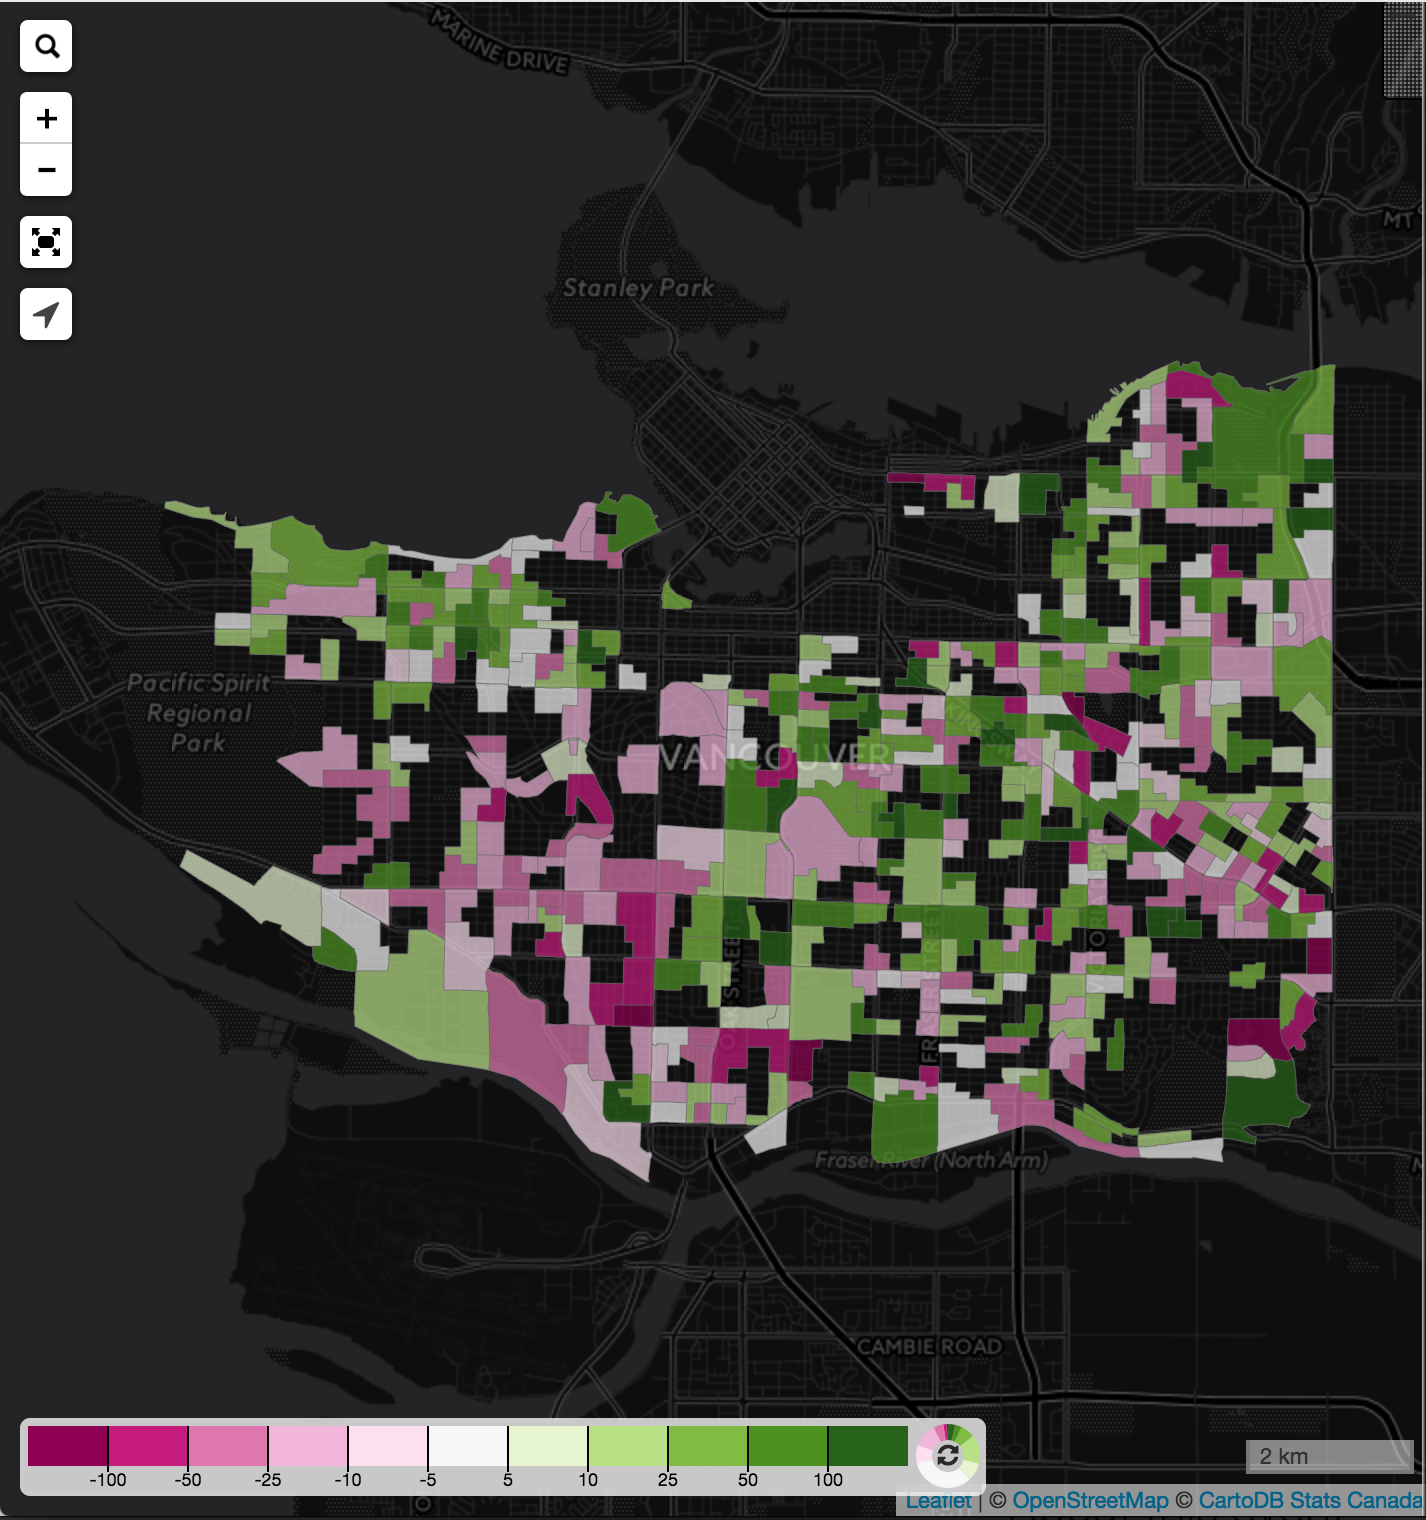
With reporting on the new census numbers gaining traction, and now Mayor Robertson picking up on single family neighbourhoods losing population we thought it is time to crunch some numbers.
Why does it need number crunching? All the reporting so far is based on looking at CT (Census Tract) aggregates, like e.g. in the map shown and linked to the right. But there is actually no single CT in the City of Vancouver that only contains RS zoning. Deducing results by just looking on CT aggregates can lead to misleading reporting, like we have seen with unoccupied dwellings in the “Marine Gateway Neighbourhood”. Given how prominent this topic has become it is high time to dig into the details.
TL;DR
In summary, we can confirm that RS (single family), RT (duplex) and FSD neighbourhoods have been dropping population. Slightly. Looking separately at the east and the west side, we notice that population in these neighbourhoods dropped by about 1% on the west side and increased slightly on the east side.
In all groupings that we looked at the household size dropped and the rate of unoccupied dwellings increased. This was counter-acted by a growth in dwelling units, mostly confined to RS zones where laneway houses and suites were added (or newly discovered in the 2016 census).
We split the analysis into core regions, blocks that lie completely within RS, RT and FSD zoning, and fringe regions, blocks that have RS, RT or FSD zoning as well as other zoning. Fringe regions grew in population and had overall lower rates of unoccupied units when compared to core regions.
Comparing Censuses
Comparing data across censuses is hard. For one, definitions change from one census to the next and thus variables aren’t always comparable. Four our immediate goal of comparing population, private dwellings, and private households between the 2011 and 2016 censuses that is not a concern.
Comparing data is relatively easy when census geographies are large (i.e. CT, CSD level or higher) and the census geography matches exactly the area that we are interested in. For CSDs (Municipalities) this is often the case, but at the sub-municipal level, the CTs (Census Tracts) or other sub-municipal aggregation levels rarely line up with the regions one is interested in.
For example, if one is interested in changes in population in RS (single family zoned) neighbourhoods in Vancouver, looking at selected CTs will only give some initial indication. The reason is that there is actually no CT in the City of Vancouver that is entirely RS zoned. There are several that come close (the closest one is CT 9330015.01 around 41st and Thyne, which actually increased population from 5,364 in 2011 to 5,485 in 2016) but it shows how tricky it is to answer the really simple question how the population changed in RS neighbourhoods.
So how to deal with this issue? The cleanest way is a custom tabulation from StatCan, but that takes time, costs money, and may still result in problems when data was not geocoded correctly, which is next to impossible to detect in custom tabulations.
An alternative way is to compare censuses at finer aggregation levels, that is at DAs (Dissemination Areas) or DBs (Dissemination Blocks).
Comparing Censuses at DA or DB levels
For our concrete example, that means we look for DBs within RS zoning and work with these.
There are several difficulties with this approach. The most important is that the finer data we look at, the more likely we pick up problems with Census data (yes, there are problems) and mistake them for real world data. For our case through, we can avoid some of that by aggregating over all DBs within RS zoning to even out some of these issues. Morever, we can visually inspect the data to look for any particular DB that seems to be problematic and do some ground-truthing to see if the issues are only in the data or actually on the ground.
The next difficulty is technical in nature. Census geographies, including DBs and DAs, can change from one census to another and thus may not be comparable. In order to get reliable results we need to make sure that we work with a common set of geographies for both the 2011 and 2016 censuses. Luckily this is only a technical problem that can be overcome as census geographies don’t just change randomly but still retain some basic comparability.
And it’s perfect timing, since we just created a “least common denominator” tiling derived from 2011 and 2016 DBs and DAs. At CensusMapper we work with “cartographic” DBs (so we clip our major bodies of water), which leads to a minor issue where between 2011 and 2016 things were clipped slightly differently which yielded two DBs in 2011 (with 16 and 17 people in it) being clipped out (and having no people in it) in 2017, likely a combination of adjusting some tolerances in the StatCan algorithms as well as some minor changes in geocoding that moved the population into an adjacent DB (like e.g. happened with 59150971009 and 59150971008 south of King Edward split along Carnarvon). Apart from that, the result is a tiling of Canada by DB and DA-based geographies that allow for consistent comparisons across the two censuses.
In numbers there were 493,192 cartographic DBs in 2016, 489,676 in 2016, and these resulted in a least common denominator tiling by 445,953 DB-based geographies.
RS, RT and FSD Zones and Population Change
 Back to our original question, how did population change in RS zoning. Before we go there, we think it makes more sense to expand the question to ask for RS, RT (duplex) and FSD (First Shaughnessy) combined as these are about equally restrictive in what we allow there.
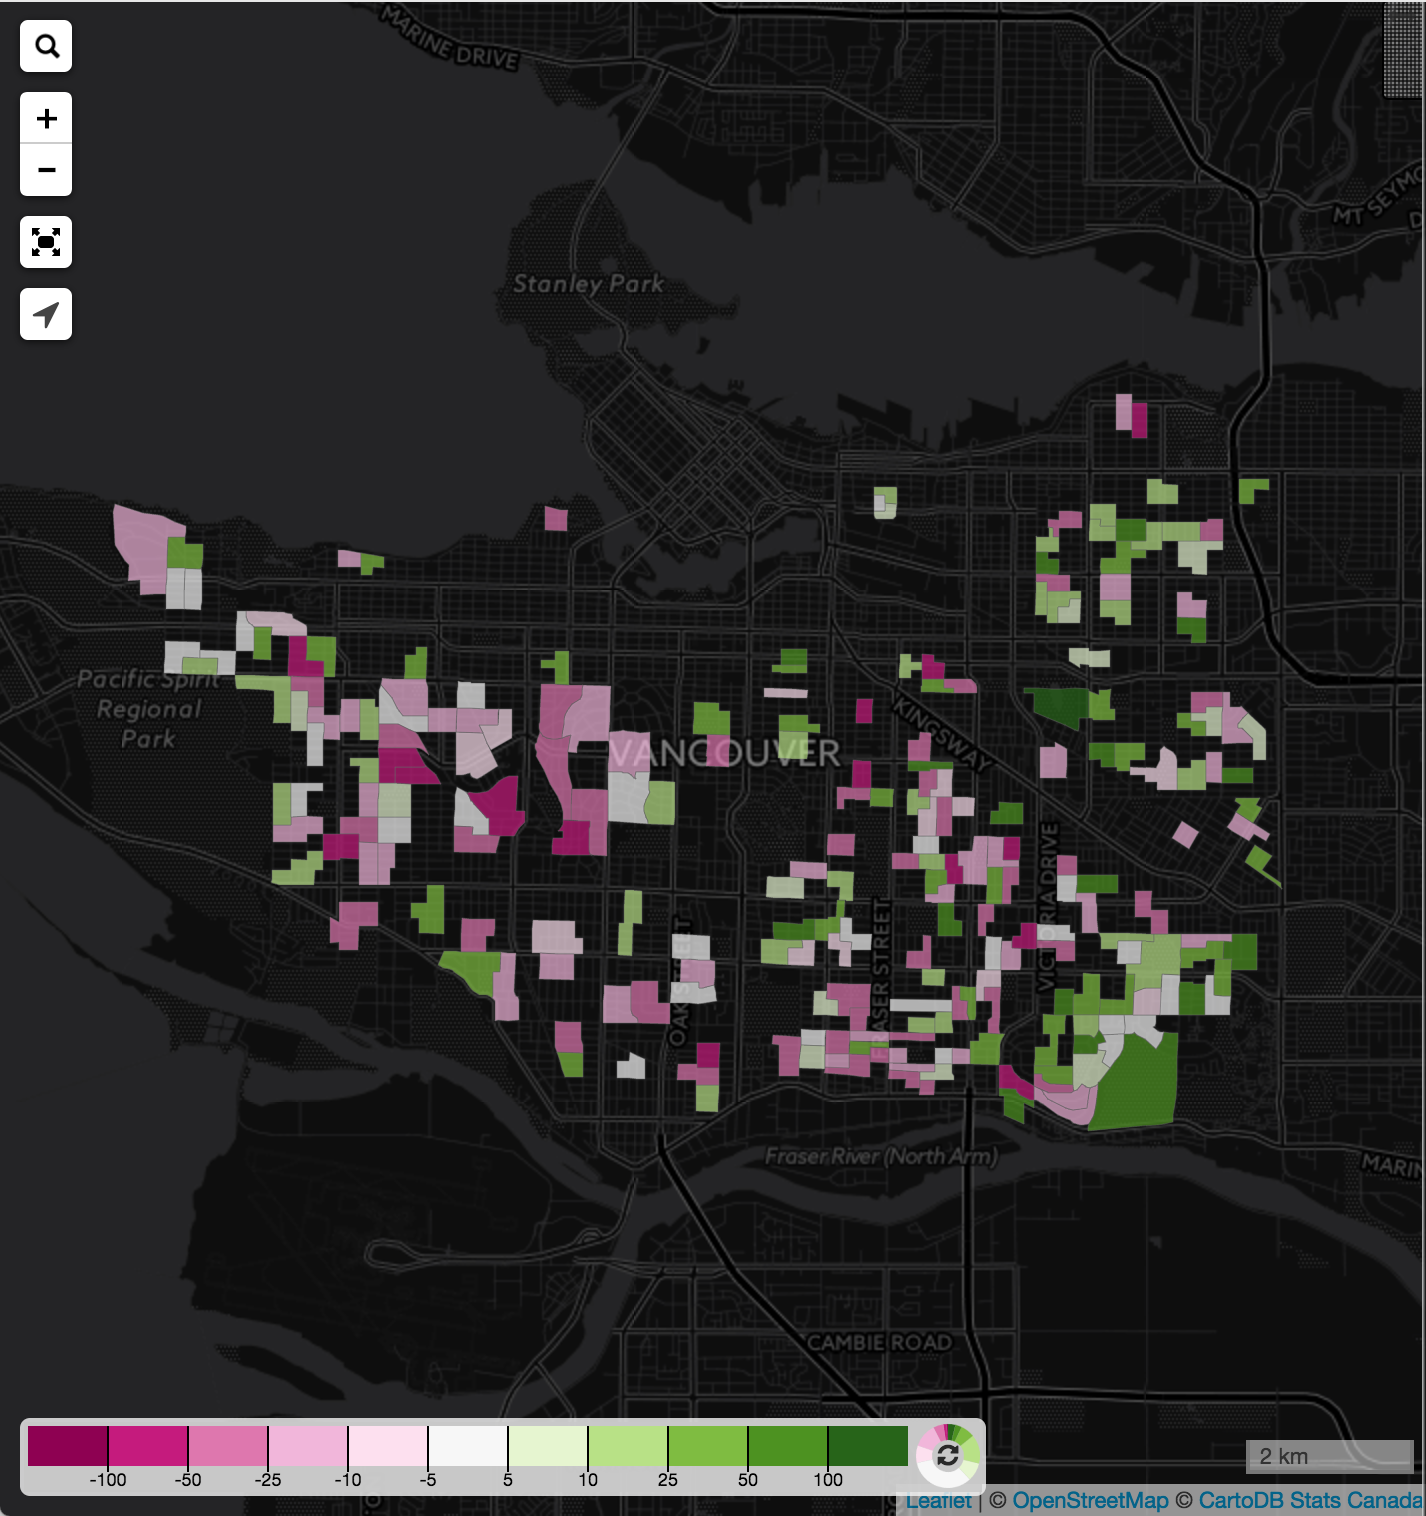
Grabbing the latest available zoning data and uploading it to CensusMapper makes it easy to download the 2011 and 2016 dissemination blocks that intersect RS, RT and FSD zoning. We removed the RS part that snakes along the downtown beaches and covers Stanley Park, as well as the sliver creeping up False Creek and covering the marinas there.
When we intersect the census data with the zones, we also compute the overlap each DB has with the zoning and disregard any region with less than 10% overlap. Moreover we divide the dissemination blocks into core blocks where the overlap is greater than 99% and fringe blocks, where the overlap is less than 99%.
One should remember that a significant portion (a majority actually) of RS, RT and FSD dwellings are contained in “fringe” areas. So it is best to focus on the rates of change, we would expect the total number of population decline of all RS, RT and FSD zoned properties to be higher.
Here are the results:
RS, RT, FSD
core: 236 DB, fringe: 475 DB
Population 2011 - 2016
core pop change: -69, fringe pop change: 6673, core total pop: 124916, fringe total pop: 284231
Dwellings 2011 - 2016
core dw change: 2812, fringe dw change: 7142, core total dw: 47008, fringe total dw: 121488
Households 2011 - 2016
core hh change: 1194, fringe hh change: 5127, core total hh: 42298, fringe total hh: 111801
What we see is that the population in the “core” DBs did drop. Slightly. At the same time the number of dwellings increased quite noticeably by 6.3% in the core, with essentially all of the dwelling growth located within RS zones (as opposed to RT and FSD). So most of that dwelling growth is due to suites and laneway houses. Note that we only capture 47008 dwellings in the “core” RS, RT, FSD areas, which is less than half of the dwelling units in RS, RT and FSD with the remaining dwellings are located within the “fringe” regions.
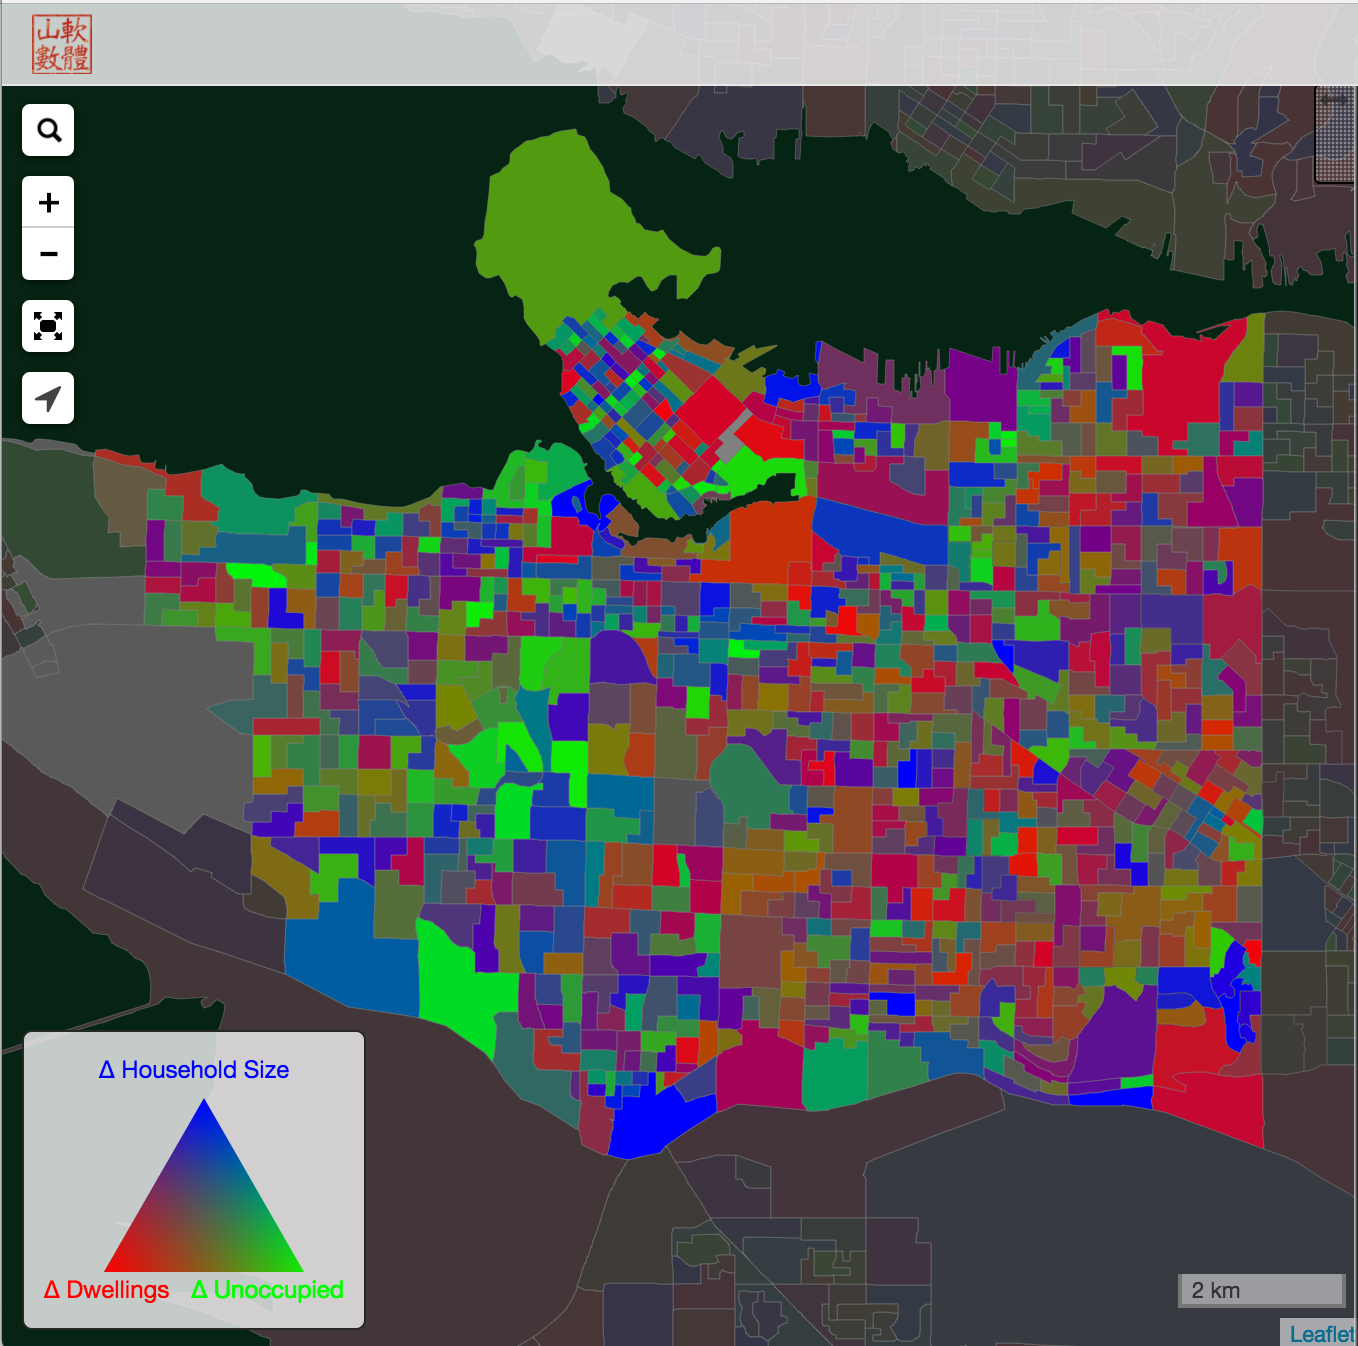
 Interestingly, the number of households grew much slower than the number of dwellings in the “core” regions, increasing the rate of unoccupied units from 7% to 10%. Following our decomposition of population growth mapped here and explained in more detail in a previous post, we see that the population growth of -69 in the “core” regions can be decomposed into:
- -3,699 due to declining household size,
- -4,321 due to increase in unoccupied dwellings, and
- 7,952 due to increase in dwelling units.
 We can do the same analysis for the “fringe” areas, where RS, RT and FSD zoning mixes with other zones. Here we get a population increase by 2.4%, driven by an increase in dwelling units by 6.2%, and dampened by shrinking household size and a more modest increase in the rate of unoccupied units from 6.7% in 2011 to 8% in 2016. We note that the rate of unoccupied units increased significantly less on the fringe when compared to the core.
Breaking up the population growth of 6,673 people as before we have:
- -6,667 due to declining household size,
- -3,996 due to increase in unoccupied dwellings, and
- 17,336 due to increase in dwelling units.
The West Side
Lastly, we probably can’t talk about this without running a separate analysis for the west side. So here we go.
RS, RT, FSD
core: 88 DB, fringe: 184 DB
Population 2011 - 2016
core pop change: -510, fringe pop change: 1631, core total pop: 42878, fringe total pop: 105309
Dwellings 2011 - 2016
core dw change: 572, fringe dw change: 2426, core total dw: 16735, fringe total dw: 49210
Households 2011 - 2016
core hh change: -18, fringe hh change: 1226, core total hh: 15066, fringe total hh: 44907
We see that this confirms conventional wisdom that the population decline in the core areas of RS, RT, FSD is stronger on the west side (and in fact population did increase overall in the core areas on the east side). The rate of unoccupied (by usual residents) units was quite similar to the overall RS, RT, FSD, climbing from 6.7% in 2011 to 10% in 2016.
Again splitting up the population change of -510 people in the “core” area into components we get:
- -458 due to declining household size,
- -1,587 due to increase in unoccupied dwellings, and
- 1,535 due to increase in dwelling units.
For the “fringe” west side areas we again observe that population increased at 1.5%, dwellings by 5.1% and the rate of unoccupied units grew slower from 6.6% to 8.7%. Splitting up the population change of 1,631 people:
- -1,278 due to declining household size,
- -2,466 due to increase in unoccupied dwellings, and
- 5,376 due to increase in dwelling units.
Glossary
We are a little loose with our use of language. In this post “unoccupied” is always short for “not occupied by usual residents”, so in simpler terms “not used as primary residence”. “Occupied” refers to “used as primary residence”.
West side and east side were divided along the longitude for Ontario road.
Core regions are Dissemination Blocks that have at least 99% overlap with RS, RT or FSD zoning.
Fringe regions are Dissemination Blocks that have between 10% and 99% overlap with RS, RT or FSD zoning.
Reuse
Citation
@misc{rs-population-change.2017,
  author = {{von Bergmann}, Jens},
  title = {RS {Population} {Change}},
  date = {2017-03-06},
  url = {https://doodles.mountainmath.ca/posts/2017-03-06-rs-population-change/},
  langid = {en}
}
