After the BC government stopped publishing foreign buyer’s data after May this year it reversed course and gave the data out to media outlets earlier this week. It started being released to the general public only earlier today, with the complete data becoming available around noon today.
The Data
There is a number of metrics in the data, the one we will focus on is the share, median dollar value and total dollar volume of foreign buyer purchases. The dataset comes in two parts, one for 2016 data and one for 2017 data. Sadly the two datasets are based on slightly different regions, use different spellings and have some other minor compatibility issues. We show data for all transactions, residential and non-residential.
Full timelines
Comparing data through all the datasets is tedious, so we only run the full timelines for data that is easy to compare.


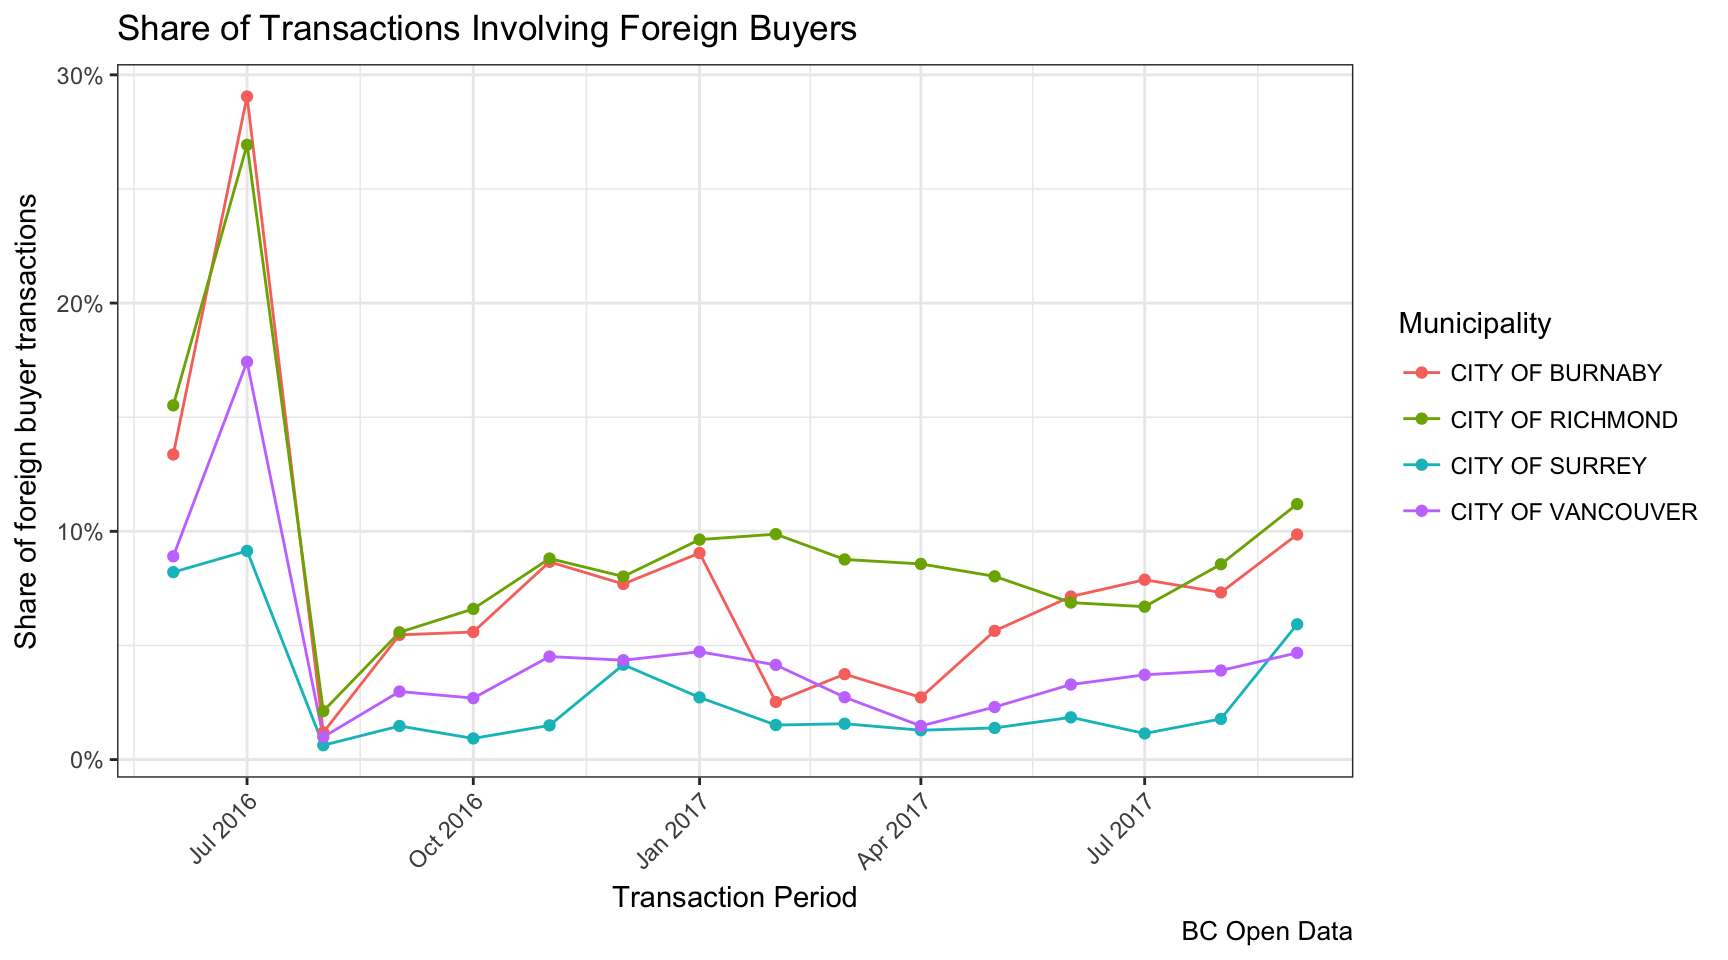
What we see is that the share of foreign transactions briefly spiked in the time frame where the foreign buyer’s tax got announced, likely because sales were being rushed through before the deadline. Sadly we don’t have robust measurements of pre-tax sales volumes, we see that the post tax share and dollar volumes are quite volatile. It is difficult to discern clear trends in the share of foreign buyers, other than 10% appearing to roughly be the cap for Burnaby and Richmond, and 5% for Vancouver and Surrey. There are significant spikes in the total foreign transaction volumes, as well as the relative median transaction price, indicating that at times foreign purchases skew high. Apart from the occasional spikes it appears that median purchase prices of foreign buyers are roughly in line with overall median prices.
A closer look at 2017 Data
We take a closer look at the top 8 municipalities in terms to total transaction values involving foreign buyers in 2017 thus far. Data is not available for all months due to at times small number of transactions. Next to the municipalities we already looked at above this selection criterion also yields Coquitlam, Victoria, Saanich and the Township of Langley.


The municipalities that got added have around 5% share of foreign buyers, with Saanich registering higher. Apart from the spike in relative median transaction values for Surrey that we have already seen above we also notice a spike in high-value foreign buyer transactions in Saanich around February. Other than that, median purchase price involving foreign buyers seems to be in line with overall median purchase prices.
As always, the R Notebook that built this post is available on GitHub for those interested in playing with it or looking at different aspects of the data. We plan on occasional update posts as new data becomes available and we notice interesting new trends. We doubt we will be this on a monthly basis, so download the R Notebook if you want more frequent updates.
Reuse
Citation
@misc{updated-foreign-buyer-s-data.2017,
  author = {{von Bergmann}, Jens},
  title = {Updated {Foreign} {Buyers} {Data}},
  date = {2017-11-02},
  url = {https://doodles.mountainmath.ca/posts/2017-11-02-updated-foreign-buyer-s-data/},
  langid = {en}
}
