The election data got posted on the Vancouver Open Data website so we decided to take a very quick peek at how the candidates fared by polling station. Citizens can vote at any station they want, so there is are no voting districts. But proximity to home is probably a large factor in determining where people vote, although some may choose locations close to work or somewhere else convenient. For anyone that wants to refine the analysis, the R Notebook that generated this post lives on GitHub.
Vote split by Voting Place
This graph gives an overview how the votes were split at each individual polling station.

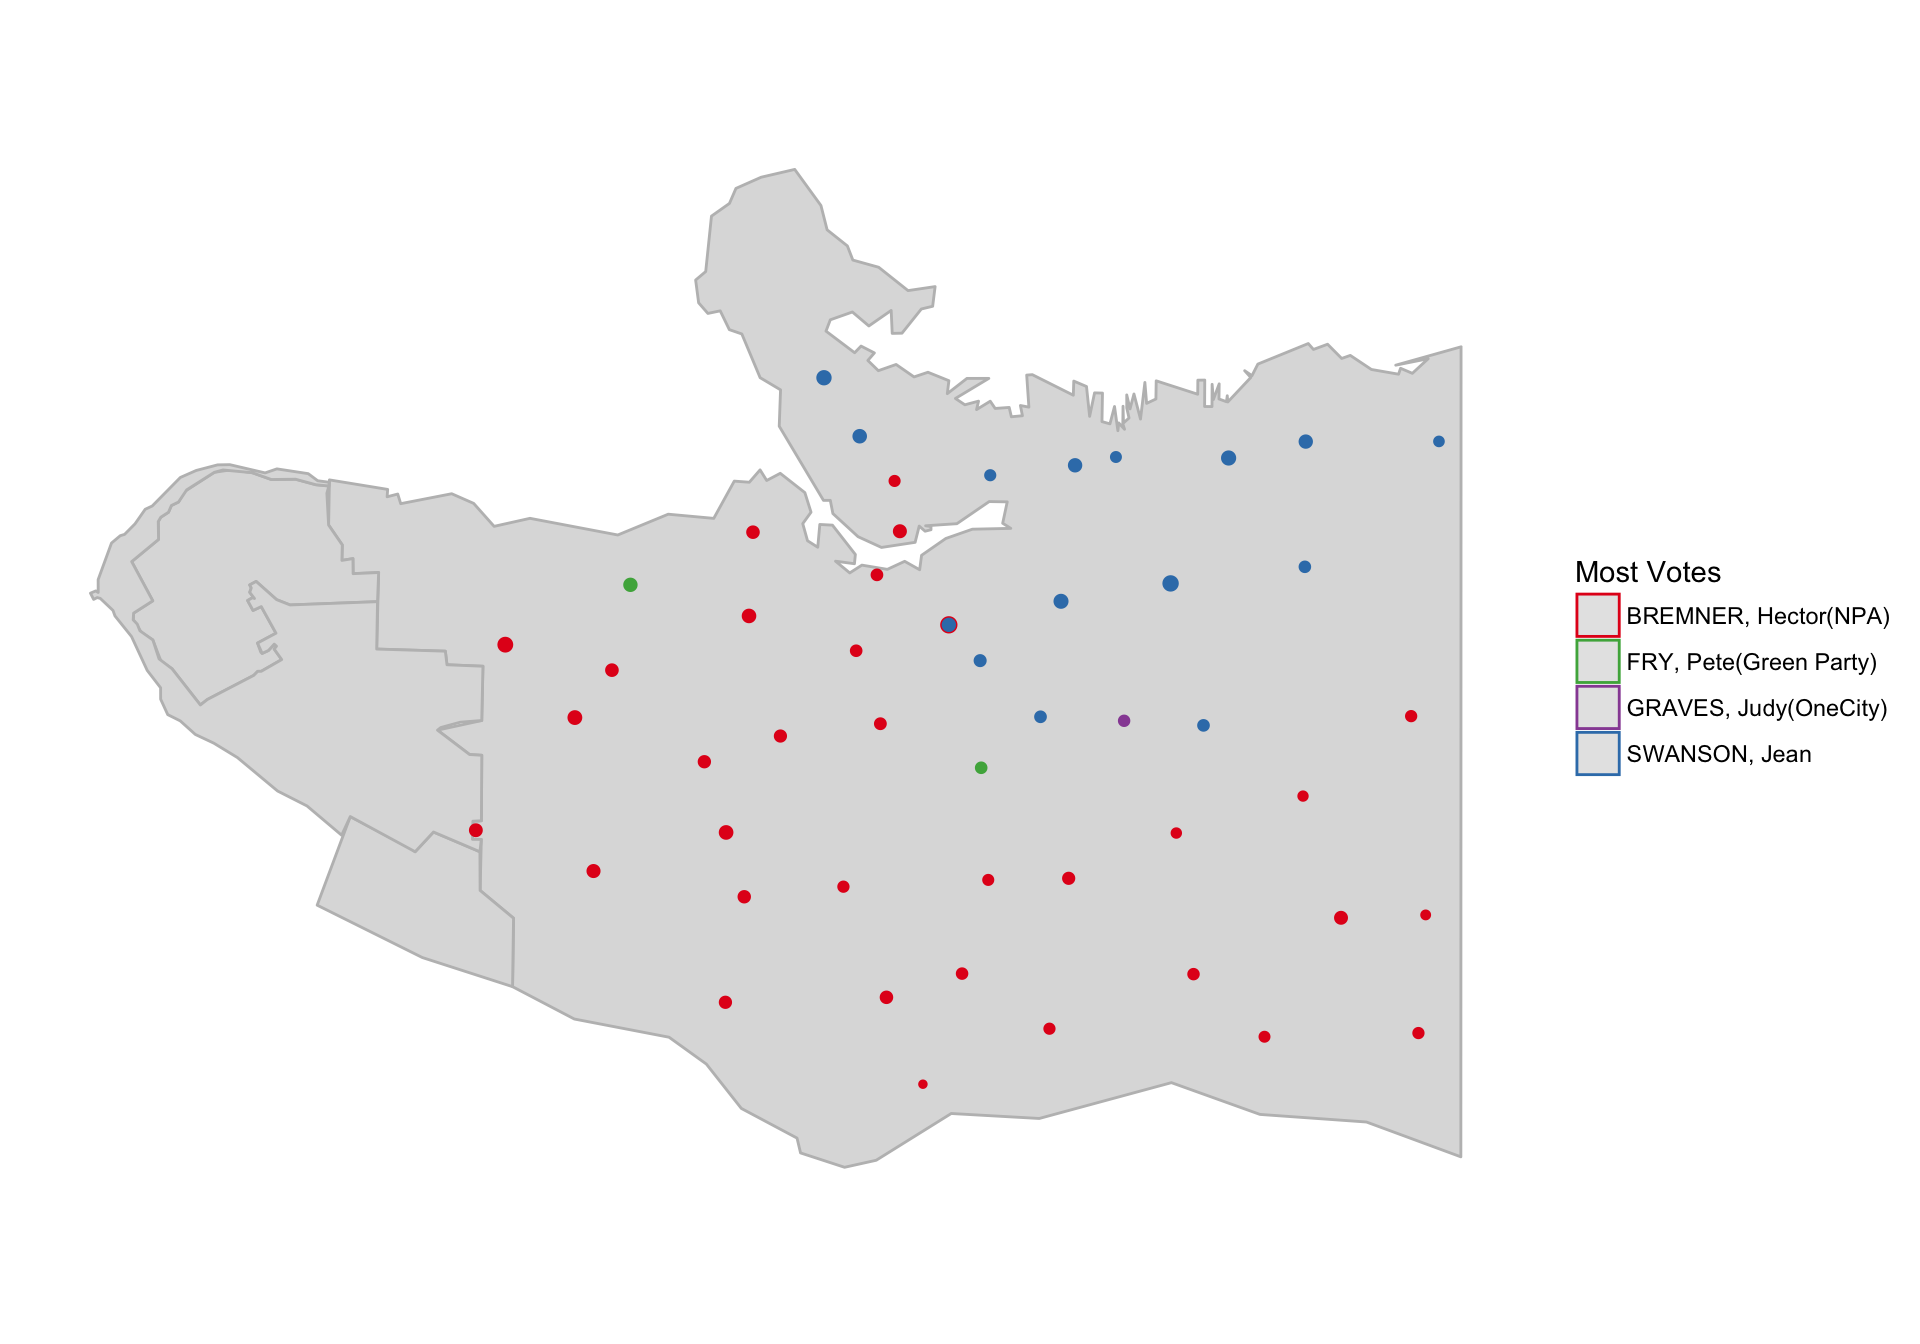
Most Votes by Voting Place
For each voting place we looked at who got the most votes and plotted the result on a map to get an overview of the geographic distribution.

Reuse
Citation
@misc{byelection-data.2017,
  author = {{von Bergmann}, Jens},
  title = {Byelection {Data}},
  date = {2017-11-21},
  url = {https://doodles.mountainmath.ca/posts/2017-11-21-byelection-data/},
  langid = {en}
}
