Smarter people than I have already responded to the recent furor about John Rose’s working paper, which is (part of?) the result of one year of research on affordability by the author, arguing that Vancouver has no supply problem. Most notably Nathan Lauster in a series of blog posts taking a look at the theoretical framework and methods used and running some numbers himself. I don’t have much to add to the first post, which took the time to highlight some of the useful demand measures that are either already implemented or currently under discussion and makes the point that the idea that we have enough housing in Vancouver, especially enough rental housing, requires an extraordinarily strong argument in the face of sub 1% rental vacancy rates. And the arguments made were weak at best.
The second post digs into some of the census data issues that the working paper had, and introduces construction and demolition data as another measure to contrast and contextualize changes in the census methods, which is interesting. It seems that in the evening blog post writing some of the numbers may have gotten mixed up, which should not distract from the larger critique presented.
In this post I would like to,
- add some thoughts on “supply”,
- put this discussion on a reproducible and transparent footing by providing the code to (re-) produce the results of the working paper,
- expand on Lauster’s work on comparing census with completions data, and
- digging a bit deeper into the effects of the change in dwelling enumeration between 2001 and 2006.
Supply
In the context of housing supply is a word that is stretched quite far these days, denoting anything between the classical economics
A supply of something is an amount of it which someone has or which is available for them to use. Oxford English Dictionary
to just meaning an existing (or sometimes an under construction or just permitted) housing unit.
The economics definition is useful because it is clearly defined and there is a strong relationship between the supply-demand balance and prices, on the ownership as well as the rental market.
Ownership
For the ownership market in Vancouver the interplay of the supply-demand balance with prices has been expertly visualized by YVR Housing Analyst and is summarized in this tweet
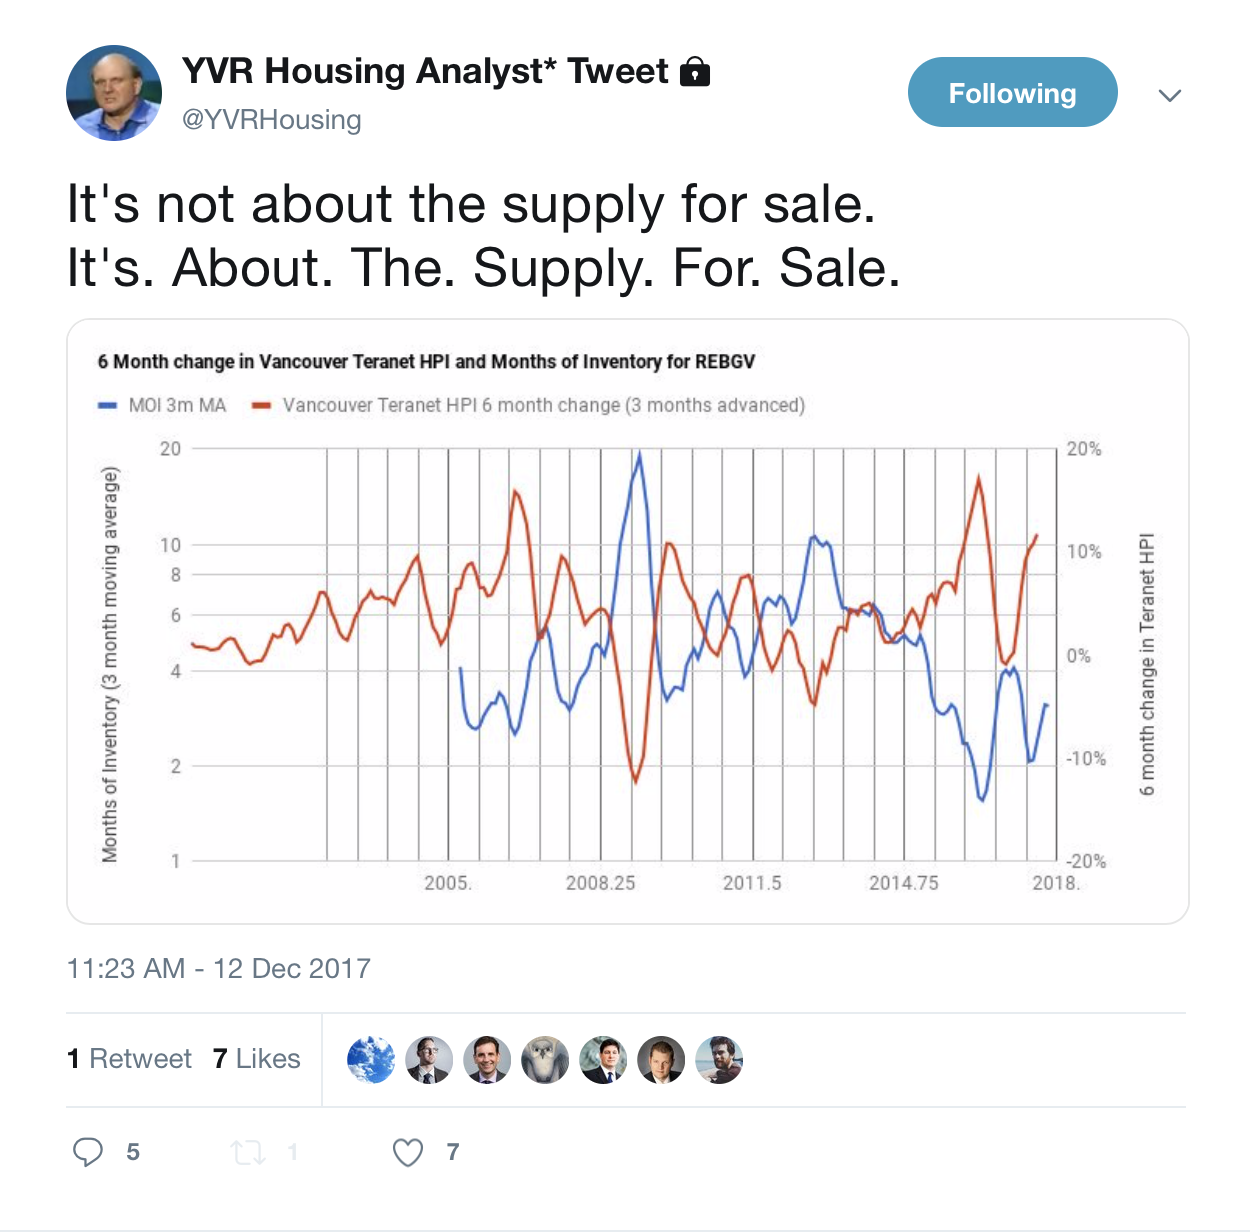
and a blog post. The upshot is that price change is driven by months of inventory. (And yes, this is more than just a correlation.)
Rental Market
I don’t have quite as clean an analysis to offer for the renter market, partially because I only have annual vacancy rate data. But here too we can observe the interplay between supply-demand, measured by the vacancy rate, and year-over-year (nominal) fixed-sample rent increases.

Here we can clearly see how vacancy rates drive fixed-sample rent increases.
Supply in the Working Paper
The working paper indirectly defines “supply” as a housing unit that is not used as a primary residence. So a housing unit that is for sale and empty, for rent and empty, occupied temporarily by someone (e.g. a student who thinks of their parent’s place as their permanent residence), a vacation property or a unit left empty for shorter periods of time (in between moving) or for longer periods of time, or a newly constructed housing unit that has not been moved in yet. It excludes units for sale if someone still lives in them.
This somewhat unorthodox definition of supply is then put in relation to “affordability” for aspiring owner households, that is the change in home prices. I am not sure that’s a particularly useful way to to approach this. The working paper then looks at the change in “supply” between 2001 and 2016 and the change in “affordability” between these years. The author notes that Vancouver registers as both, strong in increase of “supply” and strong decrease in “affordability”, and concludes that this provides proof against calls for adding “supply” (which in context of this conclusion seems to be re-defined more generally as “housing units”) to aid “affordability”.
Dwellings, not occupied by usual residents
This is again all about the evergreen topic of private dwellings, not occupied by usual residents that many people, including myself, have talked about over the years. Vancouver does have a somewhat elevated rate of these dwelling units, and there are several good measures underway to incentivize a better use of the existing stock. The City of Vancouver has enacted the Empty Homes Tax, and the province is (hopefully?) still mulling over including the BC Housing Affordability Fund into it’s upcoming provincial budget.
That said, the rate of private dwelling units that are not occupied by usual residents (or non-primary residences for short) can’t be pushed down to zero. There will always be a base vacancy rate just for moving friction, similar to the unemployment rate or the job vacancy rate never hitting zero. Then there will always be “temporary” residents, with temporary foreign workers and students listing their parent’s residence (or not sticking around for the census after the end of the semester) being examples. Getting a third of these units into use as primary residences would be a worthwhile, yet ambitious goal.
Why do we add dwellings?
The author also seems to suggest that the only reason to add dwelling units is to lower prices. While adding dwelling units will under (almost) all realistic conditions lower prices (at least in the sub market in which they are added), that certainly is not the only reason to add dwelling units. Adding dwellings is first and foremost about accommodating people.
There are many people that want to live in our region, some that are currently living here and that have a hard time to find a place to rent, some that want to move here but can’t find adequate housing options. With the rental vacancy rate now for many years below 1% in the region, and a record job vacancy rate that climbed to 4% in the past quarter, the pressure on the existing stock is building. And it’s the lower income people that tend to get pushed out when the higher income people compete for the same stock. As the centre of the region, the City of Vancouver is feeling the strongest pressure, and we have seen how low income people get pushed out of the city and people pile on in the top income bracket between the past three censuses. In that time the City of Vancouver has overtaken the City of Toronto in terms of incomes if measured apples-to-apples. The rest of Metro Vancouver has not yet seen that strong of a reaction in the data, but as housing prices and rent increases ripple outward through the region the pressure is building everywhere.
Reproducible and Transparent Numbers
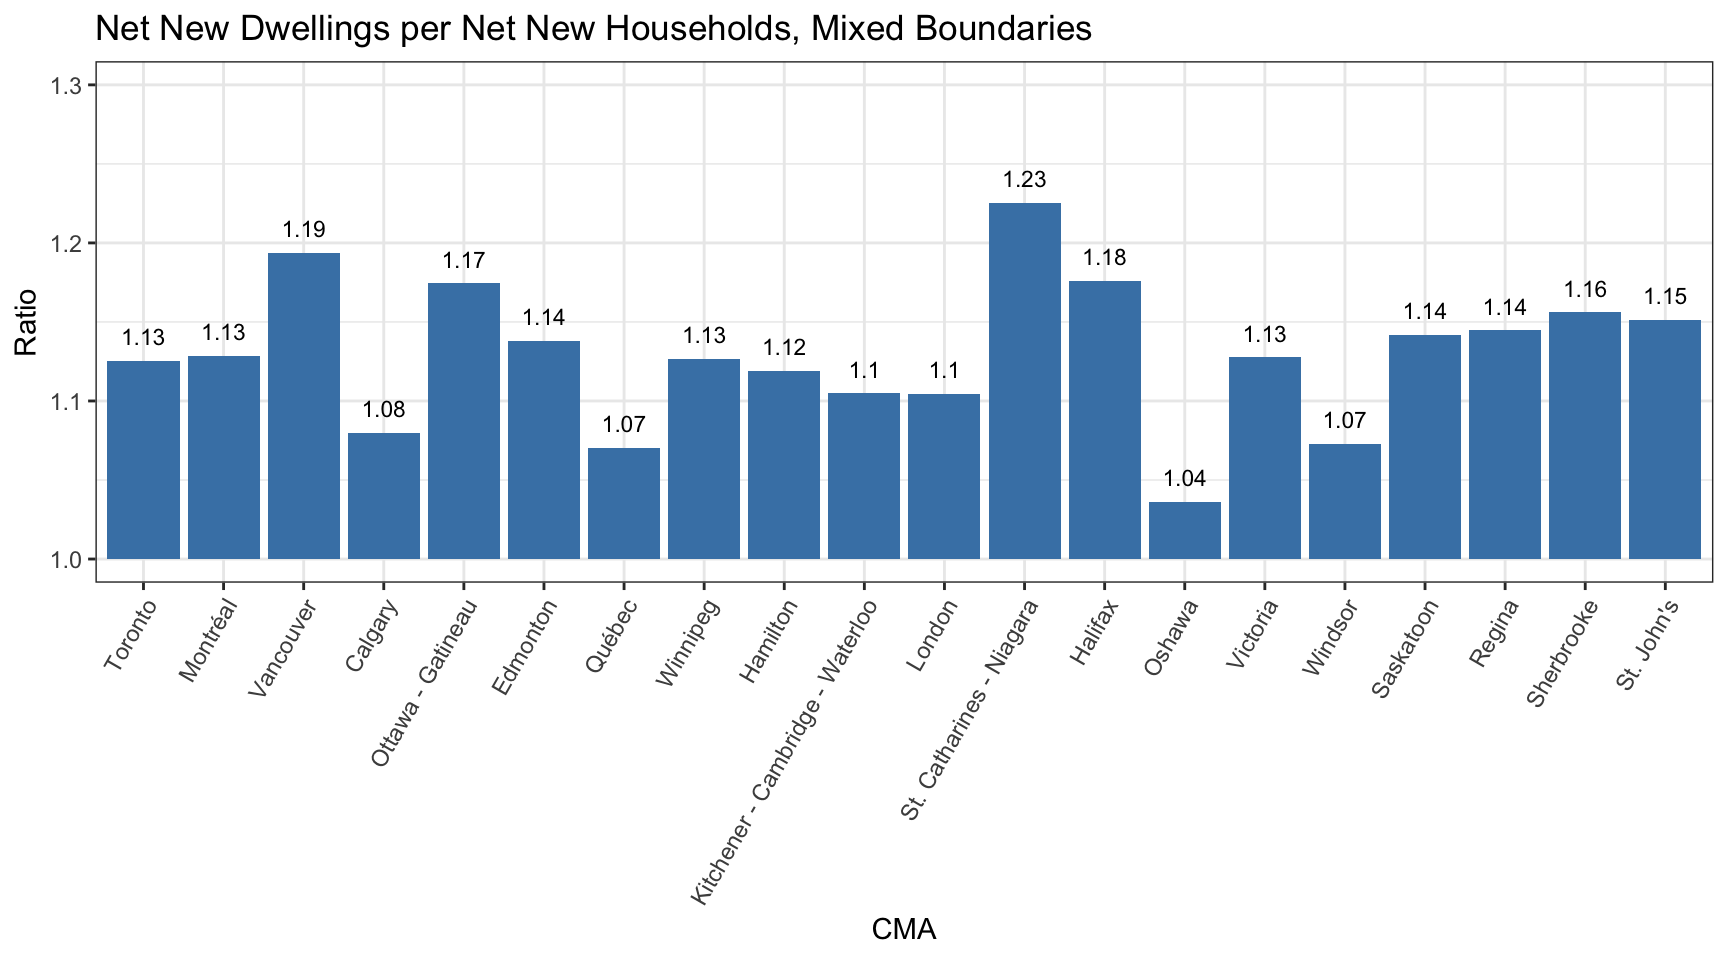
The other issue with the paper is the data. We all know that affordability has gotten worse in Vancouver, and the last thing we need is yet another faulty metric to show this. The main metric being used by Rose is net new dwellings by net new households between 2001 and 2016 for several Canadian CMAS. I have a couple of questions about the metric. Why start in 2001 and not, say 1996 or 2006? Why focus on private households and not e.g. family units? After all households can be quite complex, especially in Vancouver and Toronto that have high rates of certain types of “advanced roommate” type households and saw the share of adult children living with their parents growing. And why choose “private dwellings occupied by usual residents” (aka private households) instead of “occupied private dwellings”? It is not clear to me why a dwelling unit that’s occupied by a temporary worker should be treated the same way as an empty unit. Or a private dwelling unit that was occupied by one or several students that stuck around until the census after the end of the semester but still think of their parent’s house as their “permanent” residence.
So let’s run the numbers. Unfortunately I don’t have 2001 numbers in CensusMapper, but it’s easy enough to pull the data for the 20 most populous (using 2016 population numbers) CMAs for 2001 and 2016 and perform two subtractions and one division. In the interest of transparency and reproducibility, the code for all graphs is included in the R Notebook that built this post and lives on GitHub as regular readers probably already guessed.
Changing metrics
While it was easy to compute it, the metric itself has two big issues. Nathan Lauster already pointed out one of them, that the census changed the way it counted dwelling units between 2001 and 2006, with the net effect of discovering suites. That adds to the count of dwelling units in 2006 compared to 2001 without new dwellings being produced. At the same time the census would also discover more households, in this case occupied suites, that were already present in 2001 but not counted then. In order to say that this change does not bias the analysis one would have to argue that suites are just as likely to be occupied by usual residents as other building types, which is probably not true. We will dig deeper into this question toward the end of the post.
In the meantime it would probably be prudent to add in data for the intermediate years 2006 and 2011 to see how this plays out over the years. One would expect the effect of the change in methods to be bigger in metropolitan areas with more suites, like in Vancouver.
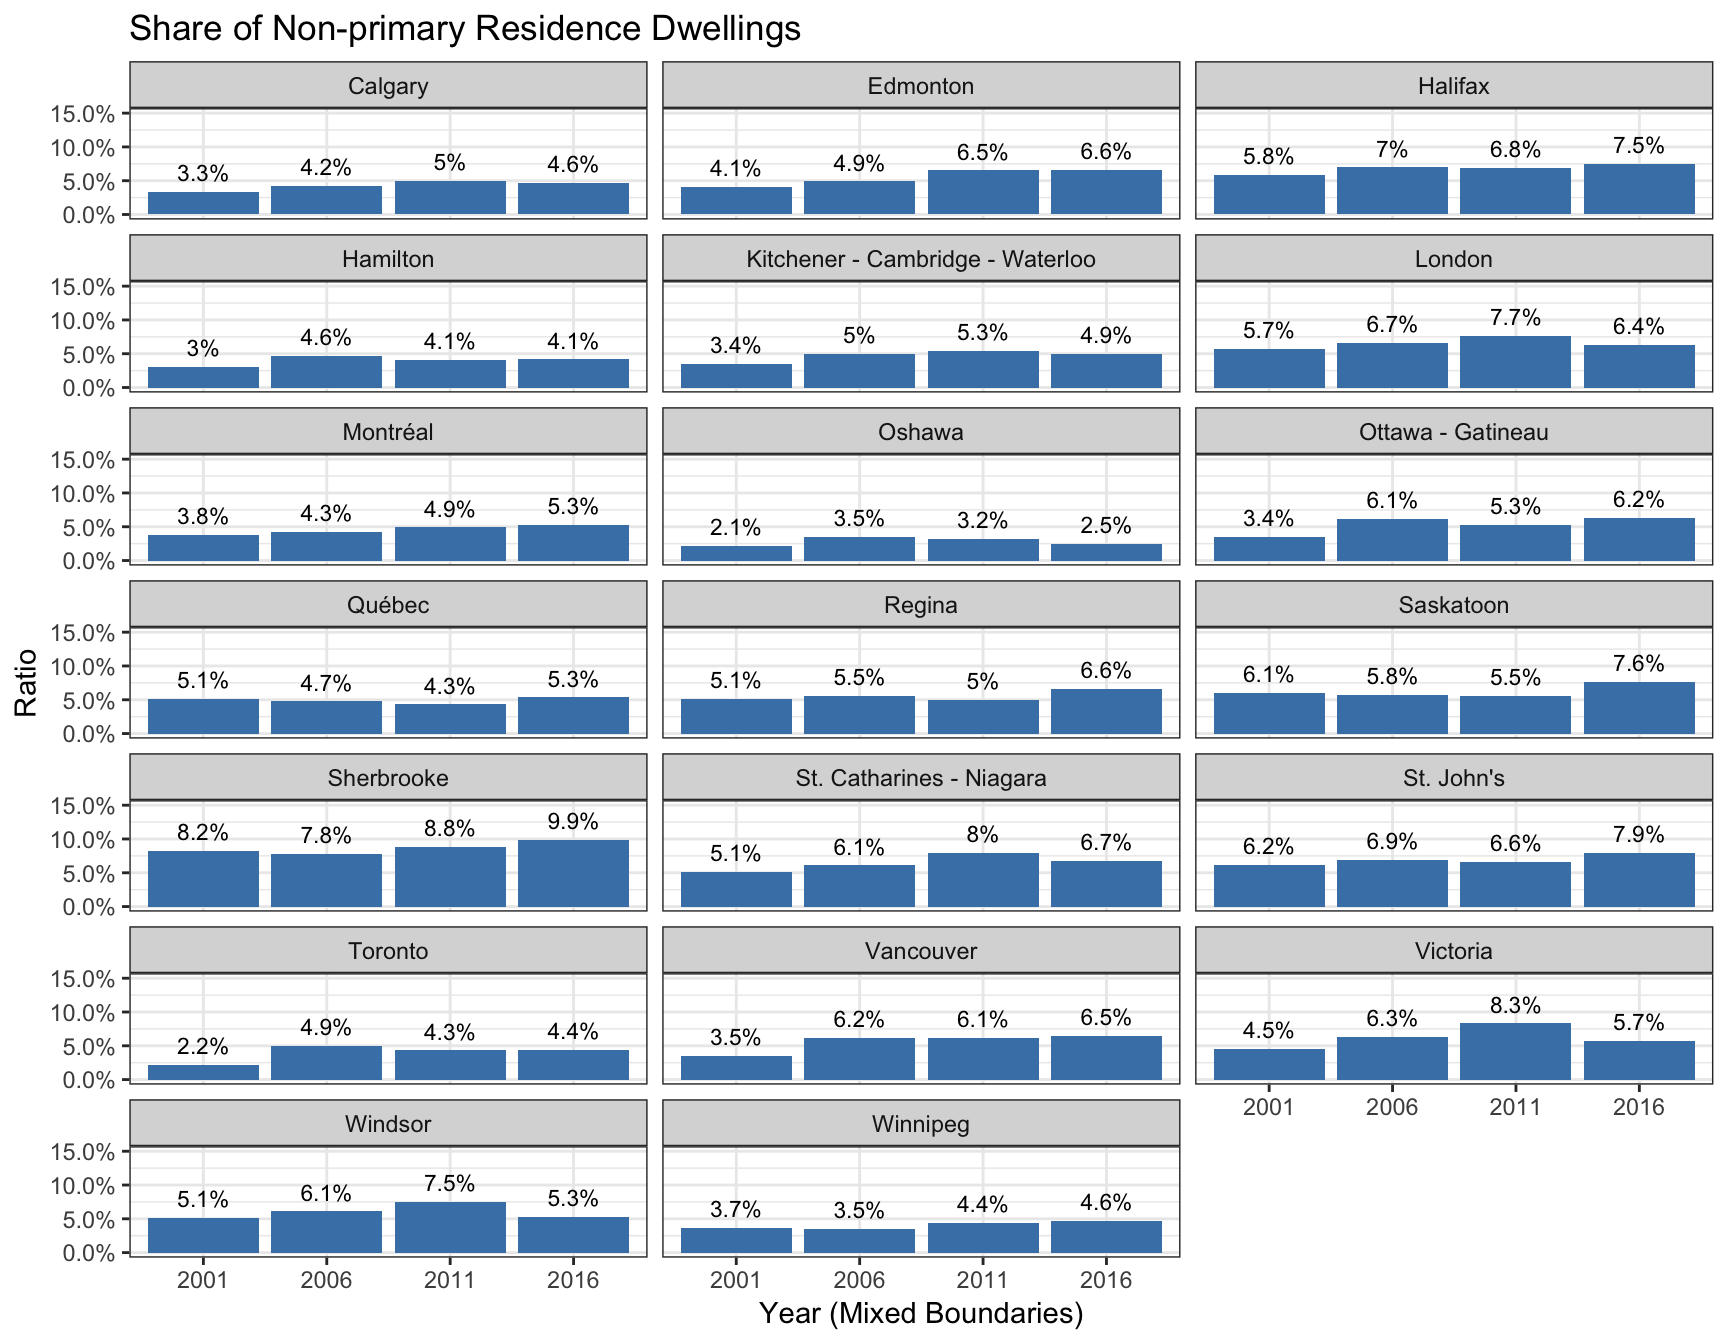
Here we see, as Nathan Lauster already pointed out, that the majority of the change in non-primary residence private dwellings in Vancouver (and some other regions) occurred between 2001 and 2006. Showing the change by using “net new dwellings by net new households” emphasizes that. But we prefer to show things this way, which brings us to the next issue with the metric used in the working paper.
Changing CMAs
The other problem with the comparison is that for many CMAs the difference in the count of dwelling units (or of households) is not the same thing as “net new dwellings”. That’s because CMAs aren’t monolithic things that exist through time, they change. CMA boundaries can get adjusted between censuses, and many of the listed CMAs have. Which makes it hard to make sense out of what these numbers actually mean. Comparing across census years is hard as we have explained in detail before and typically requires a lot more work than just a little arithmetic with a couple of numbers. For example, the population within Montréal’s 2016 CMA boundaries grew by 4.2% between 2011 and 2016, but if we naively take the populations in the 2016 CMA boundaries in 2016 and compare it to the population in the 2011 CMA boundaries in 2011 we would think it grew by 7.2%.

We don’t have 2001 data in CensusMapper, which makes it a little more work to pull the proper numbers for all CMAs than we are willing to put in for an evening blog post. But we chose London CMA because of it’s simplicity to work out the effect of using proper boundaries on the metric from Rose’s working paper.
| CMA / Method | Net New Dwellings per Net New Household |
|---|---|
| London 2011 boundaries | 1.11 |
| London mixing boundaries | 1.10 |
| London 2016 boundaries | 1.11 |
The difference is not large, but noticeable. It is not clear to me how this will play out in some of the other regions, but one should probably work this out in detail if one wanted to do this properly.
Median Multiples
While we are at it, we should probably also look at the “affordability” metric that was used. Median multiples is probably my least favourite among the affordability metrics, but it somehow won’t die. The metric can have some value, but there are lots of issues when using it to compare across regions or time. Among the issues is that household composition can significantly skew the metric, that it is taken at the ecological level and can point in the opposite direction as individual level metrics like we have shown happened in Vancouver, that it ignores tenant households and differences in the share of tenant households, and many more. If one insists on this kind of metric I think family income is probably better suites than household income. It might also make sense to view renter and owner households separately and use separate income numbers for these.
It took a bit of debugging to figure out that the working paper used the average owner-occupied dwelling values by median household incomes as a metric as opposed to average dwelling value by average incomes as it claimed. The metric is a little funky, but here are the results and the code to reproduce it for added transparency so that the next person doesn’t have to go around guessing at how things are computed. In the working paper this was compared against data from Demographia (can’t believe people actually use that data for things other than click bait), so we decided to lend a helping hand and add in the consistent metric for 2016. And we threw in the intermediate years too for added context.
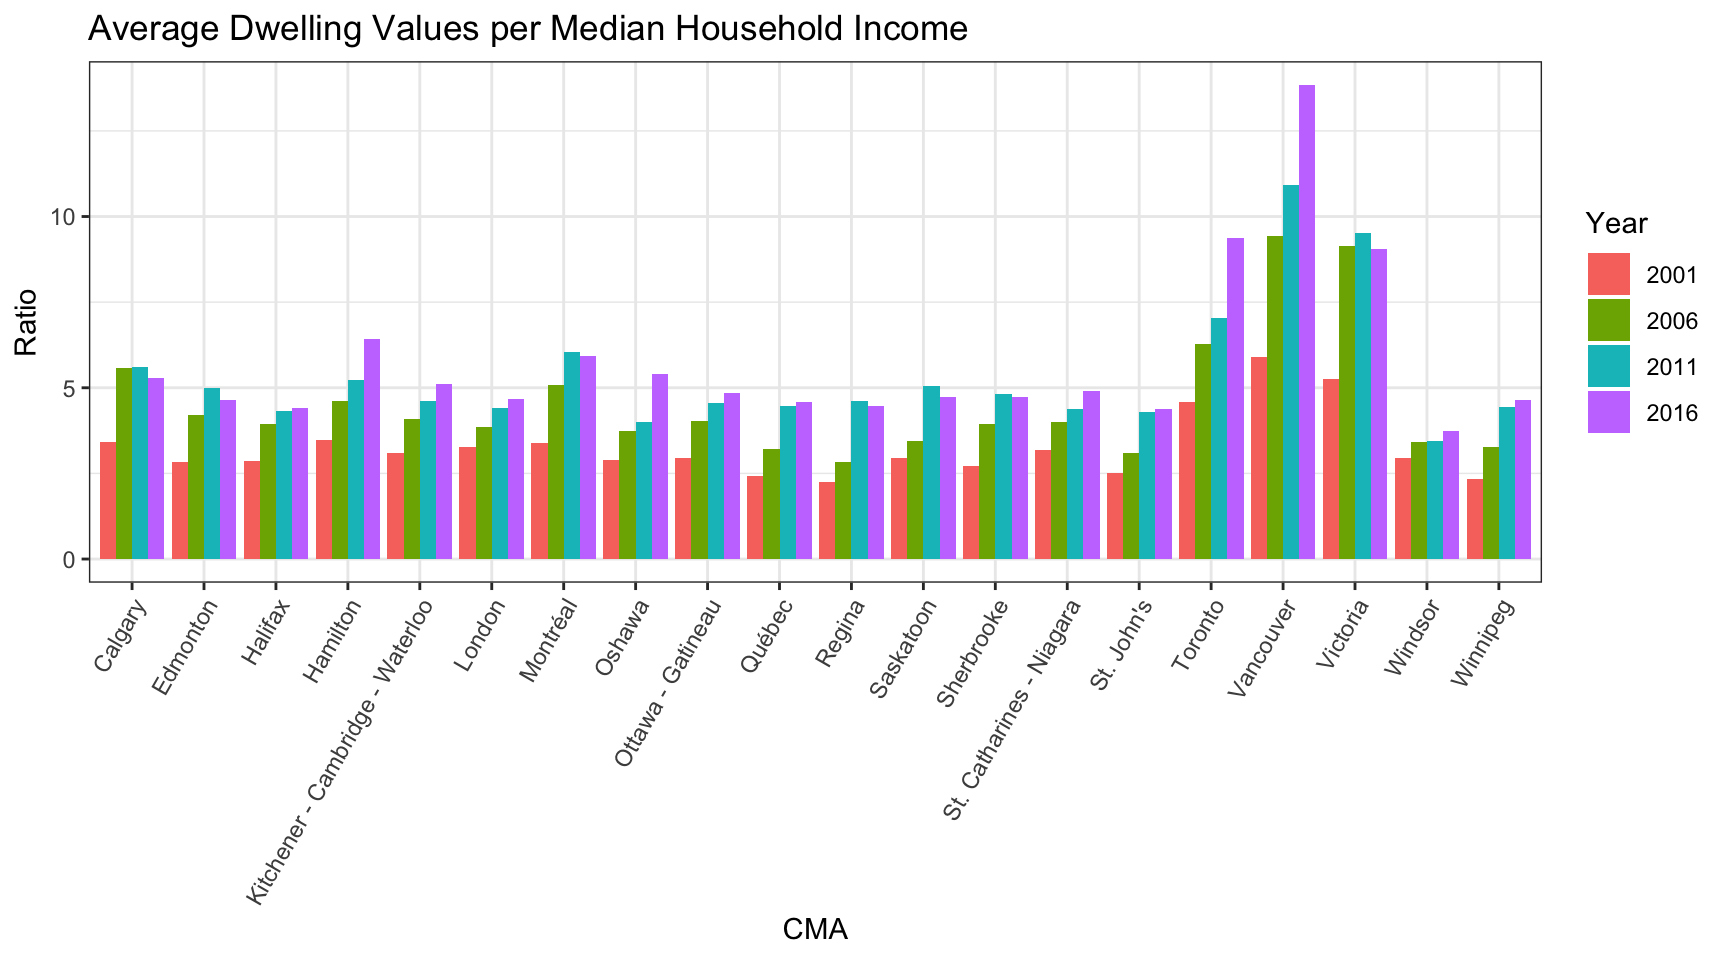
It’s very clear that Vancouver stands out, and we have seen countless graphs of this type before. The changing CMA boundaries over time is much less of an issue for this graph, it could even be considered a feature and not a bug. Growing the CMA will typically deliver an affordability boost as more outlying municipalities tend to have less expensive housing. But metropolitan boundaries are derived from commuting patterns, so it properly adjusts the metropolitan area to the given context each census year (or with a 5 year lag). As a footnote, Metro Vancouver is at a disadvantage here as the existence of the Abbotsford-Mission CMA directly to the east prevents it from growing. We will leave the details of this for another post.
Using more appropriate measure like family income or owner household income will soften the growth in the multiples metric somewhat, as will using median dwelling values instead of averages. For example, just using median multiples pegs Vancouver at a ratio of 11 in 2016, using median family incomes to median owner-occupied dwelling values Vancouver sits at 8.7. But while the exact ratios depend highly on the metric, the general trends remain the same. Vancouver is an outlier.
Construction Data
One interesting addition of Nathan Lauster that spiked our interest was folding in construction data. In principle that’s a great way to cross check the dwelling growth hypothesis, but we also need demolition data to make this work. And demolition data is in short supply, CANSIM 026-0012 publishes data up to 1999. I seem to remember that i is still collecting that data, but it stopped publishing it due to quality concerns and is thus of little use for our time frame. Lauster took demolition data for the Metro Vancouver Housing Data Book.
This is a similar approach as taking in the IMF working paper Gauging Housing Supply in Canada: A Stock Approach which uses a some more robust methodology for understanding housing stock in relation to households and “excess supply”, which Rose’s working paper may benefit from. In particular the IMF paper takes care to recognize the existence of an “equilibrium or normal vacancy rate” for a given market and “excess occupancy” (or the reverse thereof) that stems from unexpected patterns in household formation, some of which we have highlighted earlier.
Let’s first look at City of Vancouver data and see how completions have evolved over time.

We can average the data over the census periods in question, starting at May in 2001 to April 2016, inclusive. 
We can quickly check how completions have varied across select metro areas and through time.

Next we need to fold in demolitions. For the city of Vancouver we can eyeball the number of demolitions using the Metro Vancouver Housing Databook for the periods of interest. It will be more work to assemble this for other metropolitan areas.

The difference is the net new dwellings. We should caution that tracking demolitions and additions like suite conversions is hard, so there are quite likely some issue with this kind of data too that are worth exploring further.
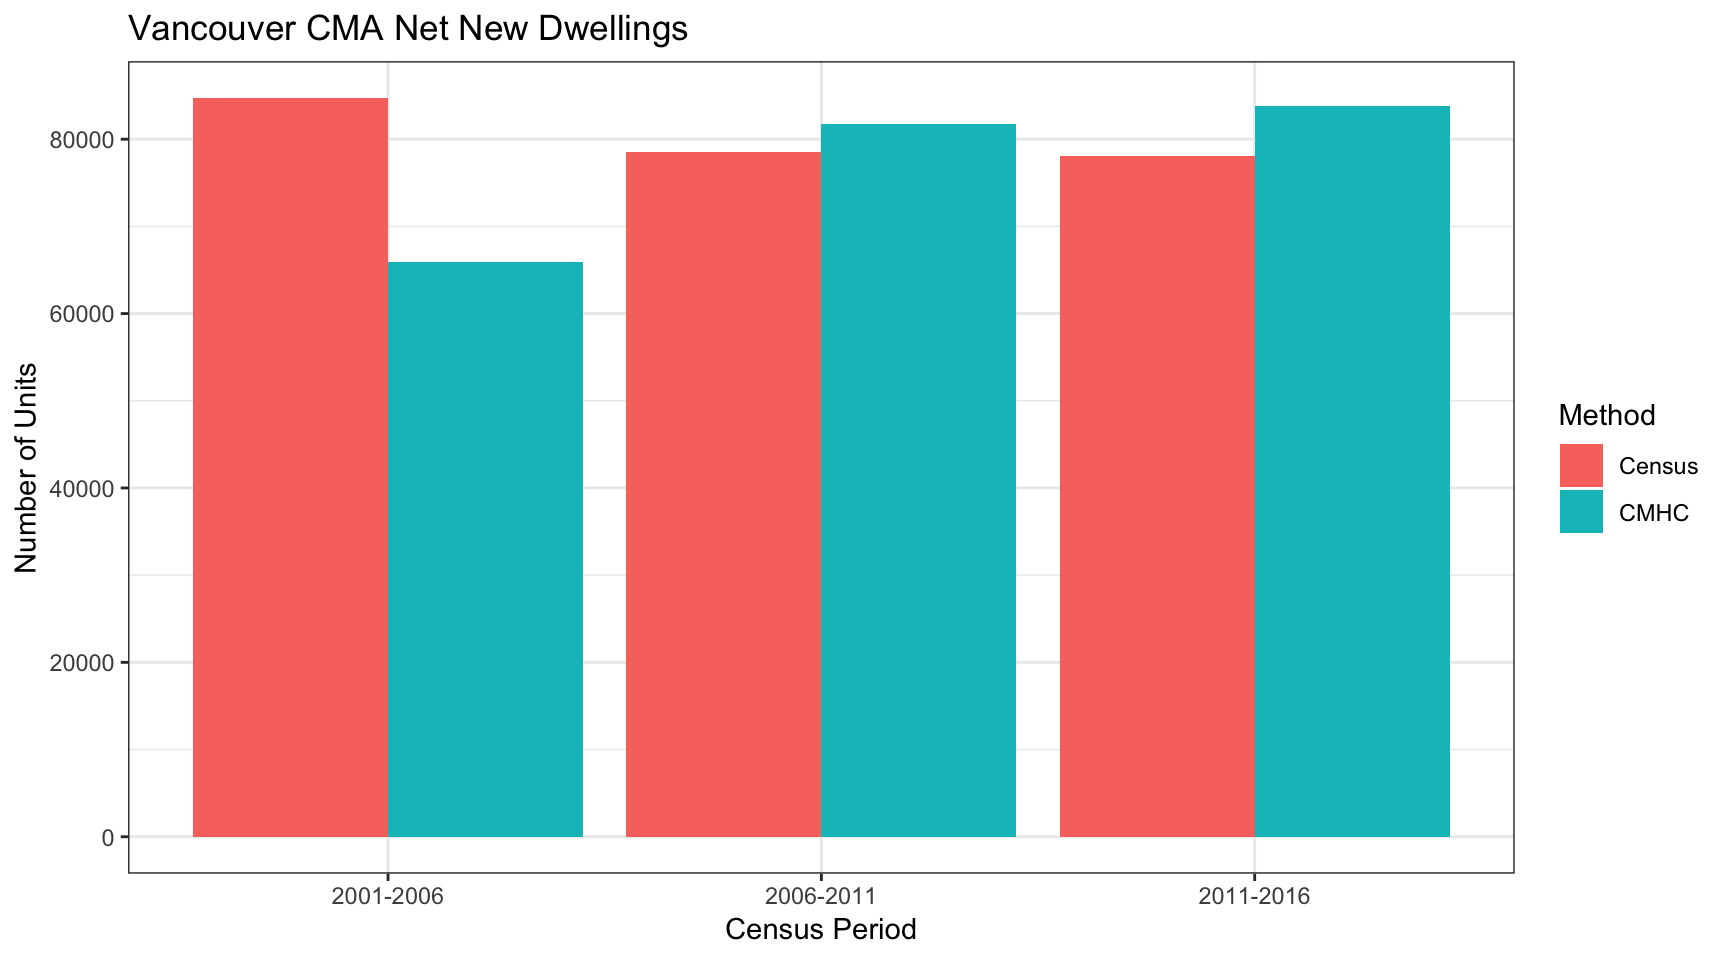
The 2006 to 2016 data is consistent with our suspicion that we are under-counting demolitions, the 2001 to 2006 data is consistent with Nathan Lauster’s observation that the census got a lot better at counting units during that time frame, the census “counted” 18,750 more new units than CMHC minus demolition data did, and chances are good that the gap is bigger if our suspicion is right that we under-count demolitions.
Single Detached and Duplex
To understand better how the change in dwelling enumeration methods has effected the dwelling counts between 2001 and 2006 we can compare the change in single detached and duplex dwelling over the years. First we take a look at the duplex units.

We can see that the number of duplex units increased significantly in many of the metropolitan areas. As the census reference materials state, this is likely due to homes that were classified as single detached in 2001 being classified as duplexes in 2006. So let’s view this in perspective to single detached homes.
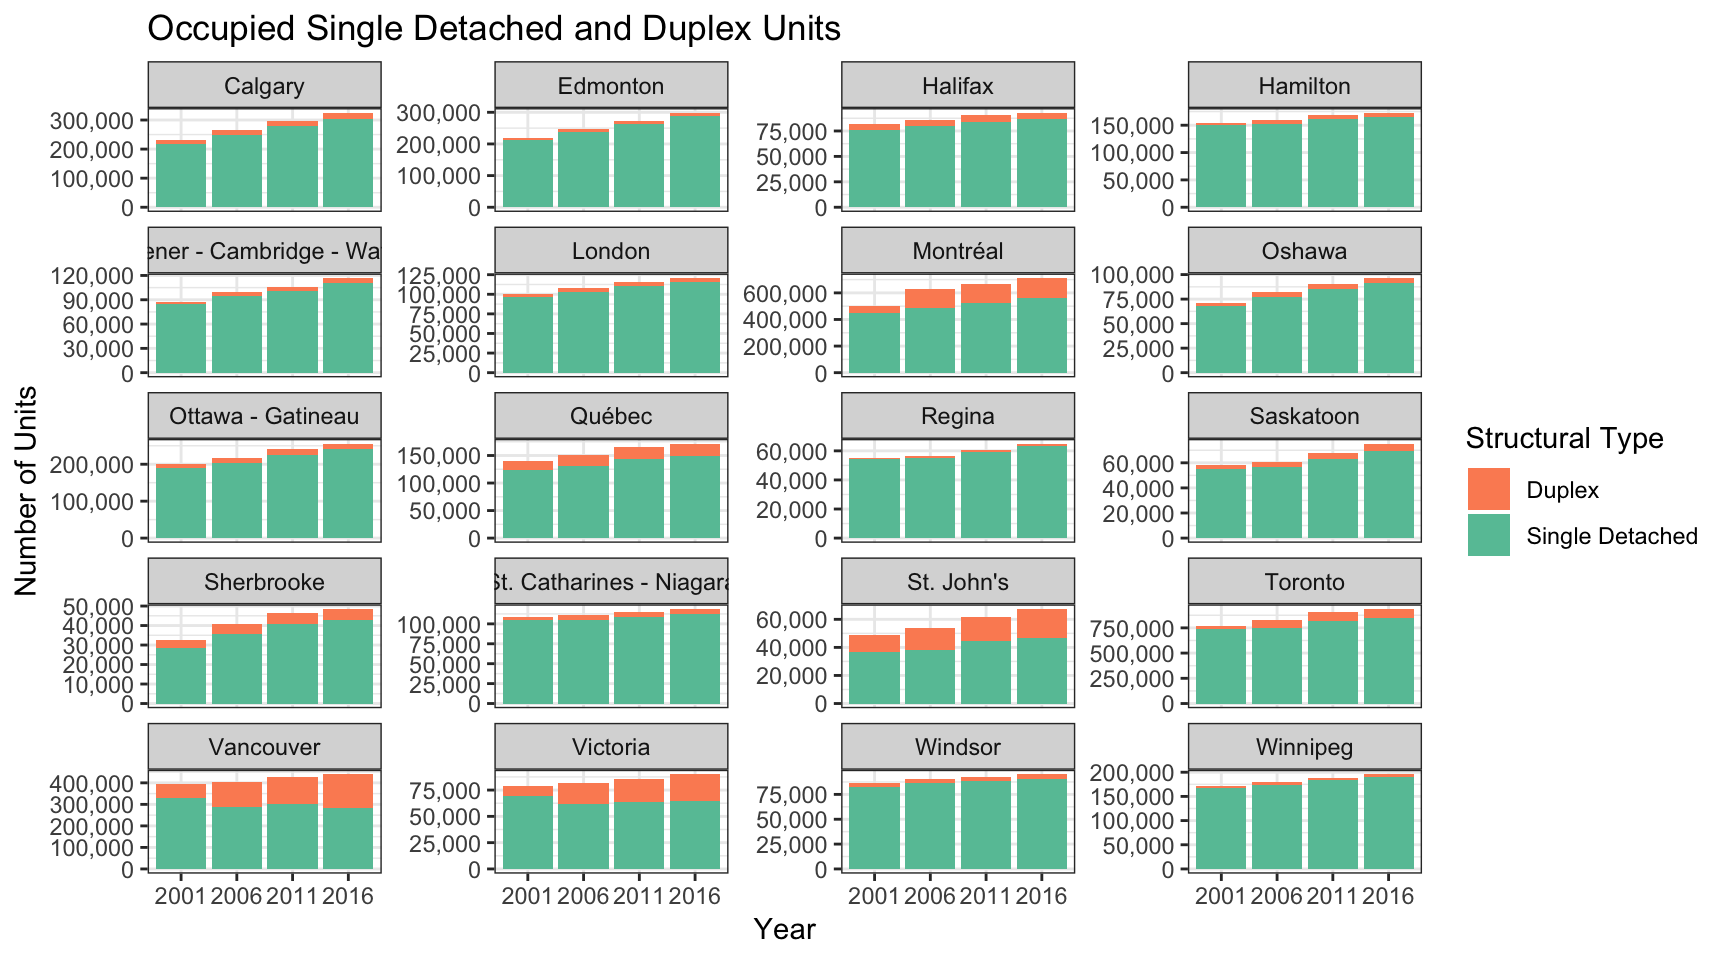
The number of single family homes has been continuously increasing over the years in all metropolitan areas, with the exception of Vancouver and Victoria. The number of single family homes can increase because of more single family homes getting built, or because the CMA expands between censuses. This decrease in single detached homes in the census counts in Vancouver is well known and generally attributed to the census finding existing suites, so reclassifying a single detached unit as two duplex units, as well as single detached homes being converted to duplexes.
There is a number of variables moving at the same time, so this needs some closer analysis. If we assume for now that all single detached and duplex units are occupied, then the number of single family homes plus half the number of duplex units equals the number of lots with single detached or duplex homes on them.

What we see in Vancouver, and to a lesser extent in Victoria, is that the total number of these lots is decreasing under our assumption. And quite substantially so, by 18,102 in Vancouver and 2,085 in Victoria. There are several possible explanations for this:
- the number of lots with single detached or duplexes decreased,
- the census found homes with more than one suite that will then be classified as “apartment, fewer than five stories”,
- there is a big change in units not occupied by usual residents among these,
- suites are much more likely to be not occupied by usual residents.
It is likely a combinations of all of them, but it seems reasonable to hypothesize that the last option, namely that suites are much more likely to be classified as not occupied by usual residents, is responsible for a bulk of that drop. If it were to account for all of the drop we would have 18,102 suites that are not occupied by usual residents, accounting for almost all of the difference in dwelling growth 2001 to 2006 derived from census vs CMHC construction/demolition data. And this is still ignoring the possibility that the number of lots dedicated to single detached and duplex homes has increased in Metro Vancouver over that time period, which would further narrow the gap.
Another way to cross-check these assumptions is to check how many of these duplex units were owner-occupied vs renter-occupied. In Vancouver duplex units aren’t stratified except maybe in exceptional cases. (What is commonly referred to as “duplex” is classified as “semi-detached” in the census.) That means that we would generally expect at least as many units to be renter-occupied as there are owner-occupied if there was no strong bias for unoccupied suites.

But of the 112,250 occupied duplex units in Vancouver in 2006 there were 69,115 owner-occupied duplex units and 43,135 tenant-occupied ones. This compares to 28,875 owner-occupied duplex units and 36,730 tenant-occupied ones in 2001. In summary this is strongly suggesting that a very large number of those newly discovered suites were classified as not occupied by usual residents, explaining pretty much all of the gap between CMHC and census dwelling counts, as well as the jump in units not occupied by usual residents.
To erase all doubt, it would be very helpful to have data on the structural type of dwellings that are not occupied by usual residents. In principle that data should be available to StatCan, and I have asked StatCan for it a couple of months ago without success. This probably requires a concerted effort to find out if it is available and obtain it if it is.
Upshot
To be useful, Rose’s working paper needs … lots of work.
- The way the word “supply” is used should get clarified, and ideally moved more in line with standard literature.
- The issue with the change in enumeration of dwellings needs to be dealt with, using construction and demolition data is one approach, and understanding the changes in more detail by looking at the structural type variable and ideally by getting information on the structural type of units not occupied by usual residents would help.
- The issue with changing CMA boundaries needs to be dealt with, as it stands the “net new dwellings per net new household” metric does not make sense for many CMAs.
- Some of the choices made need to be better explained, I suspect that there is no good reason why Rose chose to use “not occupied by usual residents” instead of simply “unoccupied” as the base of his measure, the language in the paper certainly suggests that Rose wanted to use the latter. I may be guessing wrong, but either way it needs better explanation.
- A clearer statement of what the paper is trying to show, I am missing a hypothesis that the working paper is trying to reject, and a way to quantify that.
Overall I would also appreciate a more transparent work practice that makes it easier to reproduce results and build on it. This post is build from an R Notebook that lives on GitHub and is easily reproducible. If anyone has a different idea how to analyse the data it should be easy to adapt this for their own purposes. Life is too short for everyone to work on their own walled-off arena and leave everyone else guessing at what they did.
Reuse
Citation
@misc{some-thoughts-on-the-supply-myth.2017,
  author = {{von Bergmann}, Jens},
  title = {Some {Thoughts} on the {“Supply} {Myth"}},
  date = {2017-12-11},
  url = {https://doodles.mountainmath.ca/posts/2017-12-11-some-thoughts-on-the-supply-myth/},
  langid = {en}
}
