I keep seeing people circulate claims of the type: The Real Estate Industry makes up x% of British Columbia’s GDP, and apparently I am the last person left that doesn’t know what that actually means. So I decided it’s time for me to catch up. Yesterday I saw a chart that came with a source, a good opportunity to sit down and reproduce it to figure out what the “Real Estate Industry” is, or in this case how to measure the “Addiction to Housing Boom”.
Unfortunately roughly 22% of BC’s economy is dependent on Real Estate. pic.twitter.com/DmuAnpTnHT
— Steve Saretsky (@SteveSaretsky) January 31, 2018
To be clear, I don’t expect to get a crystal clear answer about this, just a better idea what everyone is talking about. It seems to me that we are interested in economic activity associated with residential housing construction, as well as realtor and broker activity and residential real-estate related financial activity.
CANSIM 379-0028
To see what’s in that CANSIM table, we load the data and zoom in the year that we are interested in, remove the grouped categories so that we get a clean split of the individual categories in the dataset. 
The first thing we notice that the dataset does not have data for Canada overall, and that can’t be reconstructed or computed from the dataset since it only contains shares and not totals. So clearly CANSIM 379-0028 was not the source for this data, or at least not the only source.
Next, we need to decided what industries are meant by “Housing Construction and Real Estate”. Looking at the options we guess “Construction” and “Real estate and rental and leasing”. 
So far so good, but the numbers don’t match. Welcome to my world of shitty data forensics, trying to figure out what some graph that got quoted without context is actually showing.
So CANSIM 379-0028 was a dead lead, and I am still no smarter. Time to look for data that is better suited for our question.
CANSIM 379-0030
To get a finer cut at these categories we use CANSIM 379-0030. The first step is to reproduce the data we have already seen. This table has the added advantage of also containing dollar values, so we can also compute the data for Canada overall. And since we have newer data for 2016, let’s use that.

Always good to see we get the same numbers as from the other table (except we chose to use newer data for this plot). Now let’s dive in a little more and decompose these two categories to better understand what’s captured under “Construction” and “Real estate and rental and leasing”.

We immediately notice the biggest contributor, “Real Estate”, which we want to understand better.

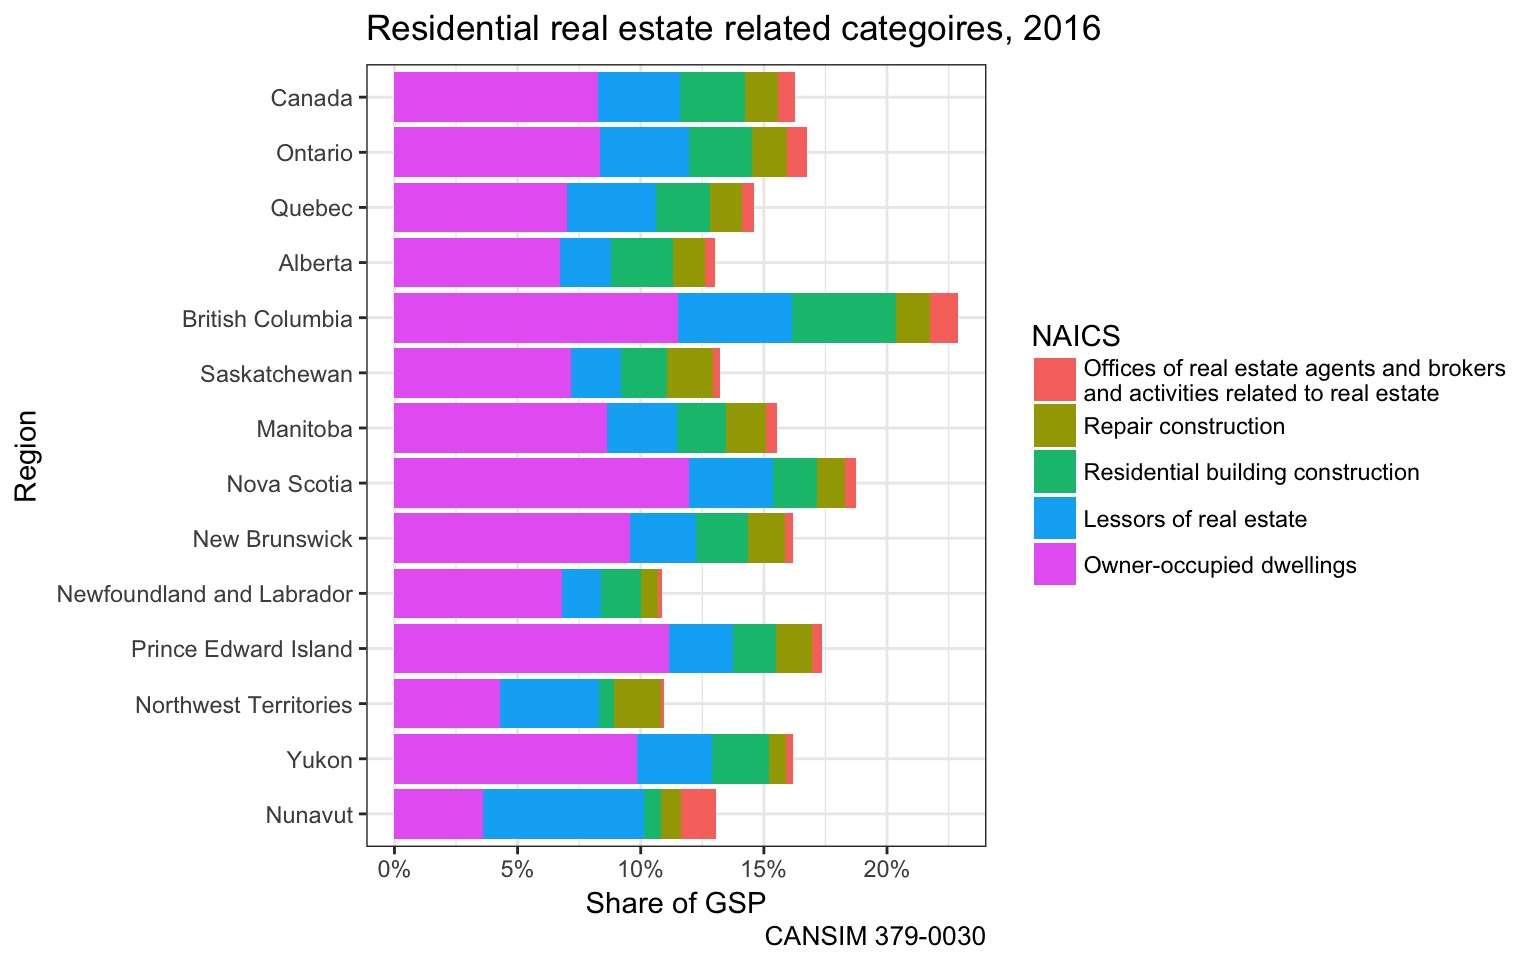
The largest chunk of that is “Owner-occupied dwellings”, which is just imputed rent. The number 2 item is rent, and we see the relative sizes of the “Owner-occupied dwellings” and “Lessors of real estate” vary by province according to the proportion of the households that rents, with 80% in Nunavut renting vs only 23% in Newfoundland and Labrador.
Next up is “Engineering construction”, which is also worth splitting up further.

Rental and leasing services captures “Consumer goods rental”, “General rental centres General rental centres”, and “Commercial and industrial machinery and equipment rental and leasing”.
We can put all sub-categories into a grand overview.

Residential Real Estate Industry
Many of these categories have nothing to do with the residential real estate industry, we need to narrow things down a bit.

This almost reproduces the numbers from the graph we started with, but even if we select 2015 we still overshoot by a couple percent. I will leave it to someone else to dig deeper into what categories exactly were used, or if there are other possible issues. There may be an argument to remove “Repair construction” from the list, but that won’t help with matching the numbers either.
If we want to take a narrower view we can focus in on the core aspects of what people usually associate with the “Residential Real Estate Industry”, construction of residential buildings and agents and brokers. 
We clearly see that British Columbia stands out with exceeding 5% of GDP attributed to this narrow view on the residential real estate industry.
Timelines
While we are at it we might as well look into timelines. To keep things simple we start out with our narrower view of the Real Estate Industry from the last graph.

If we were interested in the broader category including the big-ticket items of rent and imputed rent we can see how those have evolved over time.

Takeaway
These numbers depend to a high degree on what’s included and what is not. The “Residential Real Estate Industry” is complex and hard to pin down. But we can make some assumptions and get some answer. We can compare across provinces and across time.
An important takeaway that the biggest ticket item in the numbers that get ferreted around is imputed rent. Homeowners are certainly a big part of the real estate industrial complex, and the ones that have been the main profiteers from Vancouver’s crazy market.
Rent is the second biggest single ticket item, although Residential construction and real estate agents and brokers combined eclipse it in British Columbia.
British Columbia certainly has a higher share of GDP from residential real estate related activities than the other provinces, no matter if sliced narrowly or more widely. I would be grateful if people making a point about this would link back to what they include and the data they use to that laymen like me know what is actually being talked about. My way of doing this is, as always, providing the code that made the analysis.
Reuse
Citation
@misc{real-estate-industry.2018,
  author = {{von Bergmann}, Jens},
  title = {Real {Estate} {Industry}},
  date = {2018-02-01},
  url = {https://doodles.mountainmath.ca/posts/2018-02-01-real-estate-industry/},
  langid = {en}
}
