The City of Vancouver has put up building permit data yesterday, and Aaron Licker swiftly took a look at the data and teased out some interesting bits.
@VanOpenData @vb_jens @LausterNa Thanks CoV for the new building and demo permit data. There is clearly a pattern with regards to the pace of residential (re)development (ie demolitions) in the City pic.twitter.com/TMdex1OkIc
— Aaron Licker (@LGeospatial) February 22, 2018
We have been asking for this data for quite a while, so we had to take a look too. We wrapped the nasty download, geocoding and general data wrangling into convenience functions, so importing the data into a tidy data frame is pretty simple now. The complete code that made this post is, as always, available on GitHub.
# Vancouver City Outline
vancouver <- get_census(dataset='CA16', regions=list(CSD="5915022"), labels="detailed",
                        geo_format='sf', level='Regions')
# Grab Zoning data and clip to outline
zoning_data <-get_zoning_data() %>% st_transform(st_crs(vancouver)$epsg) %>%
  st_intersection(vancouver %>% select())
# Grab and geocode building permits and join with zoning data
building_permits <- get_permit_data(2017) %>% st_join(zoning_data)
To start off we take a look at what’s in the dataset
plot_data <- building_permits %>%
  group_by(`TYPE OF WORK`,`PROPERTY USE`) %>% summarize(Count=n())
ggplot(plot_data, aes(x=`TYPE OF WORK`,y=Count,fill=`PROPERTY USE`)) +
bar_theme 
Deomlitions (and Abatements)
Looks pretty good. Following Aaron’s footsteps we take a closer look at Demolitions. And throw in Abatements too. Which leads us to our first question. Where are we going with this? What we are really interested in is understanding teardowns, we have had a long fascination with that topic, in fact the first post on this blog was in interactive teardown predictor map, that we have since greatly improved, worked into an interactive data story and further extended by using this to understand the trade offs of embodied vs operating carbon in Vancouver’s Single Family Zoning.
When working on understanding teardowns we tried to obtain demolition data from the City, but were unsuccessful. So we used new buildings as a proxy, while having to be aware that there were a couple of greenfield developments in our time frame (Hello Deering Island!) where new builts may not have been preceded by a teardown. This new dataset adds that missing link, but right now it is only available for 2017 onward.
But we have to be careful with this dataset too, it only contains information about demolition permits, but it does not speak to whether the building in question was actually torn down. There have been prominent cases in the news where buildings were spared even though a demolition permit was issued. But buildings that do get torn down will have a demolition permit issues, and if a new building goes up on that lot we can take that as confirmation that the demolition permit was followed by an actual demolition. This dataset on it’s own only contains building permit data, so again we don’t know if the building permitted was actually built, but assessment data is available to confirm a new built.
In short, what this dataset adds is that it narrows time frames, gives an earlier indication of what might happen and adds some detail that is otherwise not publicly available, like if a new building or a teardown come with permitted suites and for what lots laneway house permits were issues.
In this post we will take the permit data as a proxy for what actually happened, so we treat a demolition permit as a demolition, and a building permit as a new built. One complication is that the same building may have several building permits, or a demolition permit and an abatement permit. So when reporting numbers we will have to make sure we don’t double-count. Our convention for this post is that if a demolition and an abatement happened, we treat that as a single demolition and no abatement. And if a new built and an addition happened, we treat that as a single new built.

The geographic distributions shows that demolitions are concentrated in the Single Family (RS) neighbourhoods.
base_map +
  geom_sf(data=demo_data, aes(color=`TYPE OF WORK`) ,size=0.3) +
  labs(title="Demolitions and Abatements in 2017")
We narrow down our focus to these areas and look at what kind of buildings get torn down or abated.
plot_data <- demo_data %>% filter(CATEGORY=="One-Family Dwelling",`PROPERTY USE`=="Dwelling Uses")
base_map +
  geom_sf(data=plot_data, aes(color=`Specific Use`) ,size=0.3) +
  labs(title="Demolitions and Abatements in 2017",caption="CoV Open Data", color="Type")
To better understand the change in the building stock we want to look at the overall count in permits in more detail.

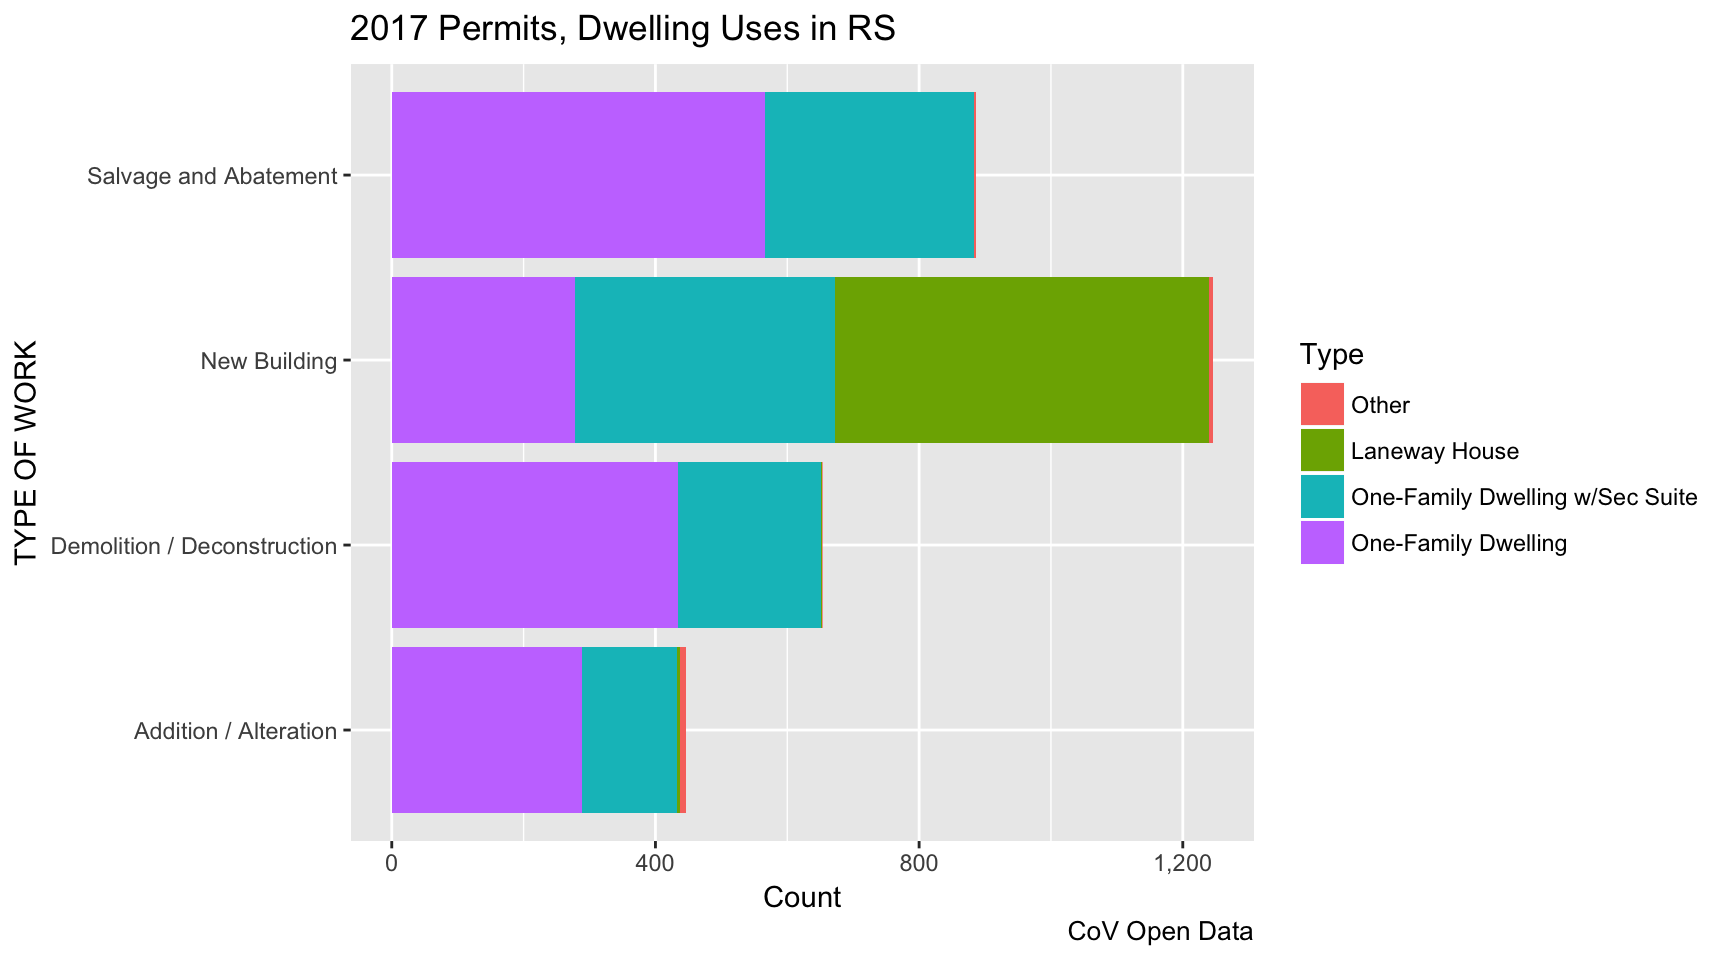
We see that Laneway Houses are a net add to the overall building stock, with 568 permits issued. The total number of demolition permits for Single Family Homes is about the same as the number of demolition permits, but the new builts have a higher proportion of permitted suites at 58.6% compared to 33.3% in demolitions. But we should remember that there are a lot of unpermitted suites in Vancouver.
Estimating secondary suites in Vancouver
Estimating secondary suites relies on exploiting the different ways to count housing units between BC Assessment and the census. BC Assessment counts properties, so for our purposes lots with single family homes on them. For us that means lots with either a single detached house, or ones with a single detached house with a permitted suite on them. There are roughly 75k of these in Vancouver.
We have explained the census categories for dwellings before, to match these we start by counting up the single detached houses (so un-suited) houses the census found. There were 41,330 occupied single detached homes, 290 occupied by temporary or foreign residents and 1,955 unoccupied ones, adding up to a total of 43,575 single detached houses. The census counts laneway houses as their own single detached house. The city does not release up-to-date counts on laneway houses, CMHC counted 1,668 completed laneway houses before May 2016. Permit data by the city suggests that this is an under-count, but we will just go with that number for now, partially accounting for the census not finding all of these.
In conjunction that means that the census found 41,907 single family lots with no secondary suite, which leaves us with 33,093 single family lots that do have at least one secondary suite. This comes out to be 44% of single family homes having at least one suite. We will stop here for today and leave it for someone else to estimate how many of these have more than one secondary suite.
This exercise shows us that we are likely demolishing more suites than the permit data suggests, with the difference being made up by permitted suites. But it also shows that the number of suites is likely still growing in the City as the share of new single family homes with suites is significantly higher. But as we have explained in detail before suites are a strange part of our dwelling stock that end up registering as unoccupied at a higher rate than any other building type in Vancouver. So it takes more work to understand if and how much new dwelling units for people to live in this sizable construction activity in Single Family land actually produces.
As Aaron has pointed out before, this construction activity comes with a high cumulative price tag.

If we look at demolition, abatement and additions for Single Detached and Suited Single Detached throughout the city (not just in RS) in 2017 the total permit value adds up to $673,952,171, while adding very few units to live in.
Neighbourhoods
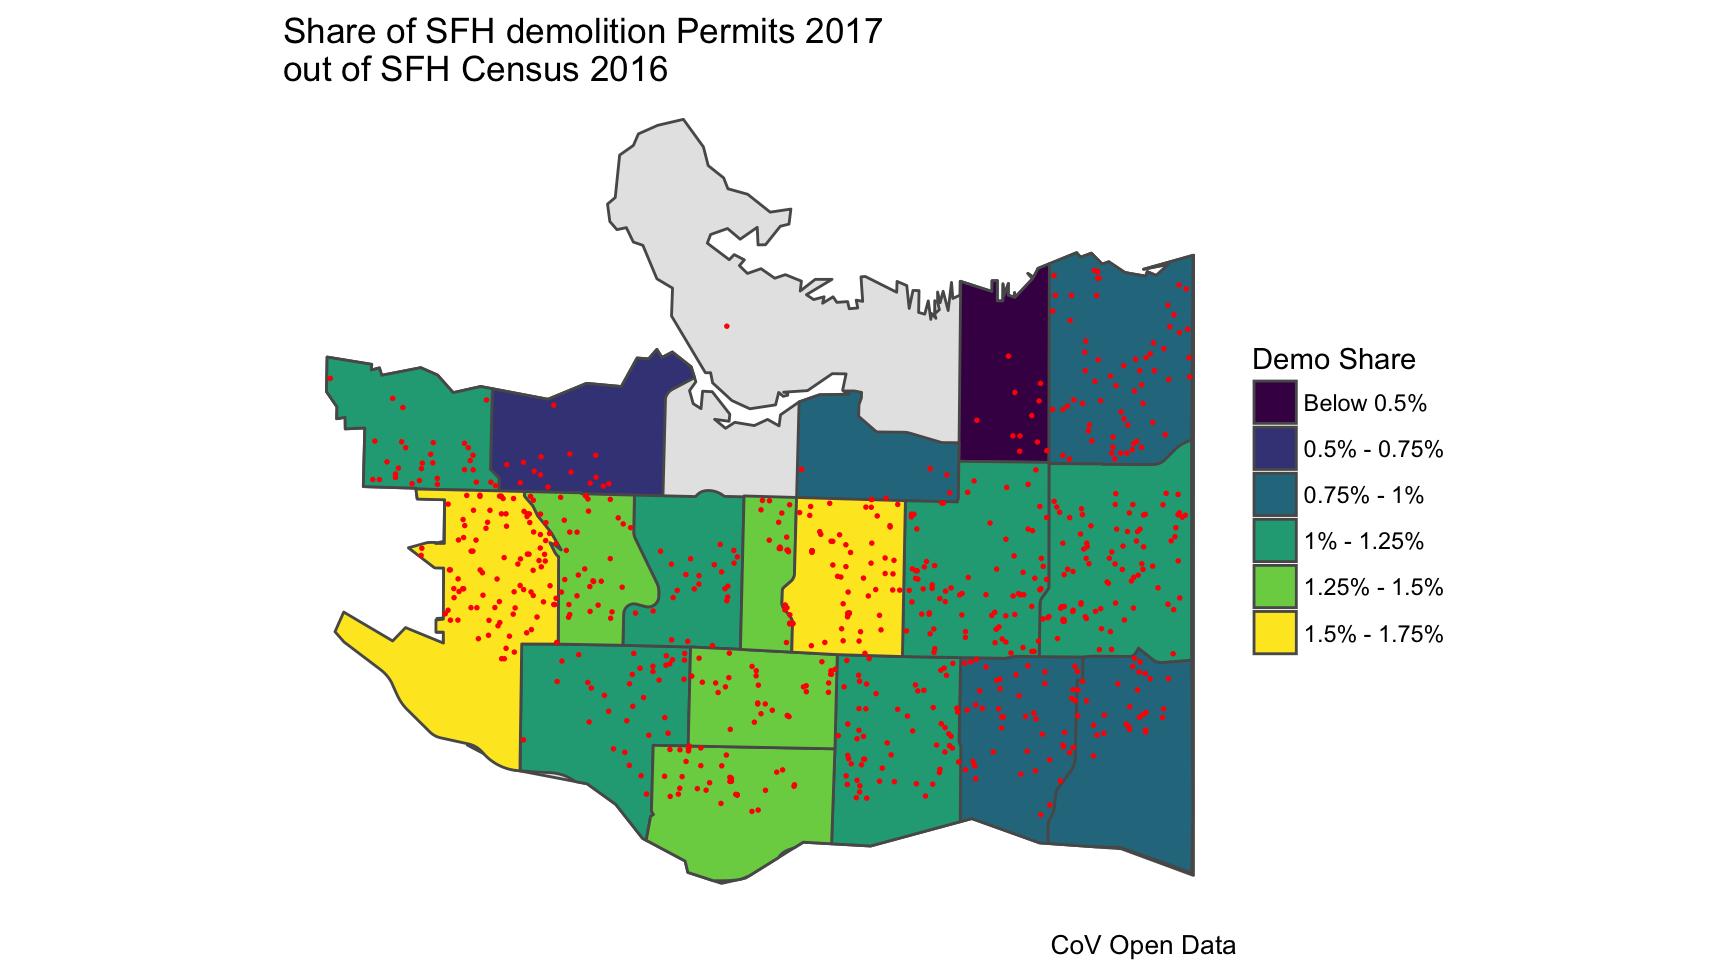
Another way to look at the data is to follow Aaron’s lead and compare demolitions to the existing building stock. We will take CoV neighbourhoods as our base geography and only look at Single Family lots. For the census we restrict ourselves to occupied units for convenience since the CoV custom tabulation did not pull information on the total building stock. From that we estimate the number of SFH lots in each region by taking the number of single-detached units plus half the number of duplex units. As we have explained above, that’s only a rough estimate and could be off by a bit in either direction, but it’s good enough for our purposes. We will compare this to SFH demolition permit data.

Interested in taking this further or explore different aspects of the data? The complete code that made this post is available on GitHub, just grab it and modify as you see fit.
Reuse
Citation
@misc{building-permits.2018,
  author = {{von Bergmann}, Jens},
  title = {Building {Permits}},
  date = {2018-02-22},
  url = {https://doodles.mountainmath.ca/posts/2018-02-22-building-permits/},
  langid = {en}
}
