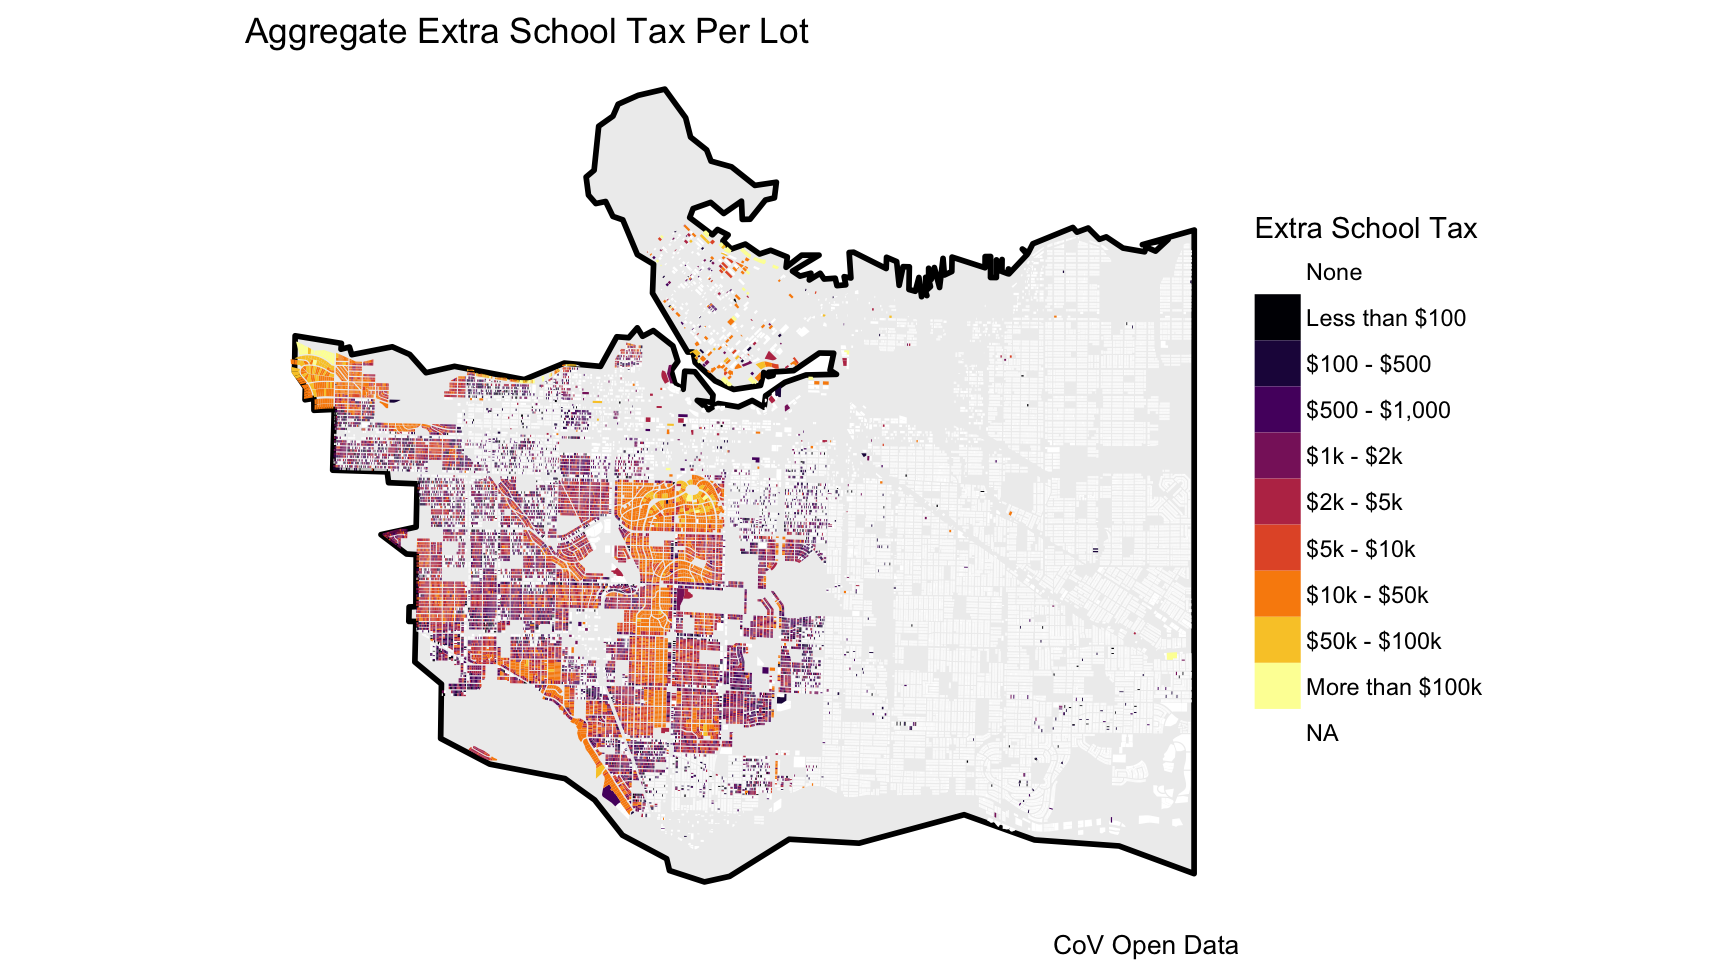
The new BC provincial budget had lots of interesting changes. One of them is the additional school tax on residential properties, charged at a rate of 2 basis points (0.002) of the assessed value above $3M and an additional 2 basis points of the assessed value above $4M.
After some initial confusion the province clarified that this tax will not to apply to purpose built rental buildings, each of which is typically one single taxable property, which can easily breach the $3M threshold for multi-unit buildings. This would have resulted in a hit of a little over $100 per unit per month for the average rental unit, which would not apply to a similar condo development because the it would be applied to each individual unit, few of which would break the $3M threshold.
Separating out all properties the tax applies to is not as trivial as it should, mostly because the data needed to determine this is not public. But we can get a pretty good approximation my merging CoV open data on property parcels, zoning, tax data and Metro Vancouver land use data. I will skip the details, people that will want to know how it’s done most likely already know this.
Narrowing down to residential land uses, throwing out the purpose built rental buildings and the commercial components of mixed use properties, we see that the new school tax will apply to roughly 21k properties and adds up to around $115M in revenue for properties within the City of Vancouver. There is a slight bit of uncertainty in these estimates as we may not be properly catching the most recent developments, might not properly filter renter building get caught in data problems when merging data sources that aren’t perfectly in sync, but this gives us a good base to understand the impact of this tax.
To understand the geographic distribution of these we can aggregate the total tax payable up by physical lot. For single family homes, there is nothing to aggregate, but for condo buildings (or land strata) we want to sum up all the extra tax for each individual condo unit (if any) and visualize the resulting total for the entire building.

Overall the tax mostly hits single family homes, around 20k for a total of $100M. The remaining 2k units hit by the tax are mostly condos, adding up to a total of $15M.
Geographically, the west-side single family homes dominate. But those aren’t the properties that generate the highest school tax. Some of the high-value condo buildings rack up more as the top 20 list shows:
| Rank | Address | Extra Tax |
|---|---|---|
| 1 | 277 THURLOW ST | $1,504,478 |
| 2 | 1011 CORDOVA ST W | $1,255,520 |
| 3 | 1139 CORDOVA ST W | \(1,052,272 | | 4|1169 CORDOVA ST W |\) 750,152 |
| 5 | 1281 CORDOVA ST W | $ 649,738 |
| 6 | 1233 CORDOVA ST W | $ 646,782 |
| 7 | 323 JERVIS ST | $ 592,002 |
| 8 | 428 BEACH CRES | $ 569,882 |
| 9 | 1328 MARINASIDE CRES | $ 559,246 |
| 10 | 1560 HOMER MEWS | $ 525,500 |
| 11 | 181 ATHLETES WAY | $ 374,896 |
| 12 | 1717 BAYSHORE DR | $ 353,756 |
| 13 | 3085 POINT GREY RD | $ 301,348 |
| 14 | 4707 BELMONT AVE | $ 273,280 |
| 15 | 1060 ALBERNI ST | $ 198,032 |
| 16 | 1007 MAIN ST | $ 177,012 |
| 17 | 1155 MELVILLE ST | $ 174,952 |
| 18 | 4719 BELMONT AVE | $ 172,736 |
| 19 | 2815 POINT GREY RD | $ 169,500 |
| 20 | 1465 HASTINGS ST W | $ 159,744 |
As always, the code that made this post is available on GitHub.
Reuse
Citation
@misc{extra-school-tax.2018,
  author = {{von Bergmann}, Jens},
  title = {Extra {School} {Tax}},
  date = {2018-02-28},
  url = {https://doodles.mountainmath.ca/posts/2018-02-28-extra-school-tax/},
  langid = {en}
}
