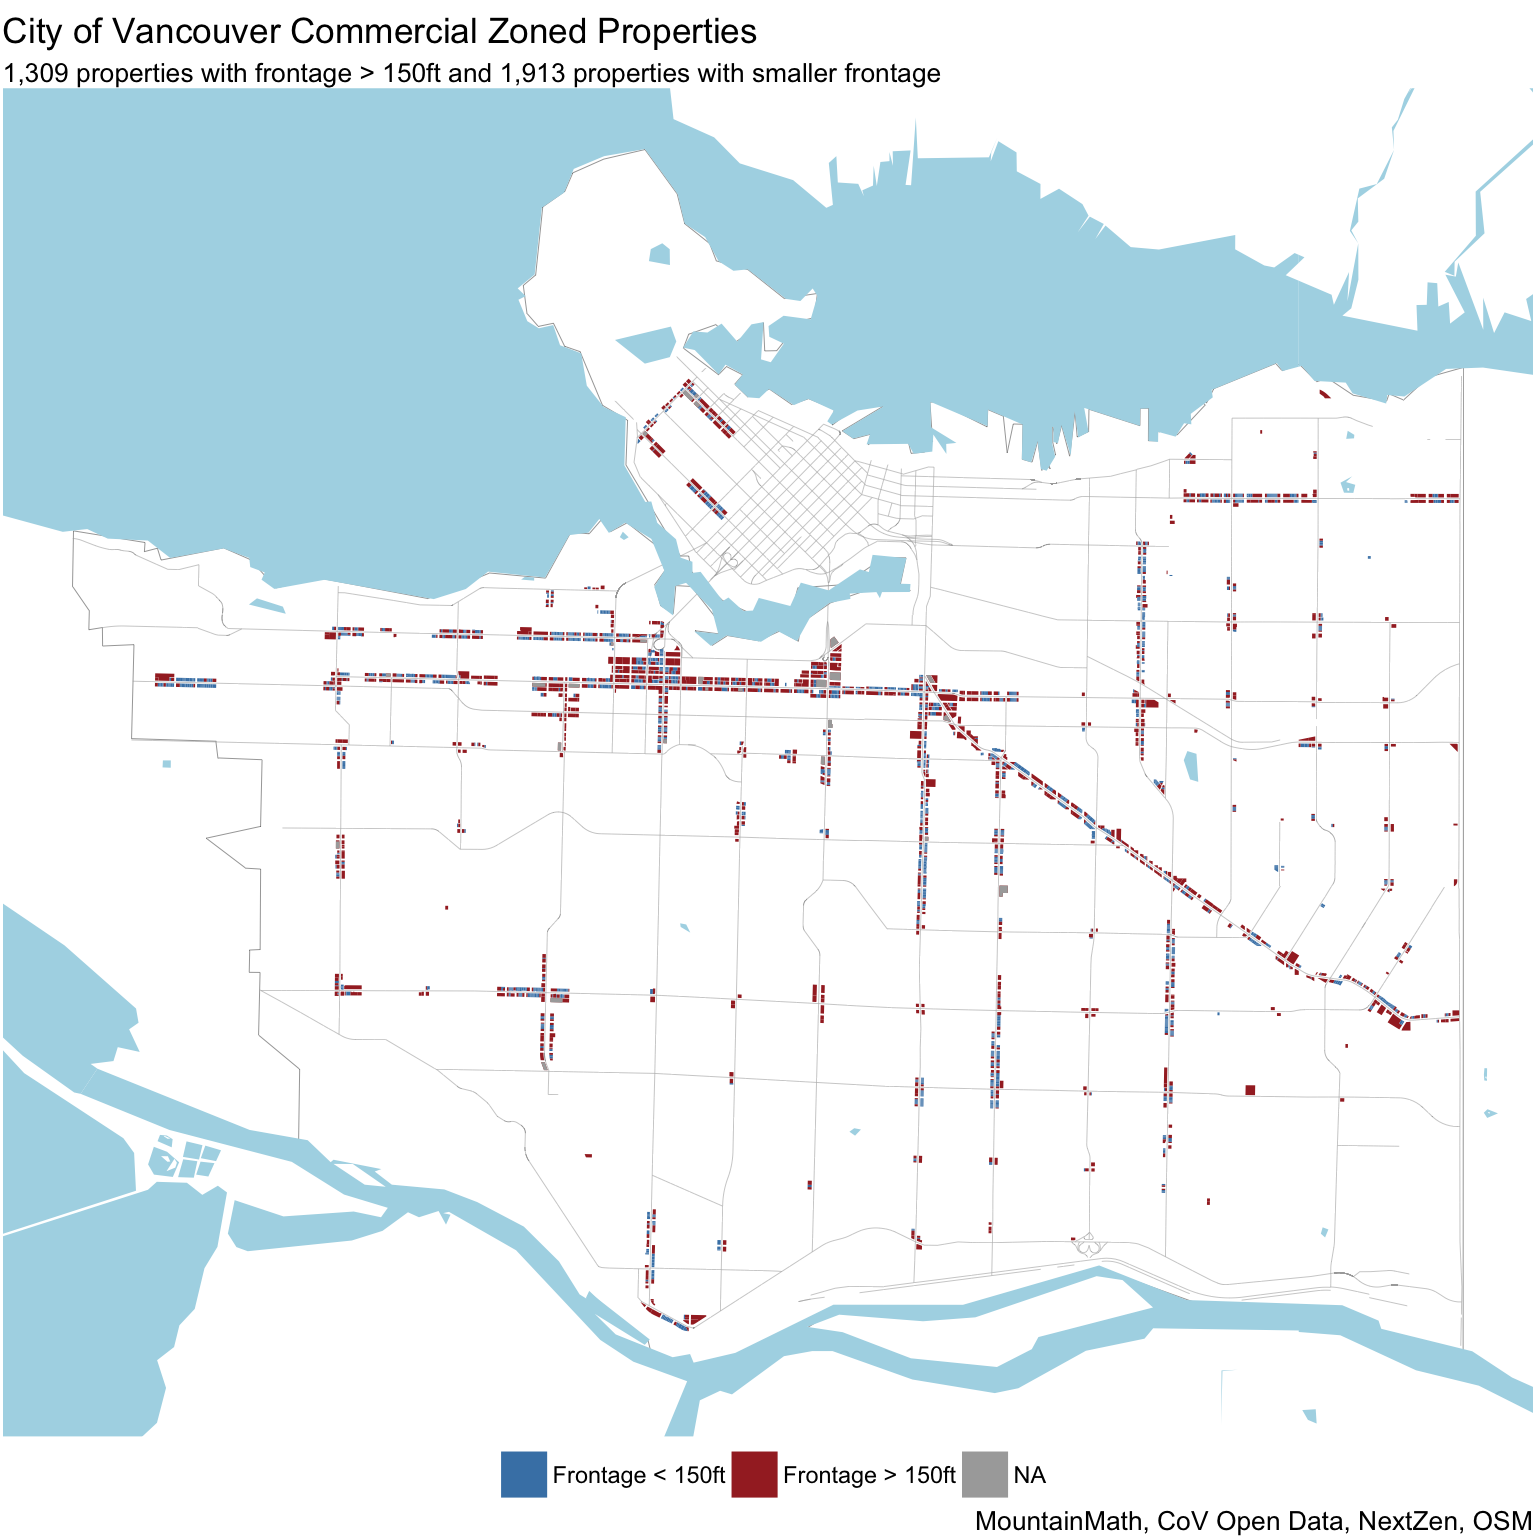
Over the past years several people have asked me questions about street frontage of city properties. When I needed similar data for a work project, and Scot Hein asked me a question about frontages of commercial properties for his Urbanarium debate, I decided to finally pull the numbers. The answer to that question is not as straight forward as it might seem, mostly because properties aren’t necessarily square. There are a couple of algorithm that can solve this problem, but in this case we can keep things reasonably simple as the City of Vancouver has property frontages listed on VanMap and make the data available on their Open Data Portal.
Scot was particularly interested in the frontages in the commercial zones along the arterials. The ingredients we need to answer that question are:
- The property parcel polygons.
- The lot lines and dimensions.
- The zoning data for each lot.
- The streets data.
All of these can be found on the City of Vancouver open data portal. I’ll spare you the details on how I chose to match things up, if you need to know you can just download the R notebook that made this post and look at the code.
As an aside, at this years open data day event I was reminded that there can be high entry barriers to using CoV open data. At this point I have a highly processed database that I usually use for this kind of questions, but with a narrow and clearly defined question at hand I thought it might be a useful exercise to build the data from scratch so that others have the benefit of being able to fully reproduce and adapt the analysis.
There will be essentially no commentary in this post, Scot will have done a did a better job adding context than I can. Sadly I am out of the country and will have to watch the recording once it gets posted.
Commercial zoned properties by frontage
To understand how many properties there are with frontages smaller and larger than 150ft, and what the finer distribution of frontages is, we graph them by frequency and cumulative area.

Building Age
Building age is another important variable in this, as we generally expect higher re-development pressure on older buildings.

We can view the properties by number or cumulative area.

Relative Building Value
The relative building value may is a more direct measure of development pressure, as we have explained in detail previously.


Geographic distribution
Another important dimension is the geographic distribution of these lots.

While there is some bunching when it comes to narrow and wide lots, there is quite a bit of dispersion and we can find both, narrow and wide lots, in all areas.

Similar things can be said about the teardown pressure facing these lots. There are some areas visible where building values have somewhat kept up with land values, but there are plenty of sites facing high teardown pressure in all neighbourhoods.
Again, for those wishing to reproduce the results or adapt it for their own purposes, the code is available in GitHub.
Reuse
Citation
@misc{frontage.2018,
  author = {{von Bergmann}, Jens},
  title = {Frontage},
  date = {2018-03-28},
  url = {https://doodles.mountainmath.ca/posts/2018-03-28-frontage/},
  langid = {en}
}
