I haven’t taken time yet to dive into the council candidate’s data game, Christopher Porter has been tearing it up with great posts, one on candidate location, several on their position on various housing issues and a compilation of endorsements.
Dmitry Shkolnik has been running some analysis on candidate’s tweets.
Nathan Lauster dove into the urbanist / preservationist divide first crowdsourced by the Cambie report.
Better late than never, I decided to jump in and look at candidate’s neighbourhoods. The immediate surrounding of candidates should give some clues about who they interact with on a daily basis, at least for the candidates that are connected with their neighbourhoods in ways other than just driving through them to get to their home.
For this we grab census data form the 500m radius around their rough home location, geocoded from the zip codes that Christopher Porter copied from the disclosure documents and shared via a spreadsheet linked in his blog post.
Between mayor and council there are lots of candidates to make a really messy map of where they live and the neighbourhoods we consider.

From here we use our standard tools to grab census data for a couple of variables from the 2016 census and use our tongfen package, as well as the down-sampling from out dotdensity package, to estimate the variables in the given neighbourhoods. (Check the code if you need to know the details.)
Transportation and tenure
We start by mapping out the active transportation (walk, bike, transit) to work and share of renter households.

Active transportation correlates strongly with renter households, and this is also reflected in the graphs. We see that most parties cover a broad spectrum, except Coalition Vancouver (and to a lesser extent Vancouver 1st) that seem to bunch in the lower-left quadrant. I was surprised to see that COPE also does not reach out into the upper-right quadrant.
Dwelling value and household income
No post about Vancouver is complete without talking about dwelling values and household income.

Coalition Vancouver, as well as some independents, score high on the dwelling value and the income scale, with NPA nd Vancouver 1st the only other parties to crack the $2M dwelling value mark.
Adjusted after-tax family income
Adjusted after-tax family income is probably a better way to compare income, so here a little graph on how the parties pan out in this scale. Not much surprising here with most bunching in the middle, as income distribution in Vancouver is quite uniform.
We divided the income distribution into “Low” (bottom 30%), “Middle” (middle 40%), and “High” (upper 30%). The shares are relative to Canada’s overall adjusted after-tax family income distribution.

We see that only independents and ProVancouver have candidates in predominantly low-income areas. Both Coalition Vancouver and independents have candidates in predominately high-income areas.
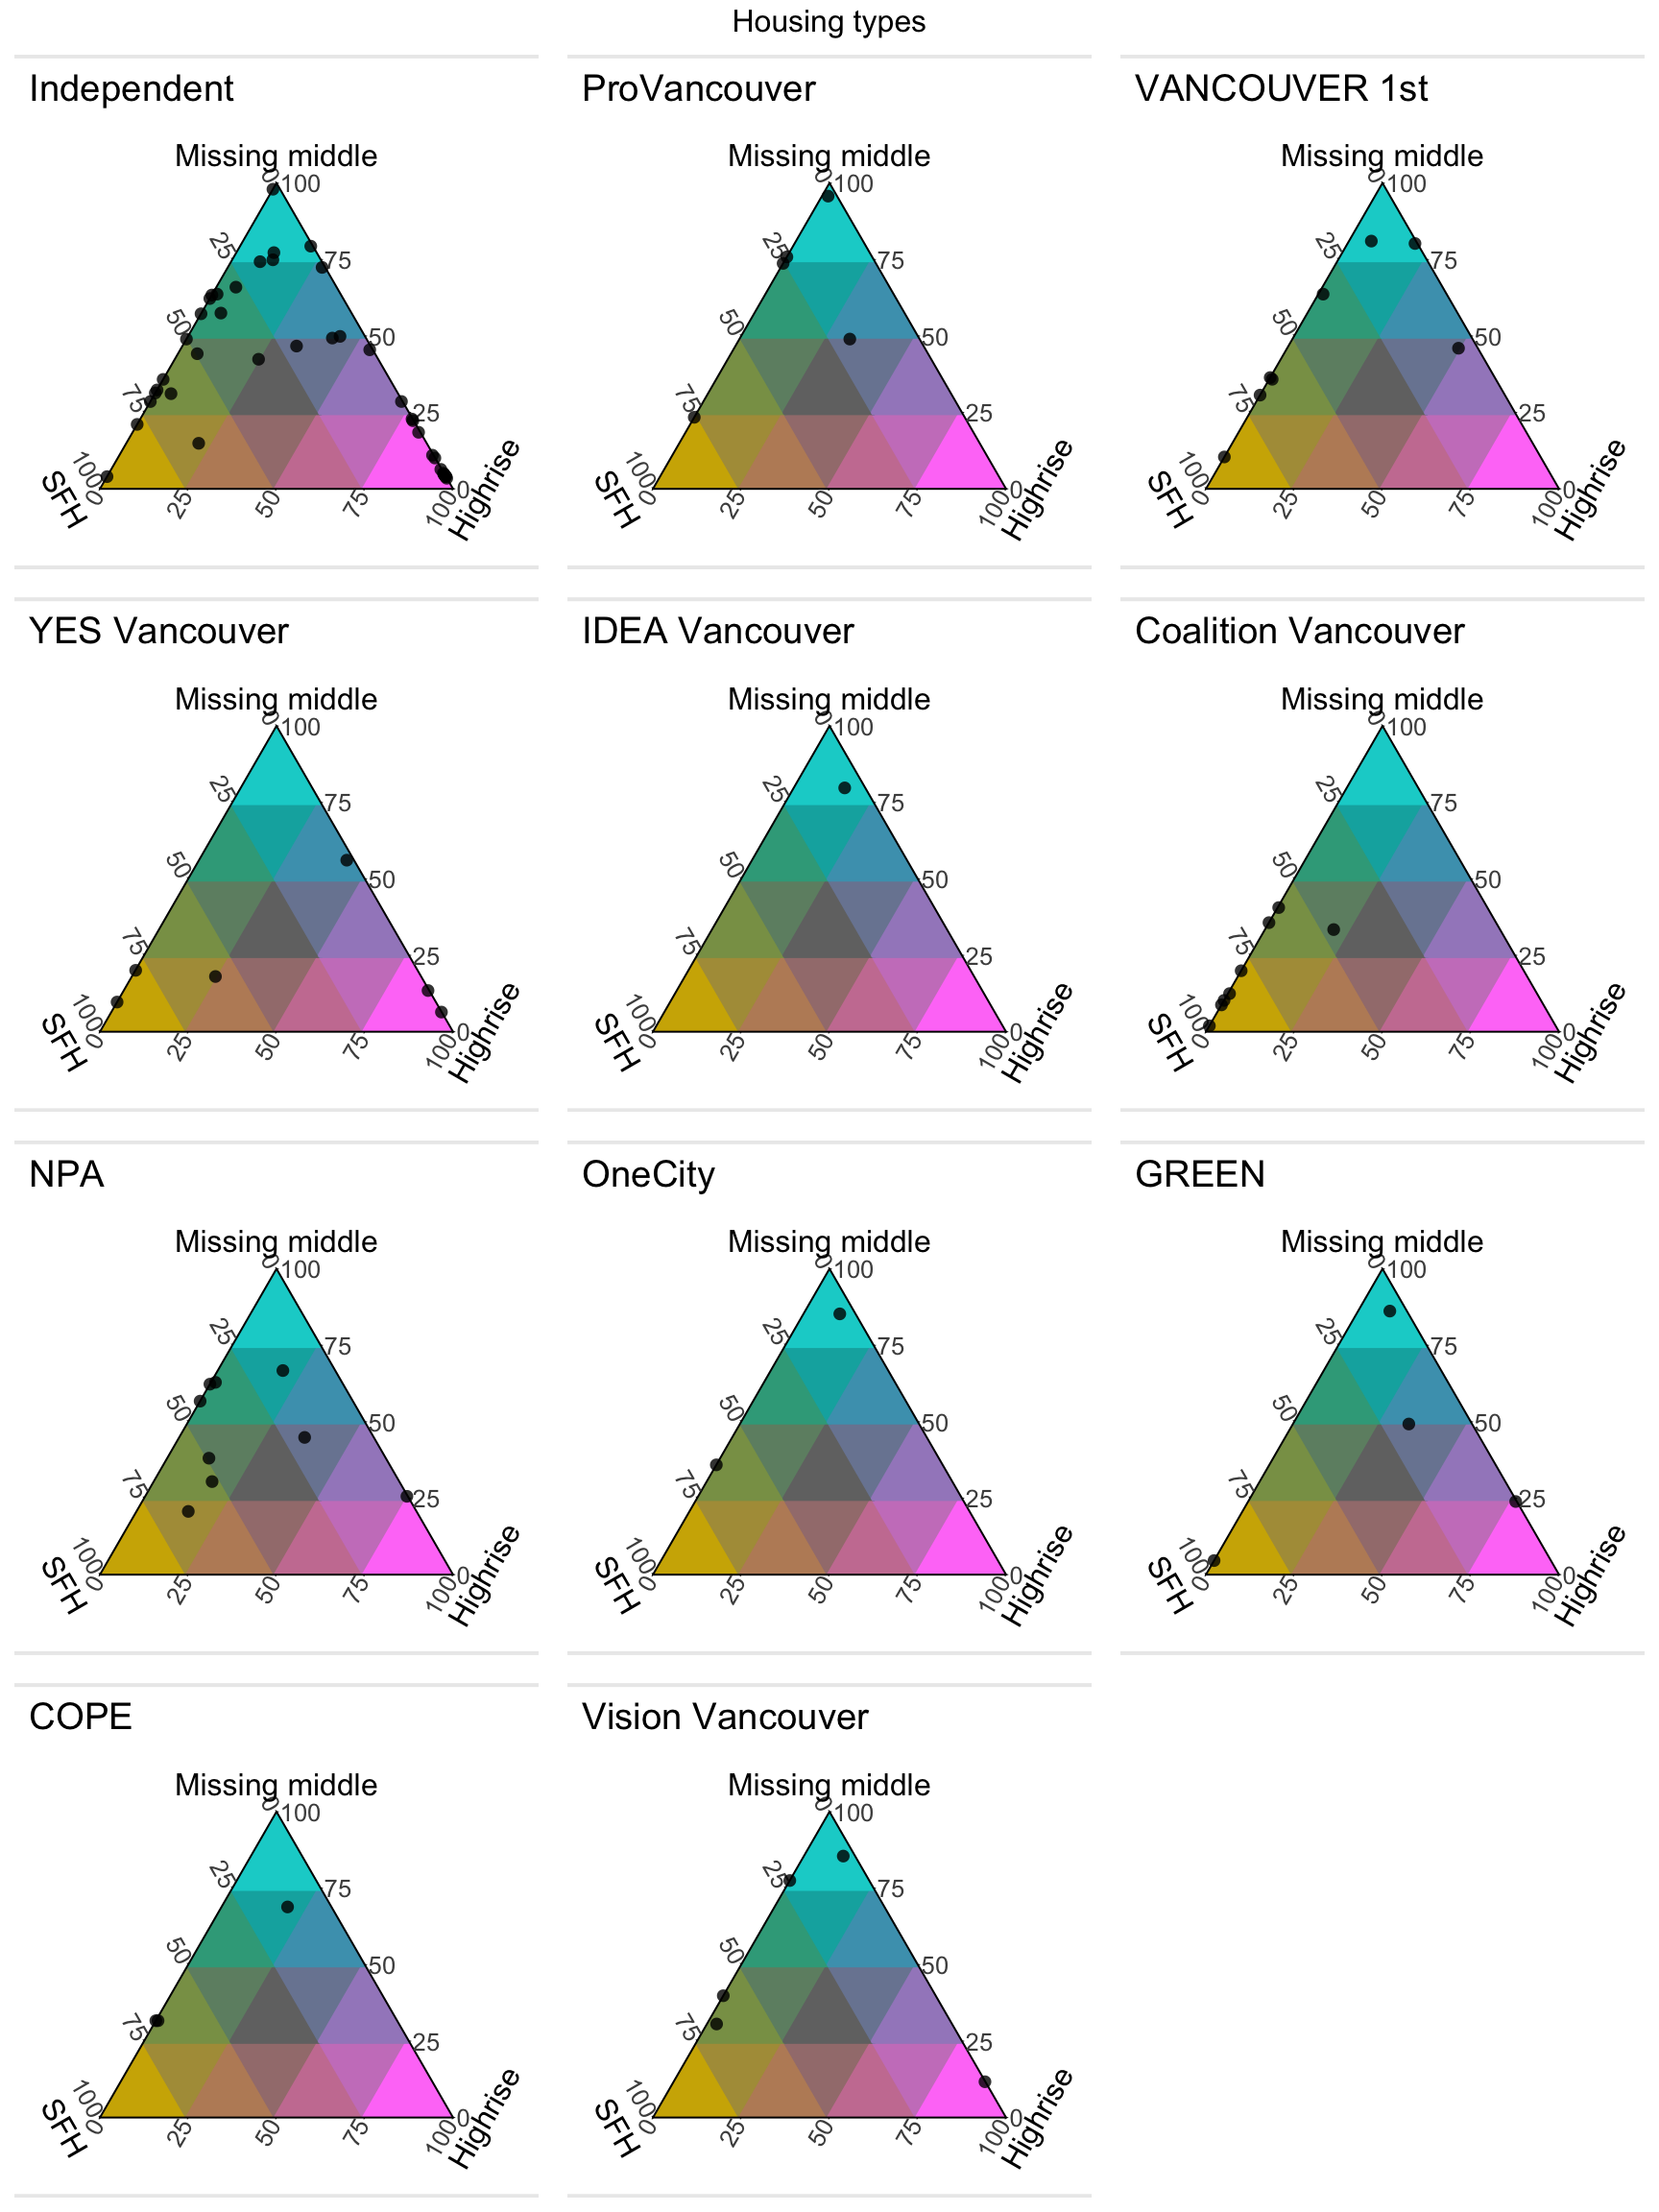
Housing types
When it comes to housing types, there is a much greater variety. We divided the structural types into “SFH” (single detached and suited single detached), “Missing middle” (Duplex and row/town houses and low-rise (four or fewer storeys)), and “Highrise” (five or more storeys). This is the same split that we have mapped on CensusMapper before.

Population change and density
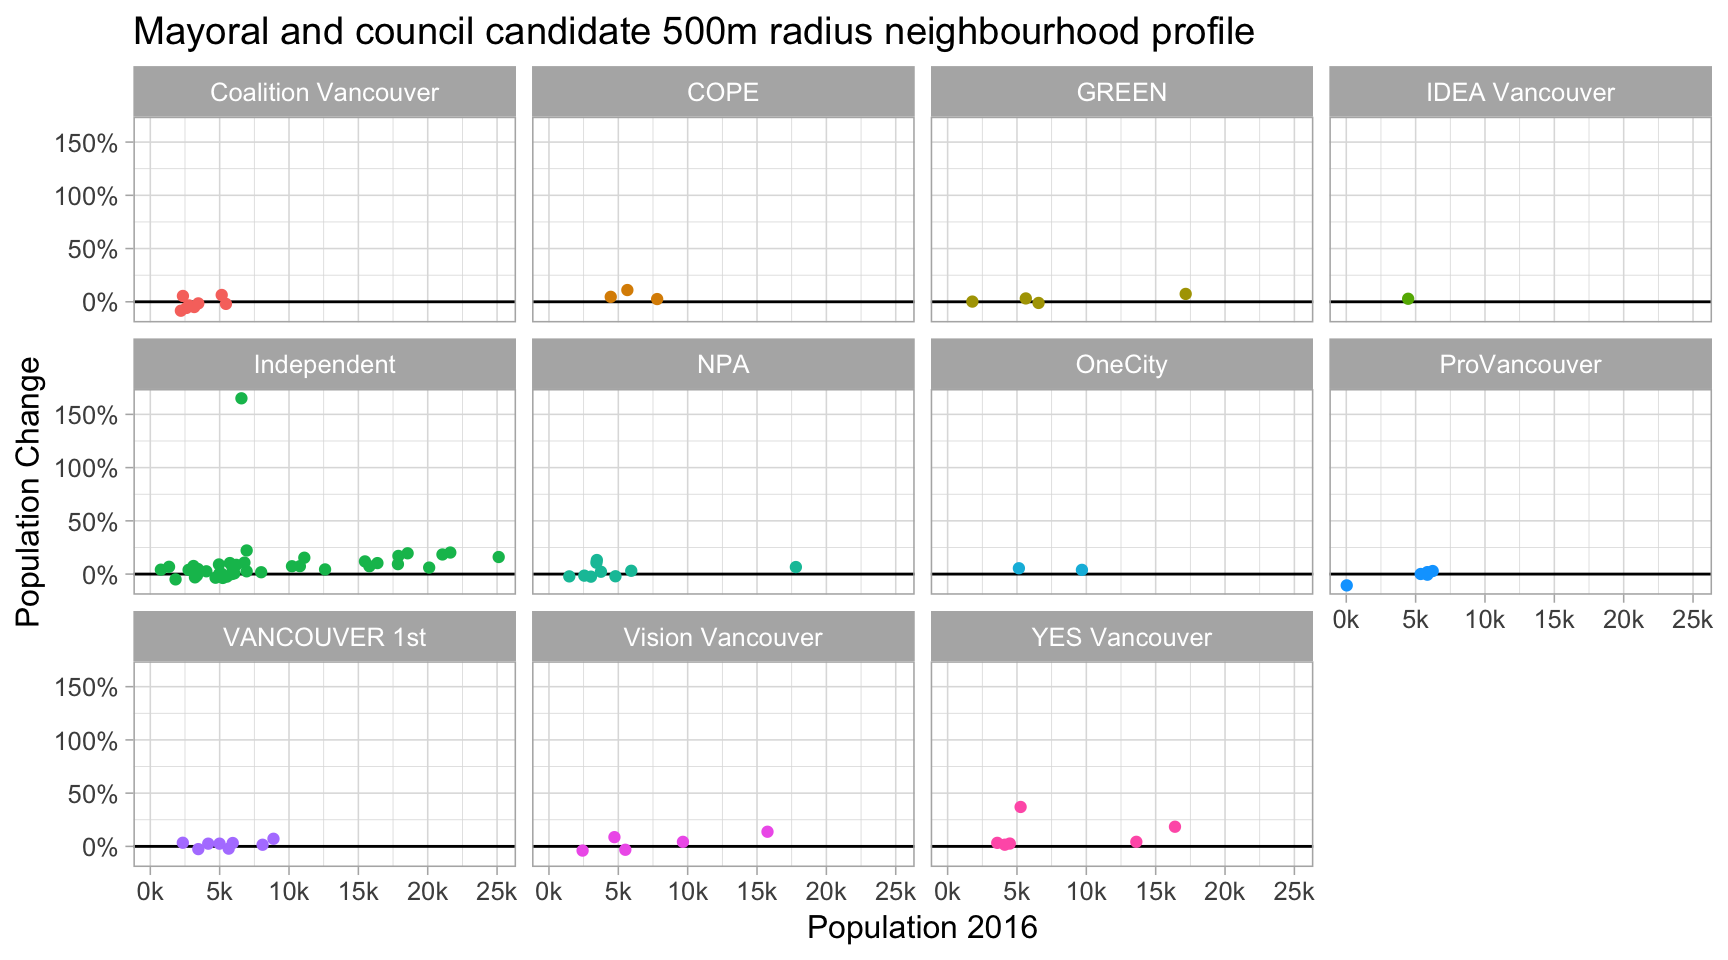
Another much talked about metric in this election is population change and density.

That huge outlier in terms of population change is Justin Caudwell, who apparently lives in the Olympic Village. Coalition Vancouver is quite heavily invested in areas with losing population, with only COPE, IDEA Vancouver, OneCity and YES Vancouver running no candidate living in neighbourhoods that lost population.
To focus in on this we graph just the population change.

Upshot
This adds another perspective to what may inform the candidate’s position. As always, the code is available on GitHub, feel free to grab it and reproduce the post, add different metrics or expand on this in other ways. To compute the population change we made use of an internal CensusMapper tiling that gives 2011 and 2016 data on a common geographies. To access this, you will have to grab the “label-fix” branch on the cancensus package until this is merged into master and the CRAN version gets updated. It also uses a fork of the tricolore package in order to get more control over the triangle plots.
Reuse
Citation
@misc{council-candidate-neighbourhoods.2018,
  author = {{von Bergmann}, Jens},
  title = {Council Candidate Neighbourhoods},
  date = {2018-10-13},
  url = {https://doodles.mountainmath.ca/posts/2018-10-13-council-candidate-neighbourhoods/},
  langid = {en}
}
