One week ago the new batch of CHSP data on ownership of residential properties in British Columbia, Ontario and Nova Scocia came out, and I tweeted some quick graphs. While there has been reporting on some aspect of the numbers in the news a couple of days after, it struck me that this did not really hit all the questions that are on the public mind that the data can address.
Thus a quick post serving two purposes, putting a couple more graphs and data points into the public eye and providing the code to reproduce the visuals and serve as a launching point in case others want to further explore different angles.
Multiple ownership
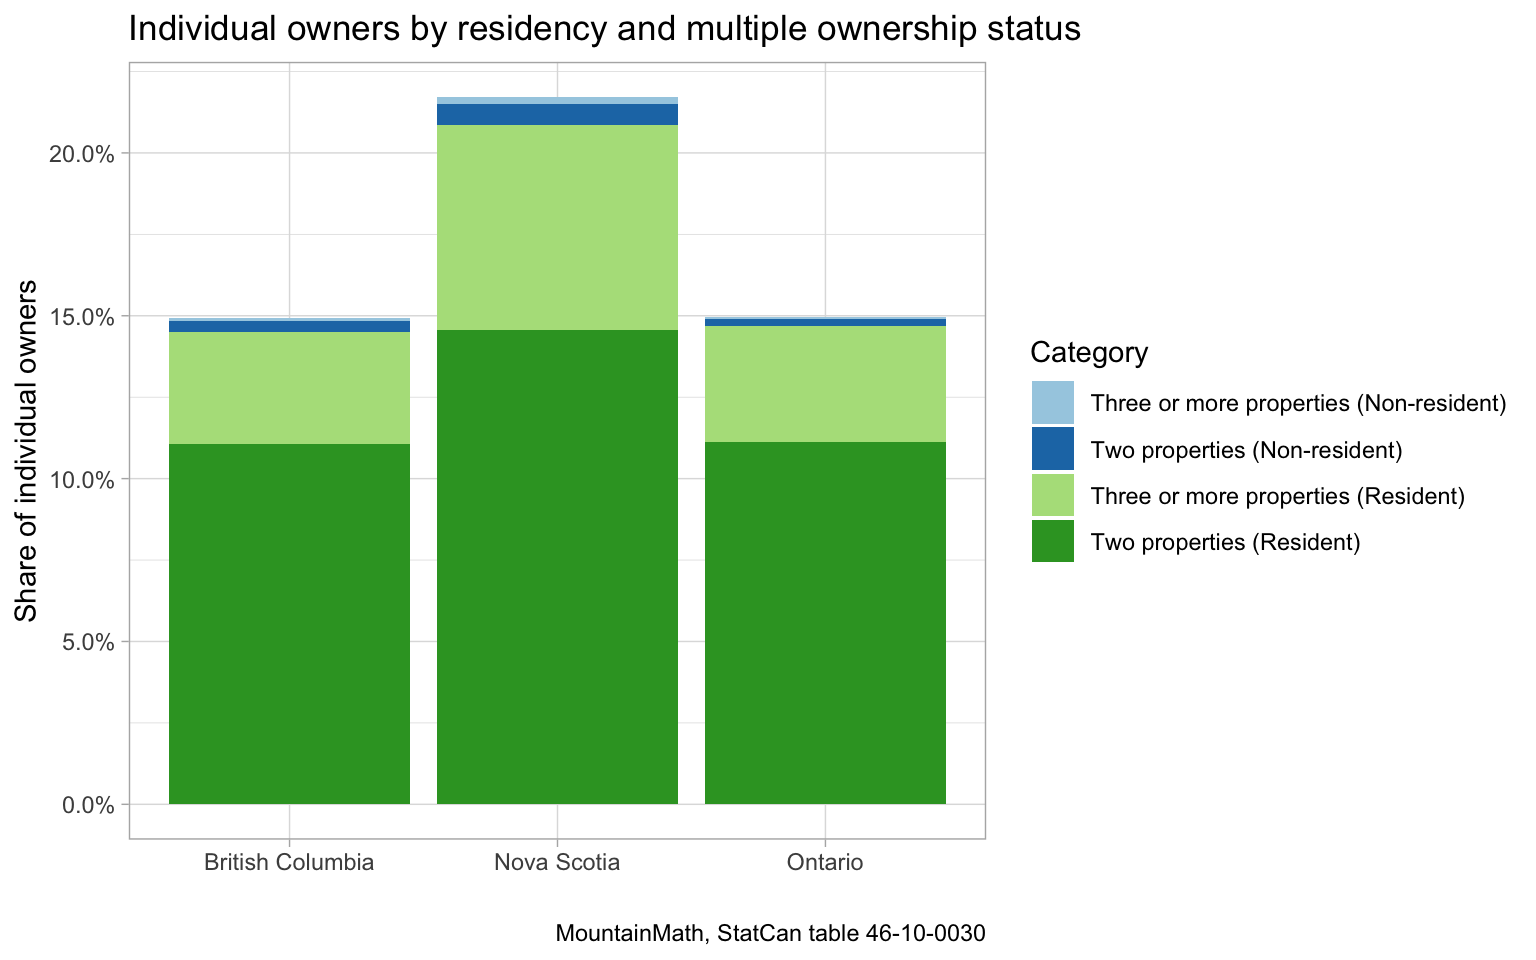
The first question the data answers is how many individual owners own more than one property.

The answer is quite simple, it’s about 15% in British Columbia and Ontario, and about 22% in Nova Scotia.
Individual investors
Next up a question that Nathan Lauster and I looked at a while ago using different methods, that is how many investment properties, i.e. properties owned by individuals but not occpied by them, are owned by local investors, so investors residing in Canada, vs by overseas investors that is investors residing outside of Canada.

This confirms the estimates of our previous work that about 4 in 5 investment properties are owned by local investors, a result that attracted some heated (and uniformed) emails when we first put it out. It also adds context to the news stories that focused on the ownership rates and implied that investors were mostly a product of owners living overseas, which is directly contradicted by the very data the news stories were based on.
The above were the two images I already tweeted out this week, but there were several other tables in the CHSP release that I want to briefly take a look at.
Non-individuals owners
Next up is non-individual owners, so owners of property that are corporations, governemnt agencies, trusts and such. We already saw that the portion of properties owned by non-individual owners is quite small, with 9.85% of properties in British Columbia owned by non-individuals, dropping down to 5.61% for Metro Vancouver.
The new data gives information on the owners of these properties. 
The vast majority of non-individual owners are corporations, with Government taking the second spot and, as one would expect, tend to own a large number of properties. But how about bare trusts that get a lot of attention these days?
Bare trusts aren’t split out, but are a sub-category of Other and multiple legal types. And looking at the overall number of these in British Columbia, there aren’t many.
| Number of proerties owned | Number of owners |
|---|---|
| Total, all number of properties owned categories | 140 |
| One property | 105 |
| Two properties | 15 |
| 3 to 9 properties | 10 |
| 10 to 99 properties | 10 |
So 140 different owners are trusts, 105 of which own one property only and the remaining owning multiple properties. Again, this category includes bare trusts among other legal structures, so it is an upper bound on the number of bare trusts owning property in BC. This number may surprise some, given how much attention bare trusts get in the public mind.
It also helps re-focus the discussion about bare trusts on what is at it’s core: Transparency. Or the lack thereof. Just because the number of trusts is very small does not mean we should ignore it. But given how small it is one does wonder why not just get rid of ownership by bare trusts, that seems like a much simpler solution than continuing with bare trust owbership and trying to fix the transparency problem. Someone better informed about the uses of bare trusts may have good arguments why trusts can’t just be replaced by company ownership, but so far I have not seen any good reasons.
Multiple ownership of immigrants
The data also has tables on immigrant owners. Unfortunately it does not include totals for the number of all people considered, or all immigrants, or all recent immigrants. It only has numbers of property owners, I would be curious to look at ownership rates, although some of this has been reported on before using IMDB data.
What we can look at is multiple ownership rates, that is how many owners in each immigration category own multiple properties.

While this does not speak to the overall ownership rates of each category, it does tell use the the share of owners that own multiple properties for immigrants is on par with that for non-immigrants in British Columbia and Ontario, with recent immigrants showing lower rates of multiple ownership.
Upshot
That’s a wrap for now. There are still some tables that we haven’t explored in this post, but we encourage anyone interested to grab the code and have a go at it.
Reuse
Citation
@misc{some-notes-on-investor-and-corporate-ownership-of-residential-properties.2019,
  author = {{von Bergmann}, Jens},
  title = {Some Notes on Investor and Corporate Ownership of Residential
    Properties},
  date = {2019-06-18},
  url = {https://doodles.mountainmath.ca/posts/2019-06-18-some-notes-on-investor-and-corporate-ownership-of-residential-properties/},
  langid = {en}
}
