Canada is a large country, with some reasonably densely populated regions, and large areas that are sparsely populated. That makes it hard to map things. CensusMapper, our project to flexibly map Canadian census data, struggles with that. The choropleth maps can be quite misleading. The same problem comes up when mapping Canadian election data.

This map makes it virtually impossible to get a good reading of the distribution of votes. There are a couple of ways around this.
For example, one could break out the areas with electoral districts too small to make a visible impact on the map, or use a cartogram, like the following two examples taken from the Wikipedia page of the 2019 federal election.


The first keeps the overall geographic context, although the metropolitan areas that are broken out are hard to interpret unless one if very familiar with each region. The cartogram distorts the areas to give each electoral district the same amopunt of space, and thus gives a proportional view of the number of seats each party won. In this version, the labels and breaks help delineate familiar geographies, but it can be hard to properly place them on a map.
To bridge the divide between overall geography and emphasis on treating each district separately, one can also animate the cartogram between the familiar map view and the cartogram view. In the following example that we built as an observable notebook we move between a map of Canada and a cartogram where each electoral district is a dot with size given by the total number of votes cast.
We include a video clip of the animation for convenience, it’s just a screenshot from the interactive live observable notebook.
This still loses a lot of nuance. The colour is determined by who won the district, the animation reveals no information on how wide or narrow the margin of victory was. Or how the other candidates performed.
Distribution of votes
We can expand this view to show the vote share by party for each district.

Wasted votes
With our first-past-the-post system, we can also take a look at “wasted” votes. We define these as votes that have no bearing on the outcome. For winners it’s the vote margin by which they won, for the ones that did not win their district it’s the entirety of their votes.

Wasted votes is a somewhat artificial system that does not necessarily reflect how parties would have performed under a different voting system. We will need to take a closer look for that.
First-past-the-post vs proportional representation
How would the parties have fared under a proportional representation system (PR) instead of first-past-the-post (FPTP)? There are many different kinds of proportional representation systems out there, but they generally try to approximate a seat distribution that mirrors the overall vote share. For simplicity we will simply take the overall vote share as a proxy for what a proportional representation system might have yielded.

The Liberals are the big winner of FPTP, as is Bloc Québécois. The Conservatives fair equally well under either system, and NDP and the Green Party are the losers under the current FPTP system.
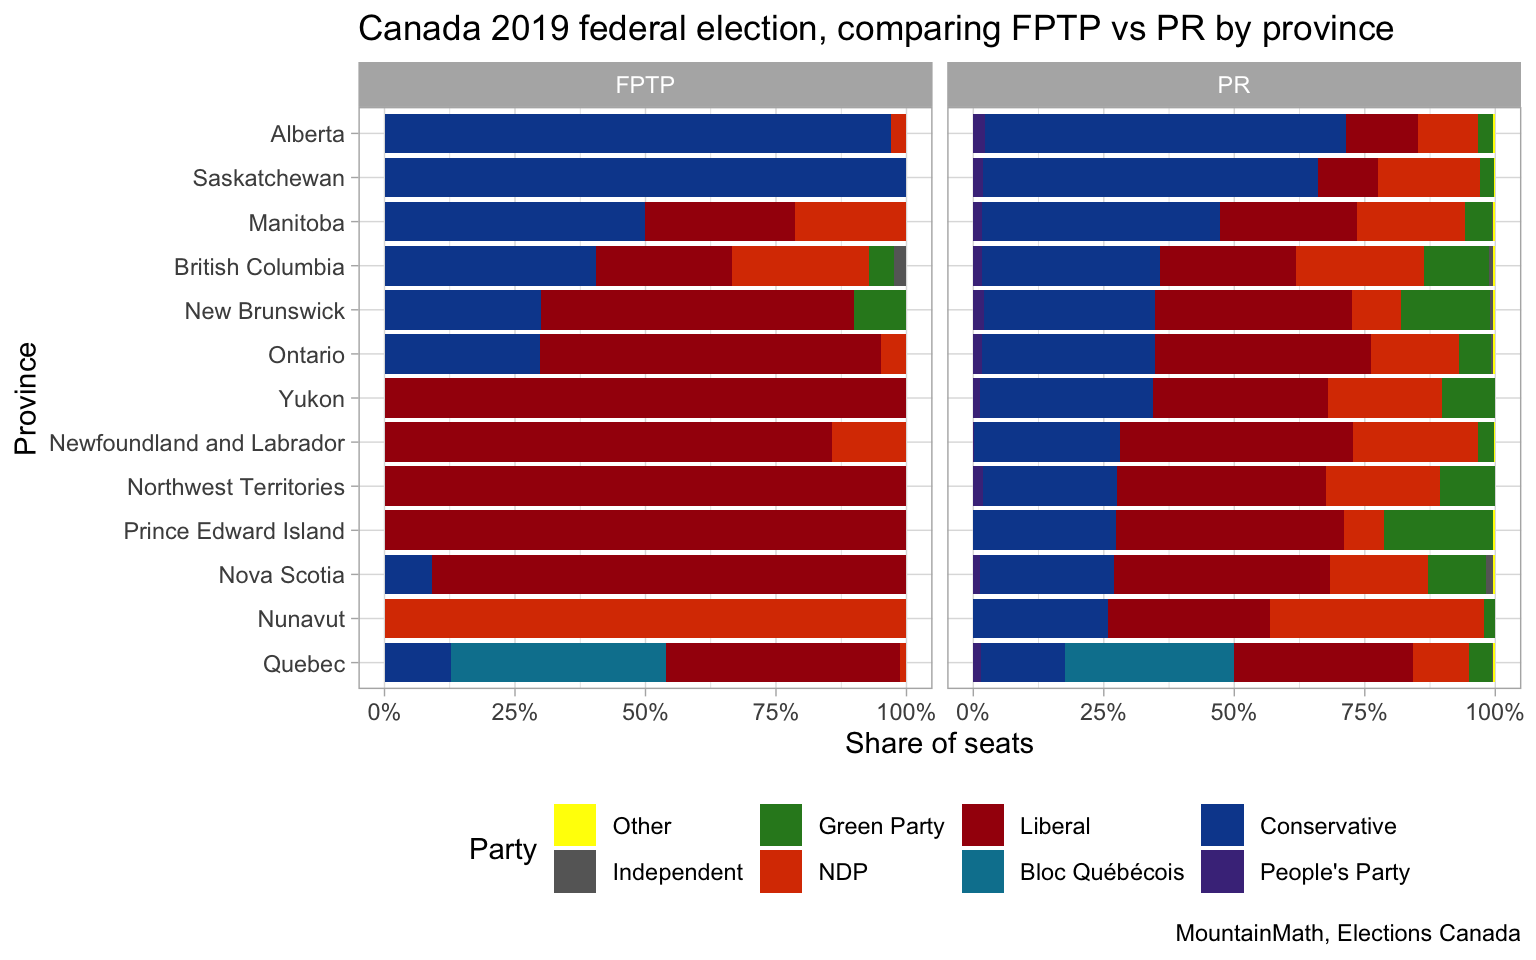
We can run this by individual province to see how well each province is represented in terms of first-past-the-post vs proportional representation.

This reveals that Alberta and Saskatchewan voters are a lot more diverse than the FPTP vote system may suggest, and the while the Conservatives got shut out of a couple of provinces, they still have sizeable support there. This kind of outcome is fairly typical for first-past-the-post systems, where the representation in parliament does not match the overall population well, especially when looking by province.
Upshot
There is endless fun to be had with elections data. As usual, the code for this post, including the pre-processing for the animation, is available on GitHub for anyone to adapt and dig deeper into elections data.
Reuse
Citation
@misc{elections-fun.2019,
  author = {{von Bergmann}, Jens},
  title = {Elections Fun},
  date = {2019-10-22},
  url = {https://doodles.mountainmath.ca/posts/2019-10-22-elections-fun/},
  langid = {en}
}

