Metro Vancouver is growing, both in terms of population and jobs. That means the number of people commuting to work is growing and putting a strain on our transportation system. The nature of that strain depends to a large extent on how people are getting to and from work. The Canadian census started collecting data on how people get to work in 1996, which allows us to see how commuters and commute choice have changed over time.
TL;DR
There are large regional differences in how net new commuters get to work, with net new commuters in central regions driving much less than those in outlying regions. Yet our regional growth plan calls for outlying regions to grow significantly faster than the centre.
Metro Vancouver commuters
The evolution of the overall mode share in Metro Vancouver shows a gradually changing transportation landscape that this growth brings with it.

While driving dominates, the share of people driving to work is on a decline. Road space is mostly inelastic, forcing trips into more space-efficient modes, in particular transit. At first sight the data for 2001 does not seem to fit the pattern, but we should remember that Vancouver’s 2001 Transit strike overlapped the census period. (Something I did not know about and had to look up when I was wondering what caused the 2001 numbers.)
To understand the impacts on congestion we should look at total numbers of cars on the road instead of the mode share.

The total number of drivers has been growing steadily, causing increased congestion as people navigate the choices they have on where to live and how to get to work.

Over our 20 year timeframe transit and driving account for the bulk of the net new commuters. But this pattern has not been uniform across the region. Commuters living in more central areas or near rapid transit have more options in how to get to work than people living in further out parts of the region, and this is reflected in the municipal breakdown.
City level breakdown

The differences across municipalities is quite remarkable. All municipalities except West Vancouver gained commuters over this time period. Driving saw the largest gains among the modes in Surrey, the Langleys, Maple Ridge and Port Moody, with transit winning out in the other larger cities. The District of North Vancouver, West Vancouver, and Delta saw a drop in drivers.
The change in drivers is the most important component in understanding increase in congestion, we can highlight at the individual contributions of all the municipalities in terms of drivers and non-drivers.

The range is enormous, with Surrey seeing an increase in 75,360 drivers and West Vancouver a drop of 2,650 drivers. Change in non-drivers ranges from a gain of 65,530 in the City of Vancouver to a loss of 25 non-drivers in West Vancouver. Looking at cities that added at least 2,000 commuters in this timeframe, we can look at the share of non-drivers among net new commuters as an indicator of how sustainably (in terms of congestion) each city grew their commuters.

This share in net new commuters affects how driver mode share in each of the municipalities has evolved since 1996.

This shows that all regions decreased their drive to work mode share. We also plot the intermediate years, and 2011 stands out as giving lower values than 2016 for some of the smaller areas, which might be due to NHS non-return bias.

All municipalities have reduced their mode share, with central municipalities making larger gains. We greyed out areas with fewer than 200 commuters in 2016.
Neighbourhood level breakdown
To better understand the drivers behind this, we can plot this on finer geographies. To start off we look at the total change in the number of commuters between 1996 and 2016 on the 2016 census tract geography on the custom tabulation that we have used before.

It’s remarkable how all CTs in West Vancouver and large portion of the District of North Vancouver, as well as the West Side of the City of Vancouver have lost commuters. We see similar patterns in the low-density areas of Richmond and Delta, White Rock and the south-western edge of Surrey, as well as other pockets throughout the region. This can only partially explained by population loss that we have also seen in some of these regions, but is mainly a function of changing demographics.
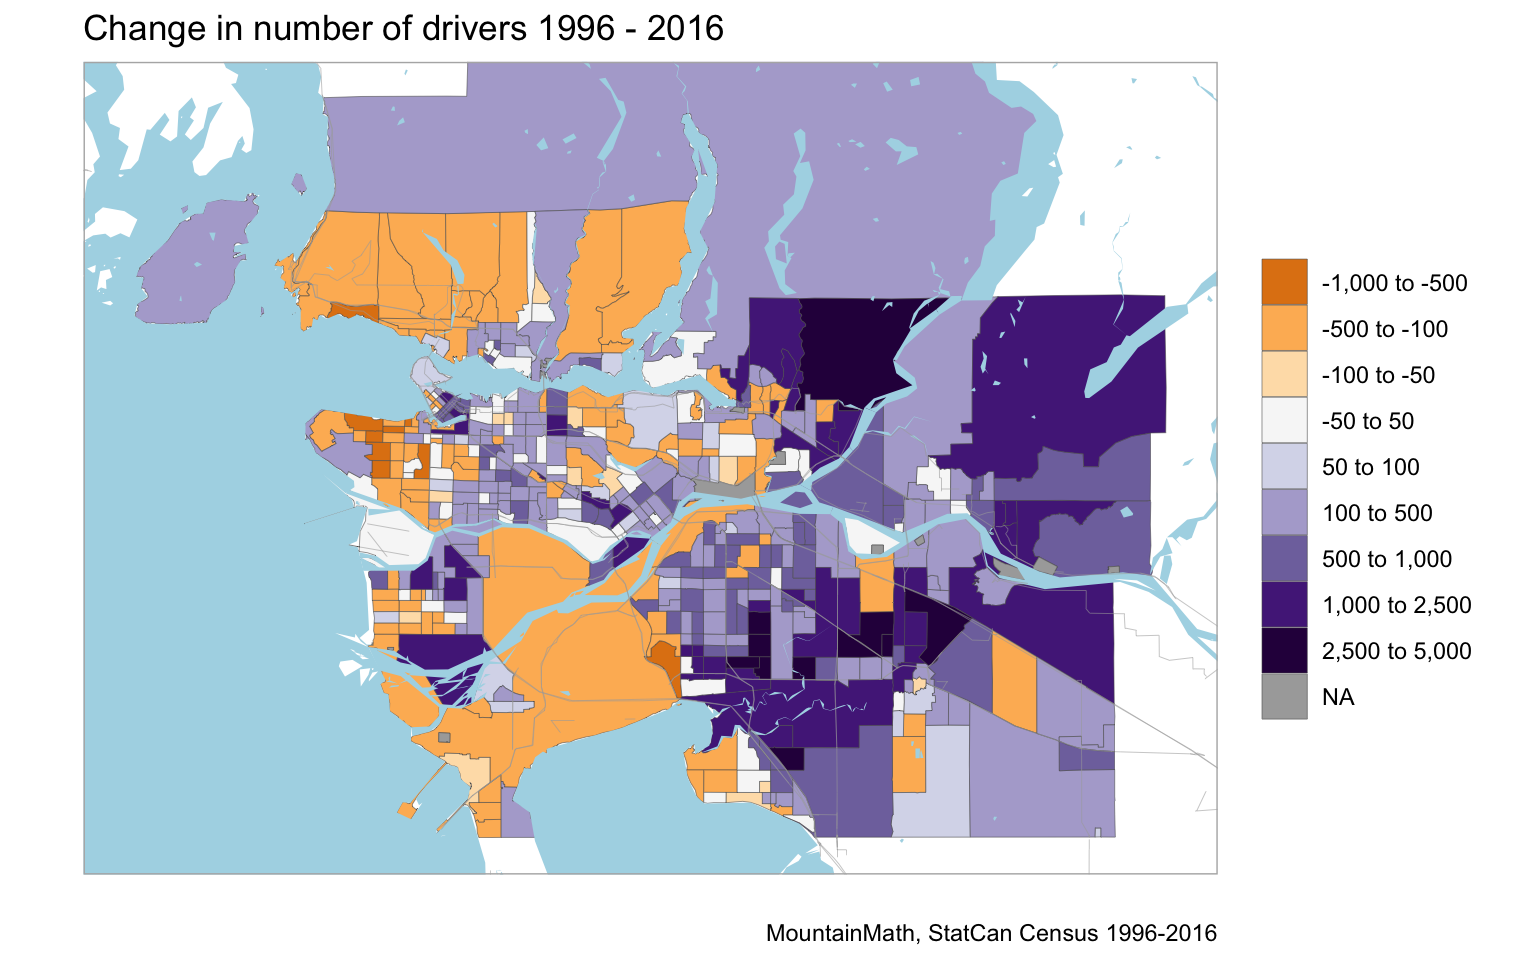
Looking at the change in drivers, all areas that lost commuters also lost drivers or only had minimal gains.

But there are many other areas that gained commuters and still lost drivers, for example large parts of Mount Pleasant area in the City of Vancouver and ares in the Cambie Corridor.
Turning to the the change in non-drivers, almost all areas posted gains.

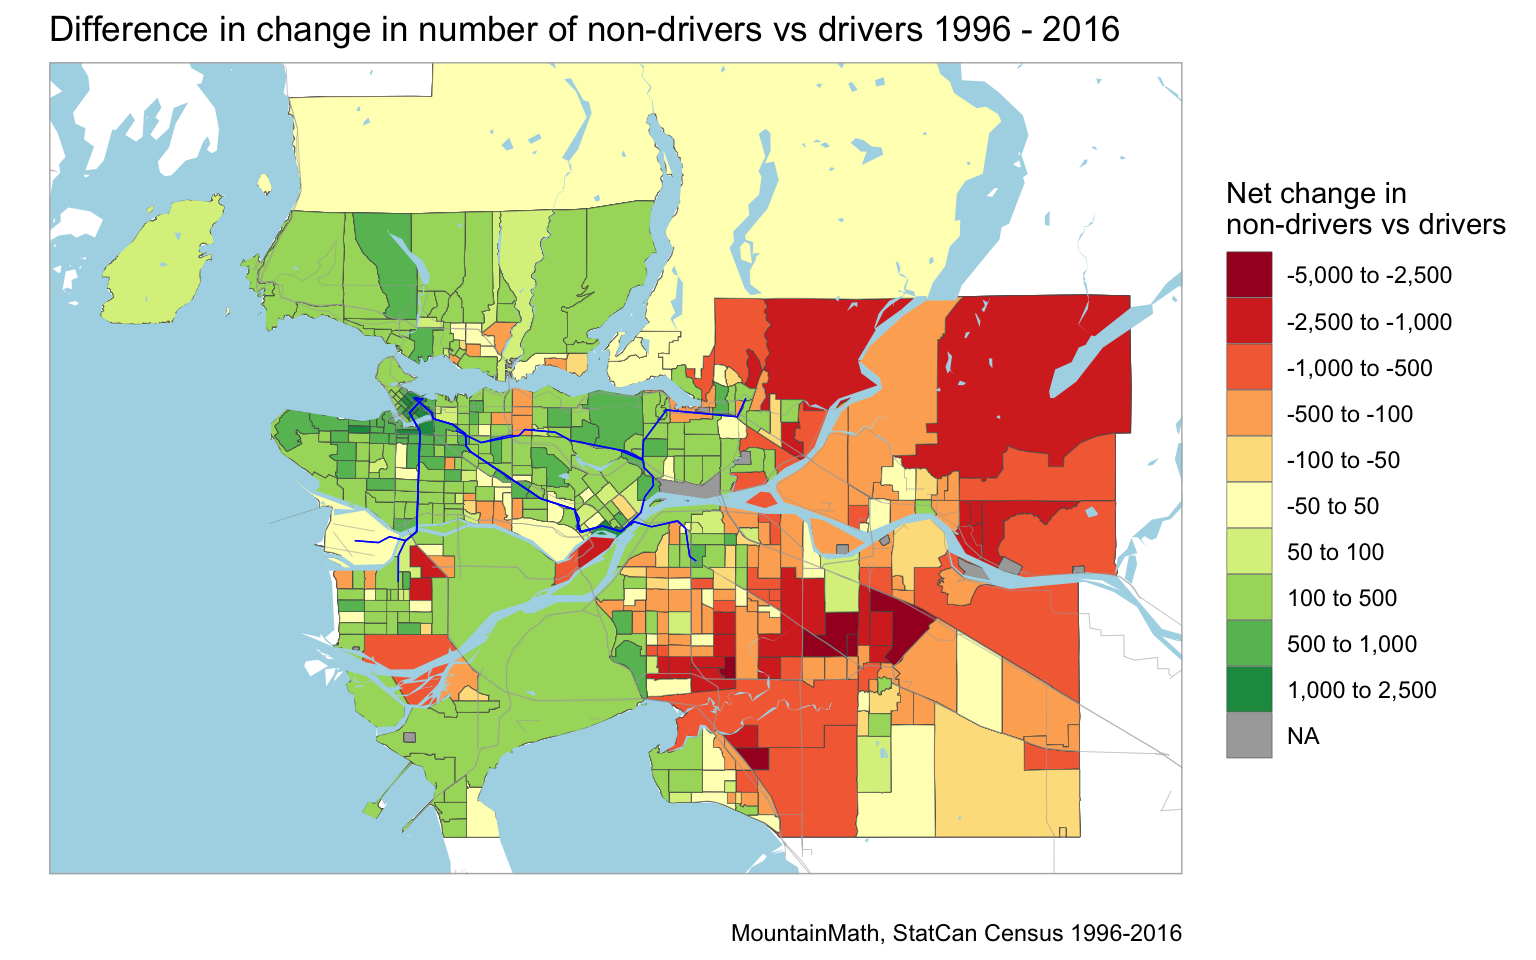
Naturally areas that saw a lot of development in that time period stand out, especially those near skytrain. We can summarize these two maps by looking at the difference in the change in non-drivers vs the change in drivers. This is a simple metric that looks at where we have added more drivers than non-drivers and vice versa.

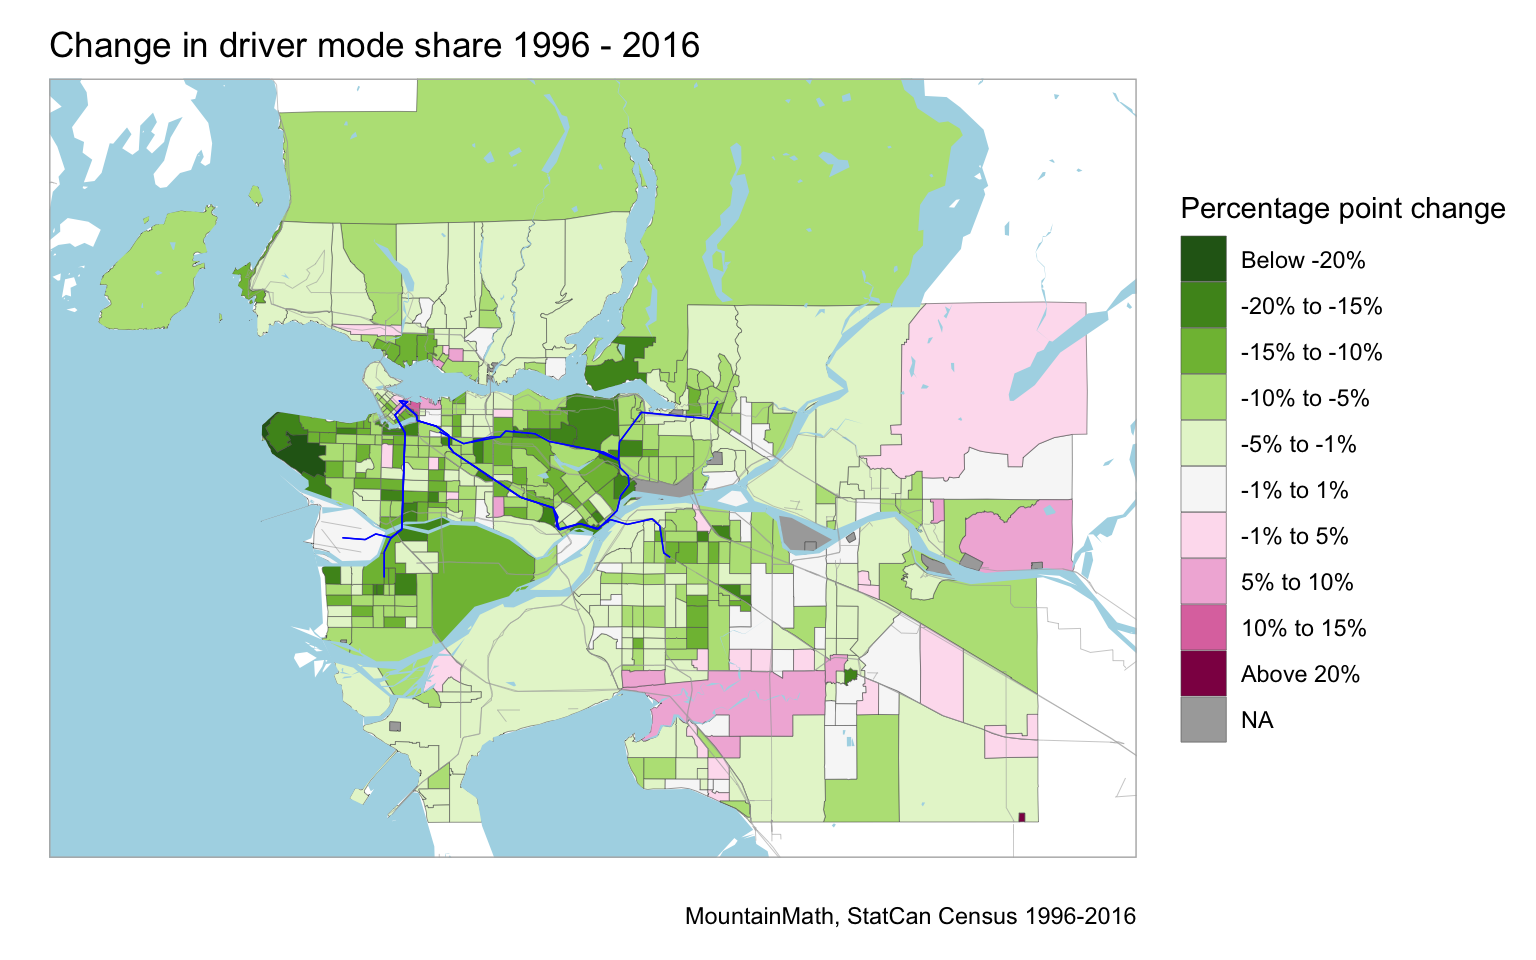
We can also see where the driver to work mode share dropped and where it increased.

It’s worthwhile to try and understand what made these regions special and dig a little further. Or even better, run a more detailed analysis on the factors that impact the changes in commuters, drivers and non-drivers. But that will have to wait for another post.
Commute times
Another way to look at commutes, and the possible congestion they cause, is commute times. Congestion is not just a function of the number of cars that commute, but also the time they spend on the road.

There is surprisingly little variation in drive times across the municipalities in the share of people driving less than 30 minutes one way, with about 25% of drivers commuting less than 15 minutes, and bout 60% commuting less than half an hour. There is more variation in long commute times of at least 45 minutes, with the central areas, led by the City of Vancouver, clocking in with the lowest portion of drivers commuting longer than 45 minutes. Bowen Island is a curious example with both, the highest share of commuters commuting less than 15 minutes and those commuting over an hour, cleanly separating commutes within the island from those that leave the island.
We can extend the same graph to all commuters not just drivers. 
This paints a very similar picture. Commute times are also reflected in how early people are leaving their house for work.

Here we are again looking at commute times of all commutes, not just drivers. Ordered by the share of people that leave the house before 8am we again see the similar pattern of commutes further out from the centre getting up earlier, and people in more central communities getting to sleep in and leave the house after 8am.
Another way to look at the data is by distance to work.

Again a similar pattern emerges, where we ordered the municipalities by the share of commuters that travel less than 10km to work. Taken together, commute times, time leaving for work, and commute distance hint at the life quality impacts of commuting that are independent of the well documented health impacts of commuting by private motor vehicle.
Upshot
As our region grows, we should pay more attention to the interplay between location and transportation. Our current regional planning dictates that twice as many people should move to Surrey than to the City of Vancouver, which is very likely to significantly boost the population driving to work compared to e.g. a scenario where Vancouver and Surrey grow proportionally to their respective populations. Allowing growth to happen in a way that gives people convenient choices of how to travel to work and other places should receive more attention when we talk about how we grow our region.
Adding housing in central parts of the region and along rapid transit networks can help reduce driving and overall congestion in our region. Yet people regularly oppose development projects in central locations because they are afraid of the (car) traffic they fear the new project will bring.
As usual, the code for this post is available on GitHub for people wanting to play with the code. Unfortunately, the data going back to 1996 that we used is only available for Vancouver and Toronto CMA, people hoping to extend to the code to other regions of Canada will have to make due with the 2001 to 2016 timeframe or find other ways to add in the 1996 data.
Reuse
Citation
@misc{commuter-growth.2019,
  author = {{von Bergmann}, Jens},
  title = {Commuter Growth},
  date = {2019-10-29},
  url = {https://doodles.mountainmath.ca/posts/2019-10-29-commuter-growth/},
  langid = {en}
}
