The long awaited first batch of data from the Canadian Housing Survey came out yesterday. The Canadian Housing Survey (CHS) is a new survey that aims give a better idea of well housing needs of Canadians are met.
Right now there are four tables publicly available, and we will give a quick tour of what’s out there, with a focus on Metro Vancouver, Toronto, Montréal and Calgary.
This post is meant as a quick overview of what’s available right now, the code is available on GitHub for anyone that wants to explore this further.
Dwelling and neighbourhood satisfaction
The first table looks at satisfaction with of households with the dwelling units and neighbourhood they live in.

In this comparison, overall satisfaction with the dwelling is highest in Montreal and lowest in Vancouver. Satisfaction is generally higher in single-detached homes.

As one would expect, satisfaction is higher for owner households, and renters in subsidized housing have generally higher satisfaction with their dwelling units than renters in market housing.
It also gives a view at satisfaction with of households with the neighbourhood they live in.

Households in Montréal are on average most satisfied with the neighbourhood they live in while those in Toronto are least satisfied with their neighbourhood.

Again, owners show higher satisfaction with their neighbourhood compared to renters, but the situation for renters is reversed from dwelling satisfaction, with renters in market housing being in general more satisfied with their neighbourhood than those in non-market housing.
Waitlist status

Predictably, only a very low share of owner-occupiers are on a wait list for social or affordable housing, and households already in subsidized housing have the highest share.
Housing suitability and adequacy


Reasons for moving
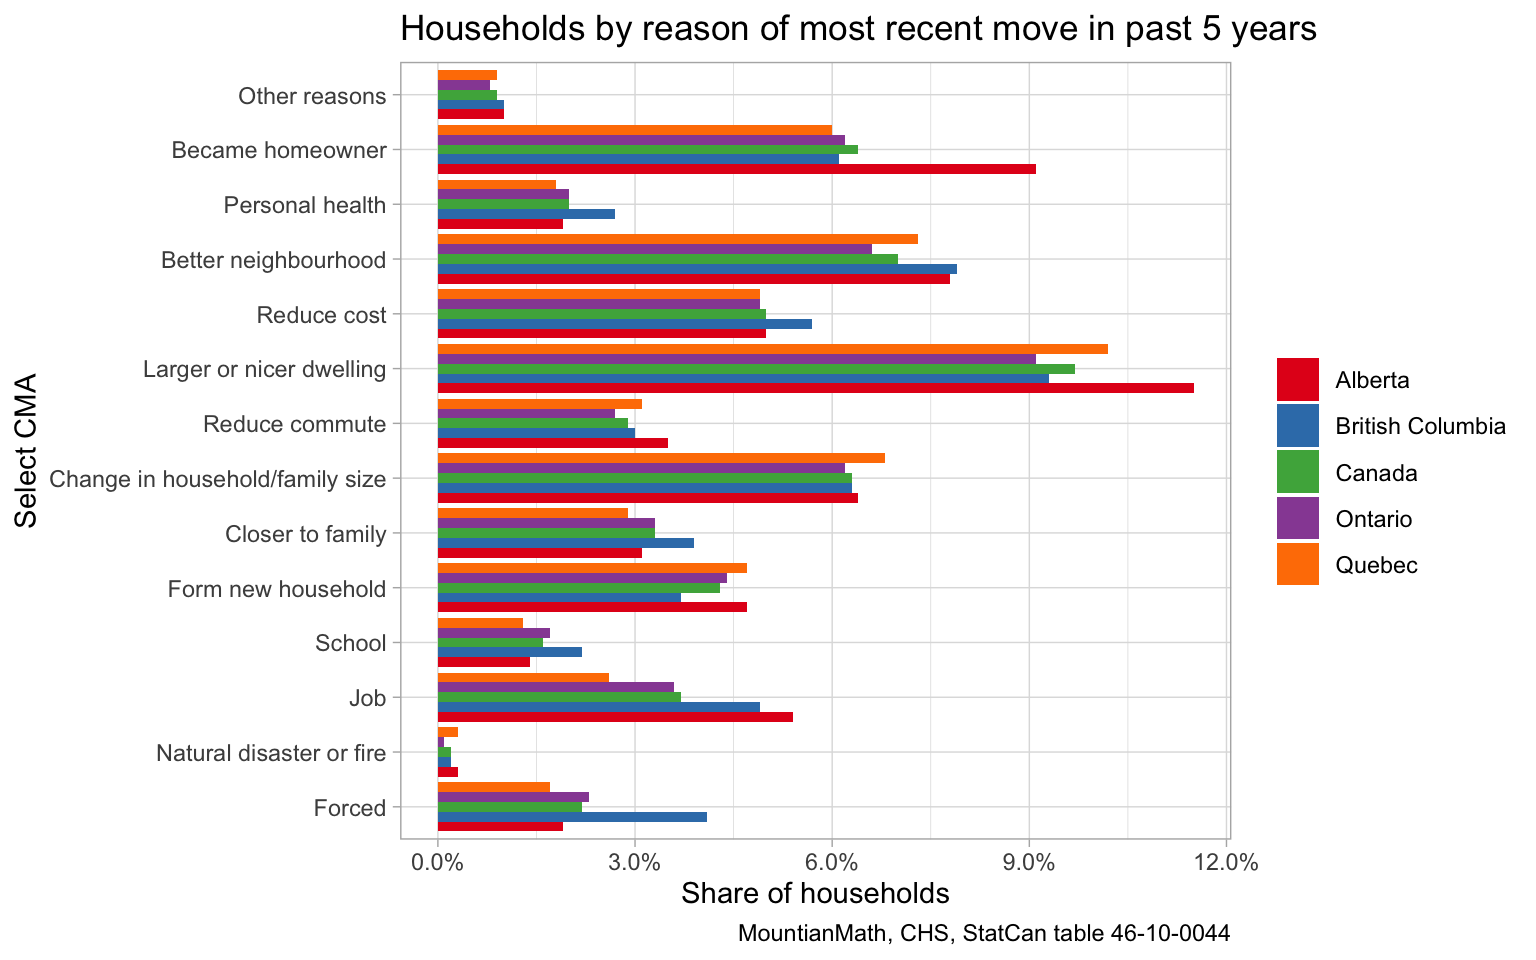
The most exciting table is the reasons for the most recent move in the past 5 years, if the household moved. We have had that data form the US for a long time, but it was sorely missing in Canada.

The graph gets messy and people can report multiple reasons, but there are a few high-level takeaways.
- British Columbia has the highest shares of households forced to move by a landlord, a bank or other financial institution or the government.
- The most frequent reason for moving across all of our regions is for a larger or nicer dwelling, followed by moving to a better location.
- In Alberta people are becoming new homeowners at higher rates than in the other regions considered.
Forced moves
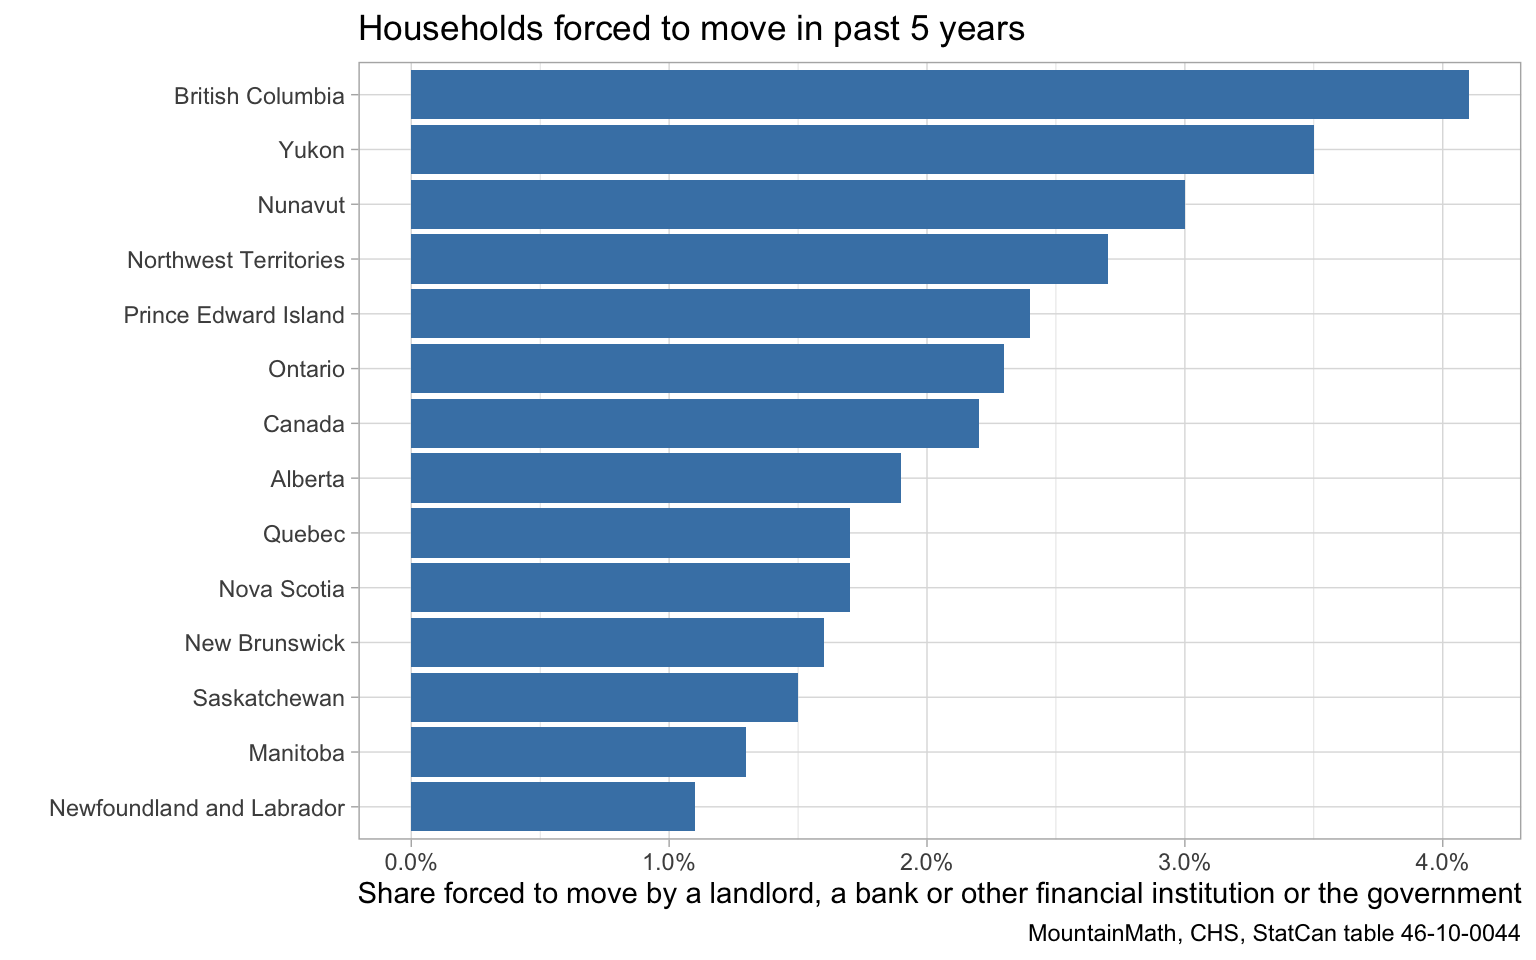
Forced moves are especially concerning, so it’s worthwhile to look at these more closely. The exact nature is not further broken, these pertain to households “forced to move by a landlord, a bank or other financial institution or the government”.

British Columbia takes the top spot with 4% of households moving during the last 5 years and doing so involuntarily on the last move, which is likely a function of the tight housing market with heavy reliance on insecure secondary market rentals, with condos and secondary suites easily being reclaimed by the owners. We also see evictions from purpose-built market housing, as well as people being forced to move from or within subsidized housing when their eligibility status changes.
We can also view this as a share of all moves, instead of as a share of all households.

Viewed as a share of movers, British Columbia households being forced to move on their most recent move jumps to an astonishing 10%. This is quite concerning and needs more attention. Micro data might help in understanding this further.
Upshot
It’s great to see this data finally making it out there, and hopefully micro data will become available too. It will take some time to weed through this in more detail, this can serve as a starting point. As usual, the code for this post is available on GitHub for anyone to grab to reproduce or to jump-start their analysis.
Update
Don’t miss Nathan’s post that puts the Canadian CHS into context of the US CPS-ASEC data.
Reuse
Citation
@misc{canadian-housing-survey-a-first-look.2019,
  author = {{von Bergmann}, Jens},
  title = {Canadian {Housing} {Survey}},
  date = {2019-11-23},
  url = {https://doodles.mountainmath.ca/posts/2019-11-23-canadian-housing-survey-a-first-look/},
  langid = {en}
}
