With social distancing and travel restrictions in full swing in Canada, everyone wants to know if it’s working. And when and how we can start to loosen some of the restrictions. To answer these questions we need data.
Canada has been extremely slow to make covid-19 related data available, only at the end of March did Canada get official government dataset for confirmed case counts and deaths by province and date. Shortly after Statistics Canada published individual case data with demographic and hospitilization information (since replaced by a new timeseries), but that data only covers about half of all cases in Canada. Why only half? Because Health Canada, the national health authority from which the StatCan data originates, can only publish data “for which a case report form has been received by the Public Health Agency of Canada from provincial or territorial partners”. And it is missing a lot of data.
Moreover, the official data sources are about a day behind in reporting. Which brings us straight to the main issue when dealing with covid-19 related data.
Lag
When we want to understand the effect of social distancing and other measures, we want to know how it affects the infection rates. But we can’t measure these directly. Typically the first time we get a hunch of an infection is when someone develops symptoms consistent with covid-19. Typically this happens about 4 to 5 days after contracting the virus, but can sometimes take up to 14 days. That onset of symptoms date is the best date we have to see if social distancing is working, and it lags by 4 to 5 days. After experiencing symptoms, the infected person might seek to get tested, actually get tested, the test result will come out, and the result will get reported.
The time it takes from onset of symptoms to results getting reported can be reduced. We can encourage people with symptoms to seek testing fast, and we can try to test people as fast as possible and promptly report the results.
I have not seen studies how long this process takes in Canada, and it probably does not even make sense to ask this question. And the reason is the same as Health Canada not having demographic data on about half of all cases. The Canadian health case system is very fragmented, and Canada has not established a unified framework how to deal with covid-19 cases. The lag between onset of symptoms and reporting of confirmed cases likely varies considerably across health authorities and provinces.
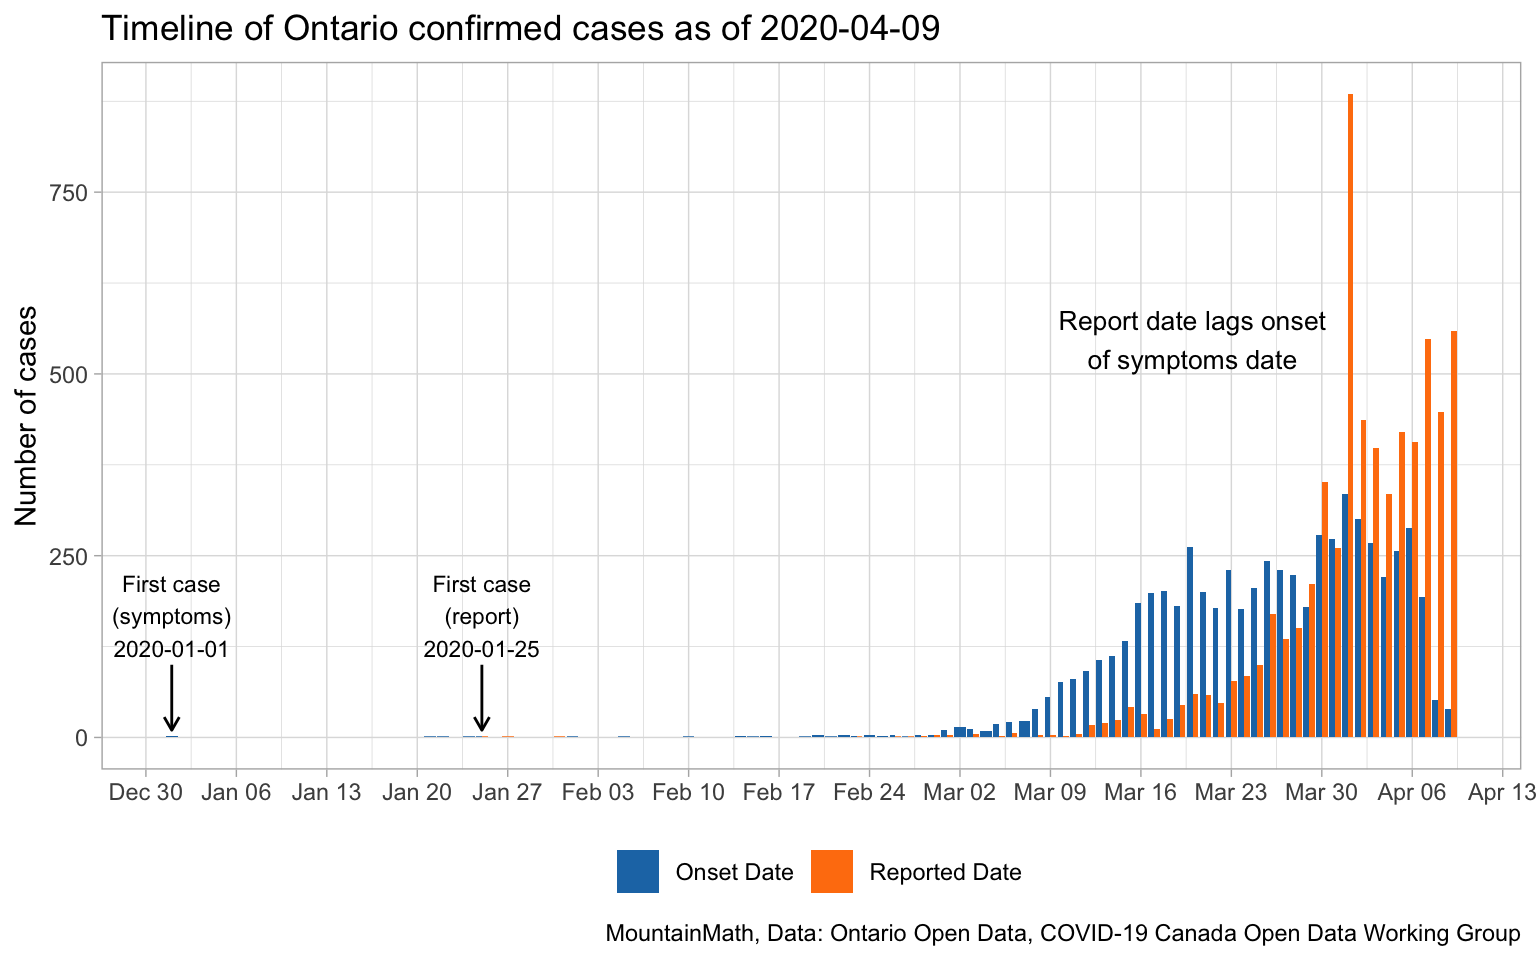
Ontario has released case data with the onset of symptoms (possibly estimate). Unfortunately the dataset does not contain the date each case was reported, so we can’t compute the lag directly for each case. But we can compare that to the data on reported cases by date.

The aggregate data still shows clearly that there is a significant lag between onset of symptoms and the reporting of confirmed cases. The data also shows how surges in reporting, as happened in Ontario on April 1st, may not reflect conditions on the ground. But reported cases is the data that’s most commonly available and closely watched by journalists and the public.
Testing
Another variable in all of this is testing. Cases only show up in these statistics after people get tested. But the number of tests conducted, and the testing protocols, differ across provinces. And through time. If testing protocol stayed constant over time, and testing increased at the same rate at the spread of covid-19 so that the ratio of confirmed cases to all infected people stayed constant over time, and other factors like reporting lag also stayed constant, then growth of confirmed cases would equal the growth of true infected cases. Even if the total count of infected cases would be a lot higher than the ones confirmed positive.
But testing protocol changes, which introduces bumps in the growth of confirmed cases. And testing does not keep up with the growth of covid-19, which means the growth rate of cases likely under-estimates the growth rate of infections.

Despite all this, growth rates of confirmed cases is still often used as a proxy for growth in overall infections. The main reason is that it’s the least laggy metric we have. Other metrics we have, like deaths or hospitalizations, lag more. And the impact of change in test protocol often leads to a distinct short temporary bump in growth rates. Falling behind in testing may have effects that are harder to detect, but effects may be less impactful that one might naively expect.
Upshot
Right now we need to focus on social distancing to get the spread under control. But at some point we will want to start lifting restrictions and switch into containment mode. To determine when and how we should do this, and in order to be effective at containment, we need better data. It does not appear that Canada is set up for this. Hopefully that will change.
As usual, the code for the post is available on GitHub in case anyone wants to refine or adapt it for their own purposes.
Reuse
Citation
@misc{covid-19-data-in-canada.2020,
  author = {{von Bergmann}, Jens},
  title = {Covid-19 Data in {Canada}},
  date = {2020-04-10},
  url = {https://doodles.mountainmath.ca/posts/2020-04-10-covid-19-data-in-canada/},
  langid = {en}
}
