BC now shares data on the vaccination status of cases and hospitalizations in their weekly Data Reports. This is progress, although calling it “data” is reaching. What is shared is graphs that need manual scraping to be turned into (approximate) data.
The numbers themselves aren’t particularly meaningful. Vaccines aren’t 100% effective in preventing symptomatic COVID (approximated by “cases” in BC) or hospitalizations. This means that as more people get vaccinated, there will be more cases and hospitalizations among the vaccinated population. If everyone were vaccinated then all cases and hospitalizations would be necessarily among vaccinated people, this is not very helpful information.
To turn this data into useful information we need to specify what question we are interested in: By how much do vaccines reduce our risk of symptomatic COVID and of severe outcomes?. Unfortunately, in BC we don’t have the data we need for robust vaccine effectiveness estimates. But there is a lot of public interest to dig into this question, and with some data being released now it might be a good idea to take a more detailed look at what is needed for vaccine effectiveness estimates, what can go wrong, and what data is missing.
Despite all this uncertainty, one thing is clear: Vaccines are effective and everyone should get vaccinated as soon as possible. We are aiming to transition to “endemic mode”, which means, for better or worse (I have opinions), we are planning on COVID spreading through the population and everyone should expect to be either vaccinated, or contract COVID, or both.
Vaccine effectiveness (and efficacy)
First we need to clear up some terminology. Generally we are interested in the causal effect of vaccines, that is by how much the act of getting vaccinated causally lowers the risk of symptomatic COVID or hospitalization or death. The easiest way to ascertain this is through randomized controlled trials, as has been done as part of the vaccine accreditation process. Formally, vaccine efficacy against symptomatic COVID (or hospitalization) \(Y\in\{0,1\}\), where \(Y=1\) means being a case or being hospitalized, depending on vaccine status \(V\in\{v_0,v_1,v_2\}\), where \(V=v_i\) means being vaccinated with \(i\) doses, is given by the risk ratio
\[ VE_i = 1-\frac{P(Y=1|do(V=v_i))}{P(Y=1|do(V=v_0))},\qquad v_i\in\{v_1,v_2\}. \] A similar and more intuitive measure is the factor by which vaccinations offer protection from symptomatic covid or hosptializations \[ PF_i=\frac{1}{1-VE_i}=\frac{P(Y=1|do(V=v_0))}{P(Y=1|do(V=v_i))},\qquad v_i\in\{v_1,v_2\}. \] We will generally present results in terms of the protective factor \(PF\) instead of \(VE\).
In contrast, vaccine effectiveness is a much more vague concept. Generally it is defined as follows:
Vaccine effectiveness is a measure of how well vaccines work in the real world.
Unpacking this, vaccine effectiveness includes “side effects” of getting vaccinated like risk compensation, that can reduce or otherwise alter the benefits of vaccines, as well as problems with vaccine administration, can lead to reduced benefits of vaccines in the real world. Moreover, the sample of participants in vaccine trials may not reflect the risk profile of the general population of interest.
In theory, vaccine effectiveness is also a causal concept that aims to quantify by how much vaccines reduce risk in real world scenarios where vaccine administration is imperfect and allowing for confounding by side effects like risk compensation. In practice in the medical literature vaccine effectiveness estimates are often treated as statistical rather than causal estimates.
In general the logistics of proper vaccine refrigeration and administration is fairly well solved, so we don’t expect large effects because of that.
Risk compensation can seriously confound vaccine effectiveness estimates as vaccinated people may engage in more risky behaviour, partially negating the protectice effects of vaccines against infection. After all, risk compensation is part of the point, vaccines enable us to go back to normal and engage in more risky behaviour.
So why do we bother with vaccine effectiveness estimates at all, other than concerns about the trail sample under-representing important subgroups of the population?.
Variants of concern
Variants of concern complicate our initial vaccine efficacy estimates. What we are interested in now is how vaccines behave against the variants currently under circulation, instead of the variants the vaccines were tested on in randomized controlled trials that by now don’t play much of a role in transmissions any more. Vaccine effectiveness studies can help fill that gap to understand how effective vaccines are against new variants.
We could do this by benchmarking vaccine effectiveness for one variant against the known vaccine effectiveness of another variant, assuming quasi-random assignments of variants in exposure events. We don’t have publicly available data on variants, cases and vaccination status in BC, so we can’t do this. Another way is to make assumptions about factors influencing vaccinations, cases, and hospitalizations, and try and utilize the tools of causal inference to estimate vaccine effectiveness that way.
To do this it’s best to take it slowly and specify a causal model. Inter-jurisdictional differences in how vaccines are rolled out, and how case and hospitalization data is collected, mean it’s best to be clear about the (assumed) underlying causal model and how it relates to local peculiarities.
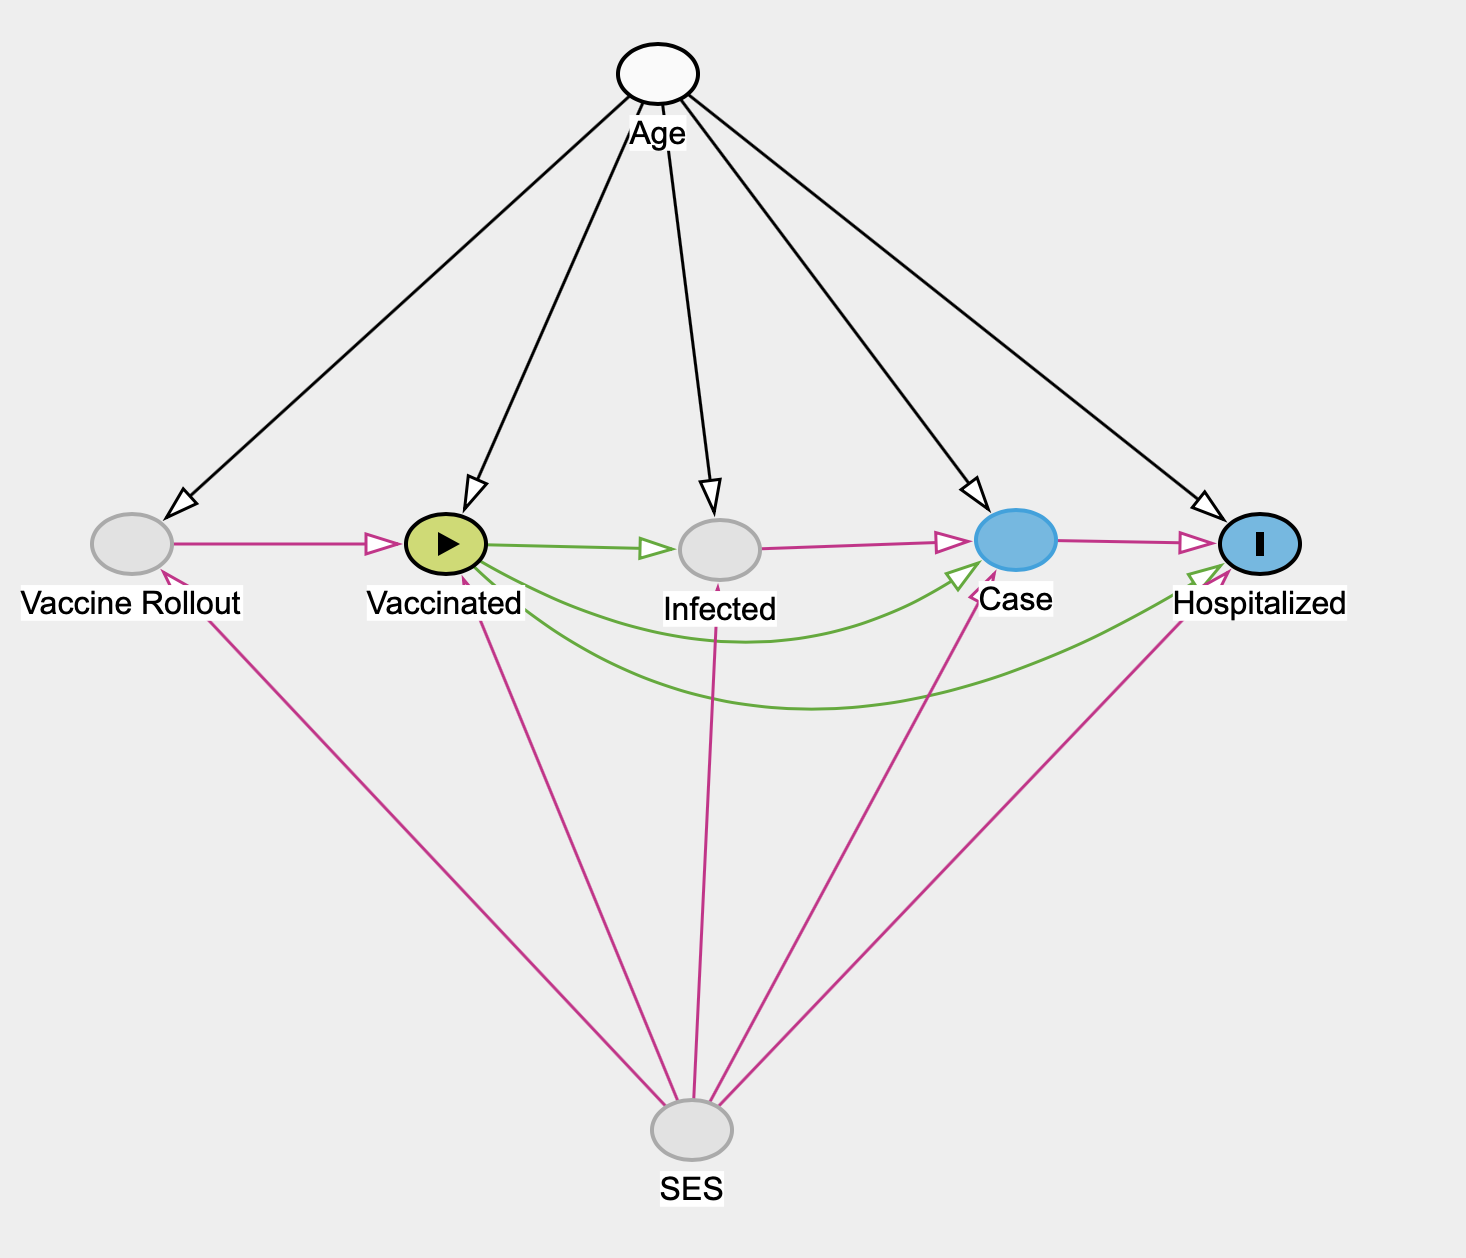
This model acknowledges the effect of the vaccine rollout in BC, where vaccination status isn’t assigned randomly but is strongly influenced by age due to the mostly age-based rollout. At the same time the vaccine rollout is impacted by socio-economic status (SES) in several ways, directly by prioritizing certain groups like medical staff but also to some extent essential workers, and indirectly through vaccine hesitancy and ability to access vaccines correlating with various SES variables.
There are other possible omitted factors, for example it is not clear how various NPI affect the these pathways, for example universal mask wearing may universally lower the initial dose and alter the severity of infections, which may impact vaccine effectiveness against hospitalization. We believe the above model is a decent approximation for estimating vaccine effectiveness in BC.
We expect vaccination status to causally effect the risk of getting infected, the risk of becoming symptomatic even when accounting for getting infected, and the risk of hospitalization even when accounting for being symptomatic.
We similarly expect age and SES to affect risk of infection, of becoming symptomatic, and hospitalized via comorbidities.
In BC (and in most other places) we don’t observe infection, and we can’t estimate the effect of vaccination status on risk of infection. This also means we can only observe the total effect of vaccination of becoming symptomatic and can’t estimate the direct or indirect effects as mediated through infection. We will remove this step from the graph.
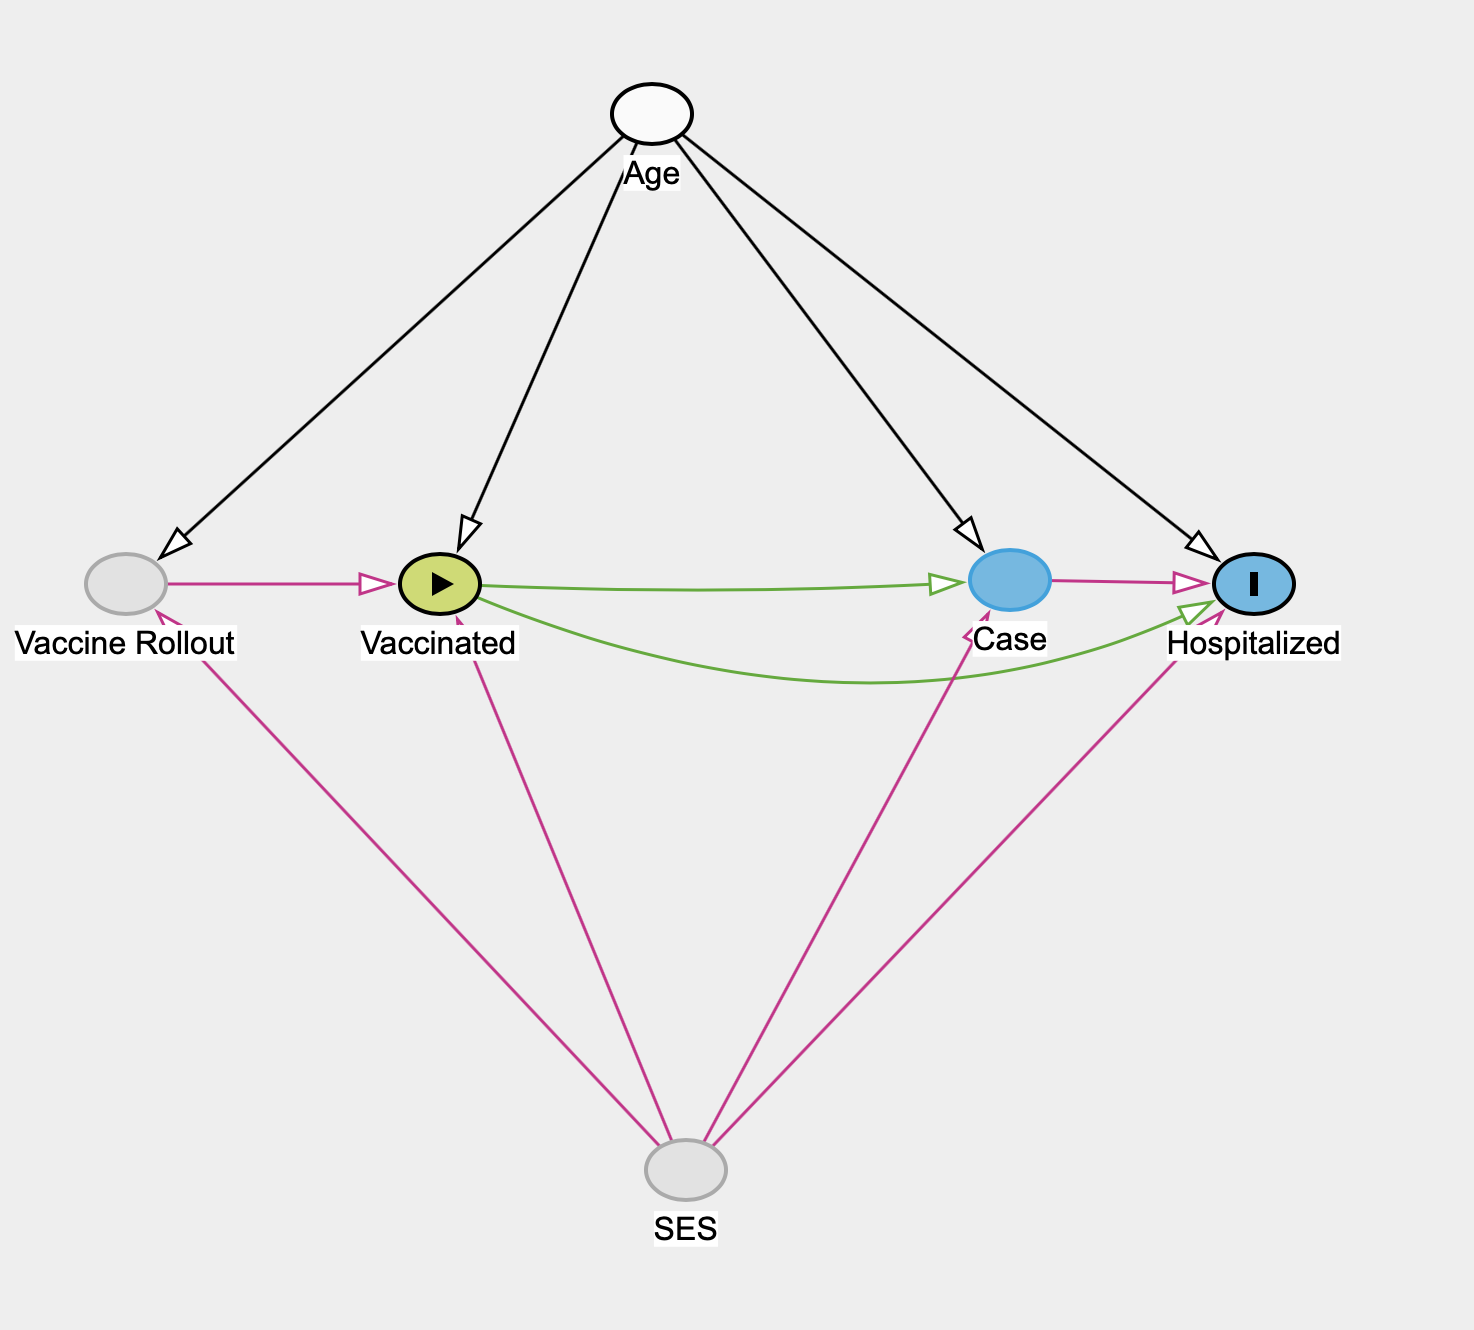
In BC age is an observed variable, and we (in principle) know the vaccination status, case status and hospitalization status by age. Unfortunately, SES is unobserved in BC. Early on BC decided not to collect SES variables relating to COVID cases, hospitalizations or vaccinations, despite PHAC explicitly asking this data be collected. In principle some of the effect of SES on the vaccination rollout may be knowable if BC kept track of who received a vaccination via the age-based rollout and who through medical staff or essential work or other SES-based mechanisms. But this information, if it exists, is not public.
This means that if we believe that either the impact of SES on hospitalization risk, or the impact on vaccination status and on the vaccination rollout are not negligible in BC, the effect of vaccination status on hospitalization is not identifiable in BC. The best we can do is substitute in a range of assumptions about the magnitude of these effects and use this to understand the range of corresponding vaccine effectiveness estimates.
Due to the unobserved nature of SES variables in BC we will assume the following causal model as a first step, and later try to estimate hypothetical impacts of the unobserved SES variables.
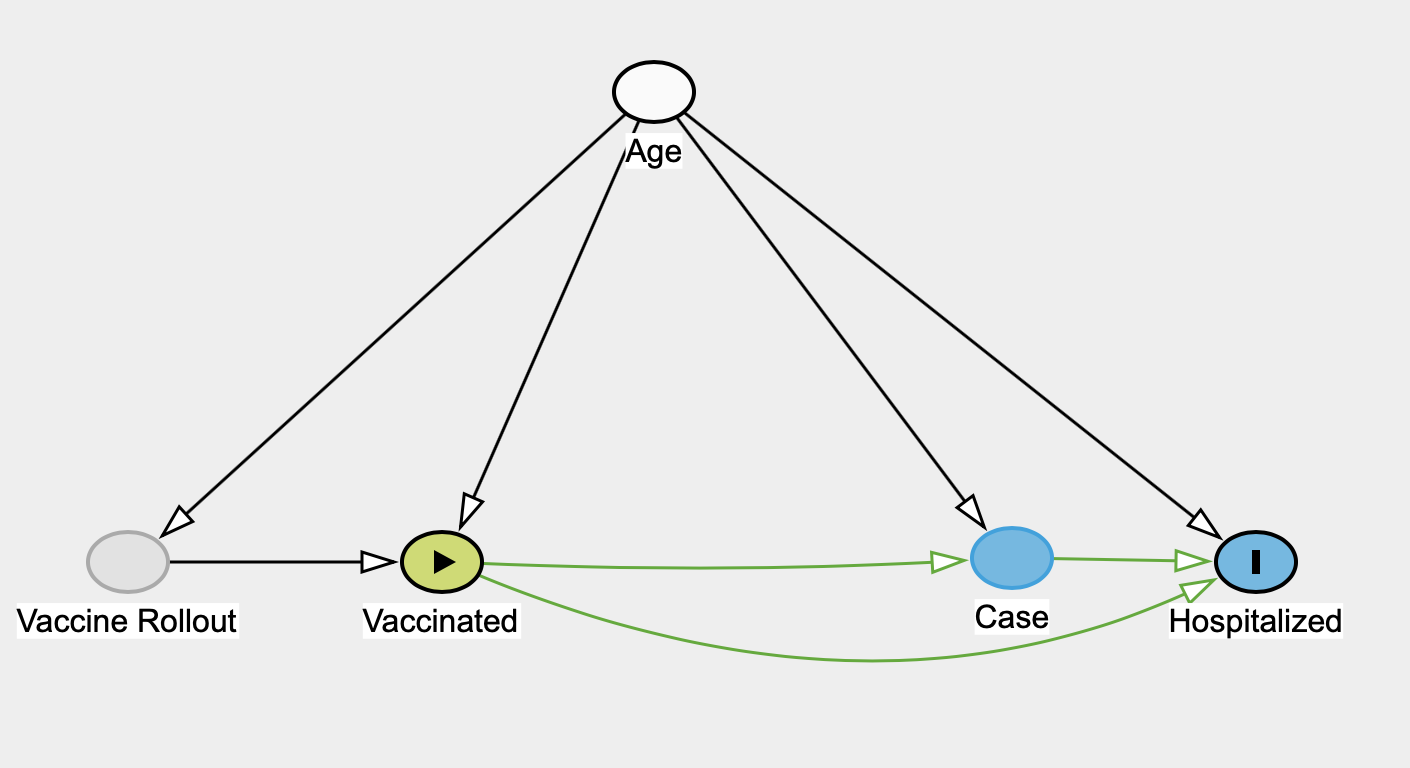
We will refer to this as the naive model.
Estimating vaccine effectiveness in the naive model
Under the assumptions of this model we can estimate several effects of interest: The effect of of vaccines on cases, the total effect of vaccines on hospitalizations, as well as the direct and indirect effects due to hospitalizations being mediated through cases. Formally we estimate the total vaccine effectiveness against symptomatic COVID or hospitalization \(Y=1\) using
\[ P(Y=1|do(V=v_i)) = \sum_a P(Y=1|V=v_i,A=a)P(A=a). \]
Let’s get to work using BC data. As mentioned up top, BC does not make the required data easily available, but some approximate version of it can be scraped from the weekly data reports. Thanks to BC’s abysmal data practices our 11 year old has quite a bit of practice scraping data out of BCCDC graphs, which he deposited in a google doc in exchange for a gift certificate for fancy ice cream.
There are several issues beyond just imprecisions when scraping data out of graphs, for example consecutive Data Reports have the vaccination rate of 80+ year olds drop from one week to the next, which is nonsensical and speaks to BC’s fundamental and ongoing data challenges.
Further, we only have access to aggregate data and thus are constrained in the timing of our input data. For hospitalizations we are using data from the August 19 data report that are pegged to admissions between July 17 and August 17. We use the age-based vaccination status from the July 26th data report that reflects the vaccination status as of July 22. The Data Report suggests that vaccination status is reported as 3 weeks post first dose or two weeks post second dose, so that rougly lines up with the vaccination data we use. We use case data from the same report, ignoring the lag between cases and hospitalizations that we generally observe. Moreover, cases have been rising during the given timeframe, which may further skew the analysis.
These data challenges make it difficult to have confidence in the subsequent estimates. We will continue to carry them out regardless, mostly just to demonstrate the adjustments that are needed to interpret the BCCDC vaccination data if one were able to access proper and accurate data. We remove the age group 0-11 year olds because the BCCDC vaccination data graph shows zero children in this age group being vaccinated, which is directly contradicted by experience (my 11yo is fully vaccinated) as well as PHAC vaccination data as the BC eligibility cutoff is based on birth year (2009) instead of age. This means that our estimates are for effectiveness of 12+ years olds only, which is not a big restriction.
To get a feel for the data we first compute simple case and hospitalization rates based on age and vaccination status.
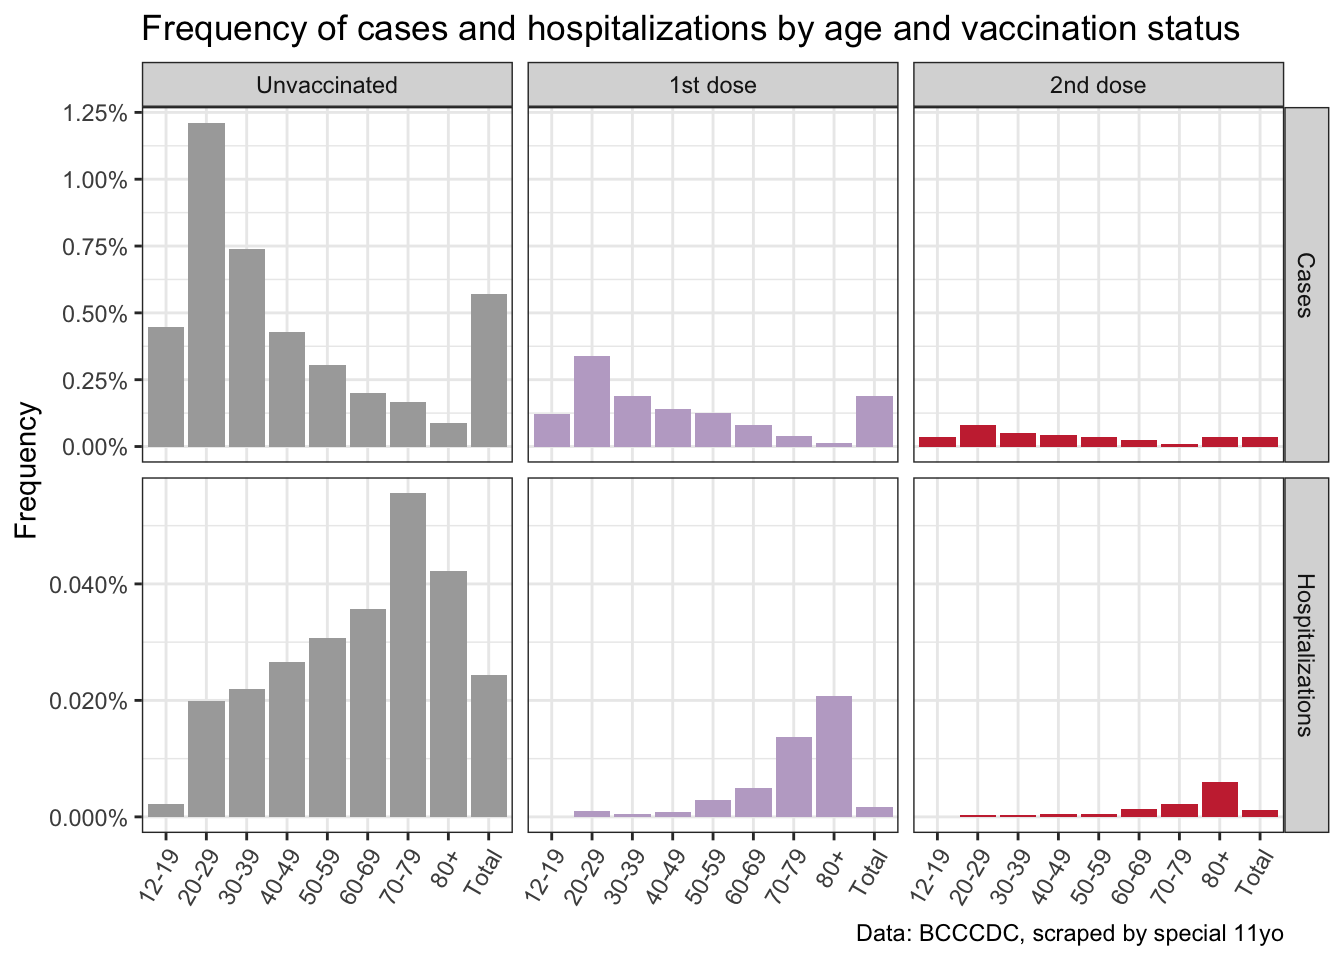
As expected this shows that the frequency of cases and hospital admissions strongly depends on both age and vaccination status. We can interpret each bar in this table as giving \(P(Y=1|V=v_i,A=a)\), where \(Y\) denotes the outcome of either cases or hospitalizations. Dividing the expressions for vaccination status \(V=v_1\) and \(V=v_2\) (1 or two dose) by the one for vaccination status \(V=v_0\) (no vaccination) gives the risk ratio in each category.
What we are interested in is the causal (given our model) total effect of vaccinations on cases and hospitalizations. We can show the vaccine effectiveness for each age group separately, and also estimate the overall vaccine effectiveness by utilizing the adjustment formulas from above.
Given the fairly small sample of one month of BC data, together with inaccuracies when scraping the data out of the graphs, we are running 1,000 bootstrap samples of the (simulated) underlying line list data (including healthy individuals) derived from the scraped graphs.
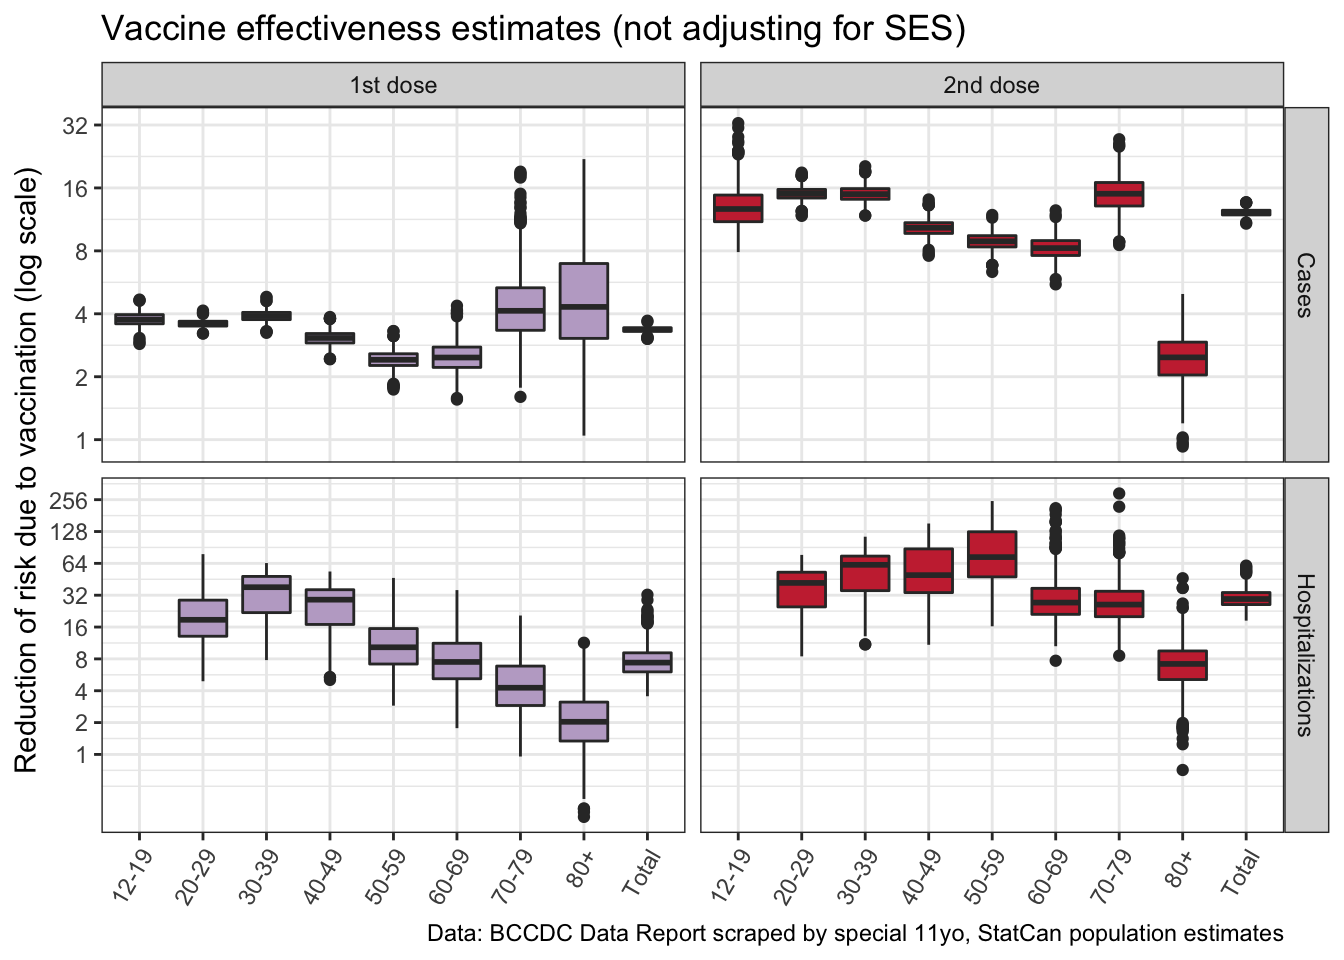
Overall this confirms that vaccines are highly effective against becoming symptomatic (“case”) and even more against becoming hospitalized! It also stresses the importance of people getting their second shot, even though there is some caution as the data we have does not break out the timing between vaccines and having contracted COVID. Getting the second shot increases the vaccine protection by a factor 4, resulting in a 12-fold protection against symptomatic COVID and a 29-fold protection against hospitalizations.
We can zoom into the bottom right quadrant, total vaccine effectiveness against hospitalizations for fully vaccinated people. This is the estimate we care about most.
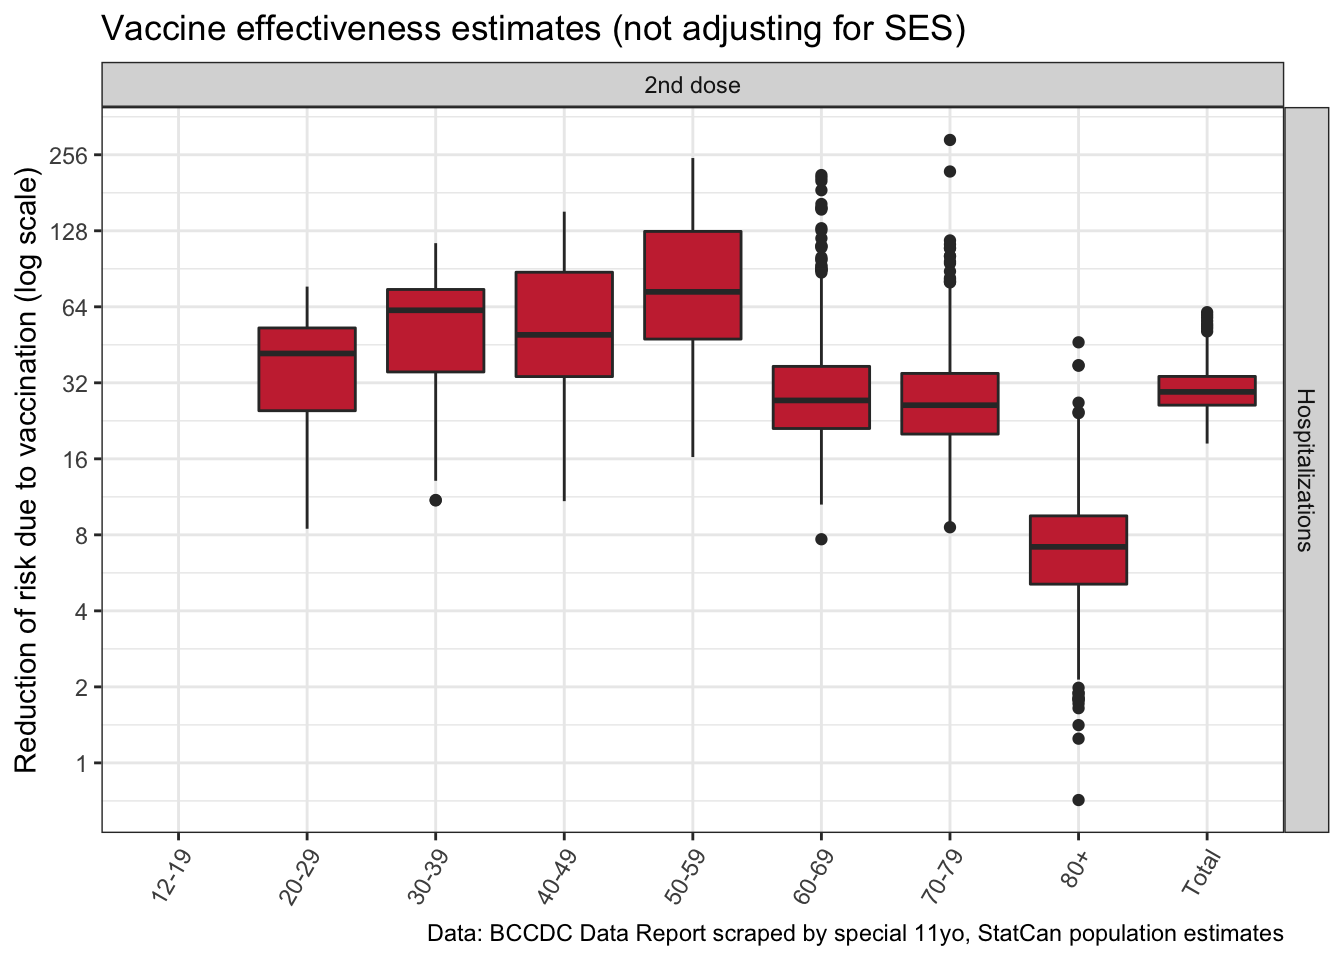
This result is also consistent with older people, especially the 80+ population, not getting the same level of protection from 2 doses compared to younger populations.
Why adjust for Age?
But did we really have to do all this work of adjusting for age? We can compare our age-adjusted effectiveness to the unadjusted naive estimate when ignoring age.
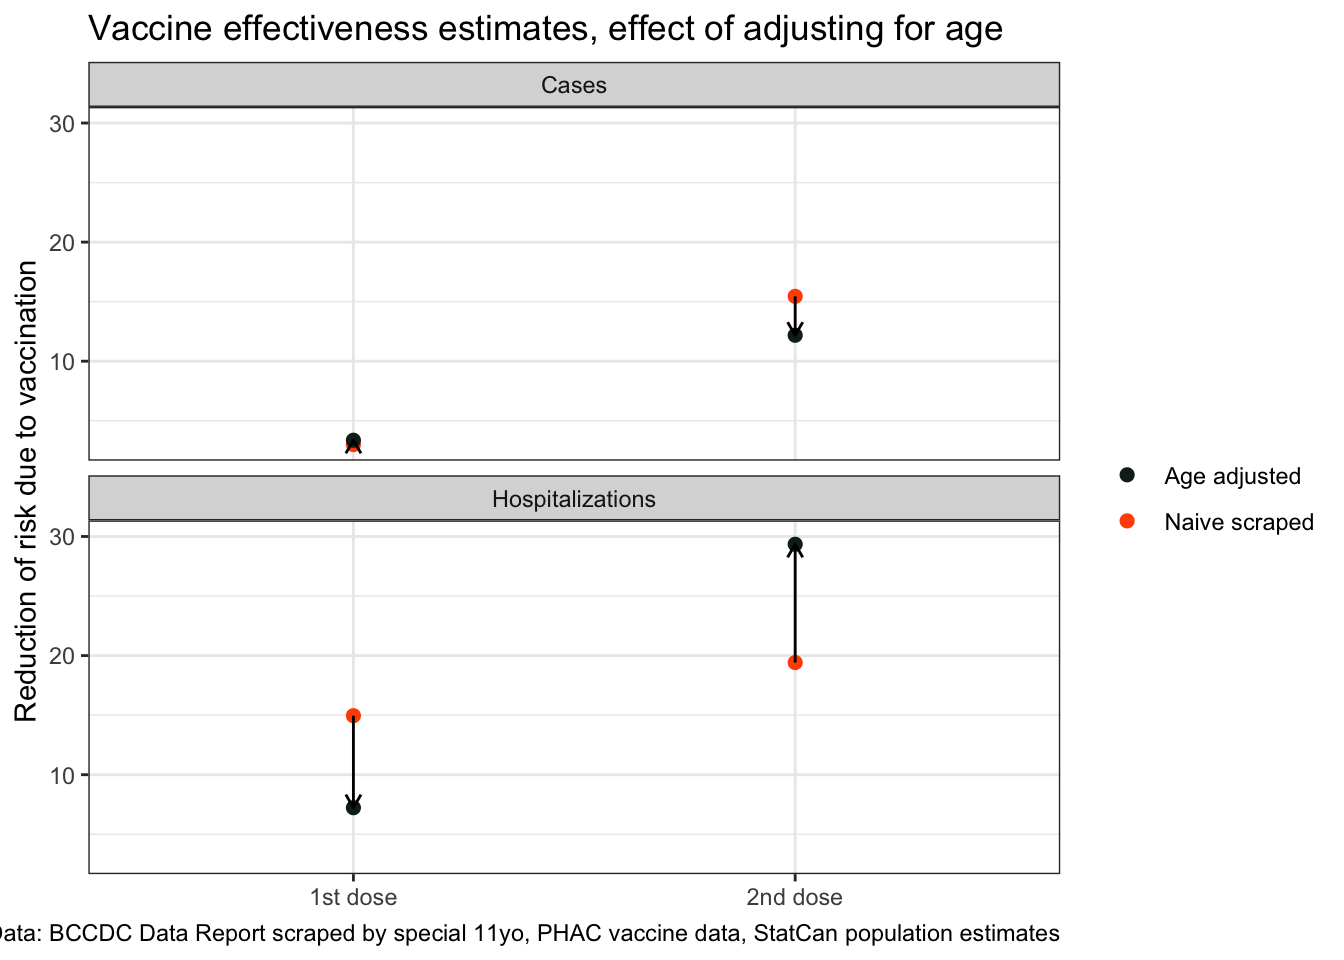
This demonstrates the power of age as a confounder when trying to estimate vaccine effectiveness, especially when it comes to effectiveness against hospitalizations.
Missing SES and causal vaccine effectiveness estimates
After seeing how large the effect of adjusting for age is in our vaccine effectiveness estimates we can appreciate the difference between causal estimates and simple statistical estimates. In BC we can’t account for SES factors because this data was not collected, but it seems reasonable to question if at this point the unvaccinated population shares the same relevant SES features as the vaccinated population.
Unlike age, the impacts of SES are hard to sign, their single causal pathways in our first DAG up top should be viewed as the combined effect of a collection of mechanisms, many of which come in with opposite signs. However, we should not assume that these effects cancel out.
For example, looking at the difference in first vs second dose effectiveness against “cases” in 80+ year olds we notice a significant increase in risk ratio, so a decrease in vaccine effectiveness. This seems implausible and points to the population of 80+ year olds with only one dose differing significantly from the those with two doses. We don’t see the same difference in hospitalizations, which might be explained by the population of 80+ year olds with two doses, which includes people in long term care, being more likely to get tested.
Estimating the uncertainty due to unobserved SES variables requires adding in simulated SES effects, but this is beyond the scope of this post.
Direct and indirect vaccination effects on hospitalizations mediated through cases
Hospitalizations are mediated through cases, there are two causal pathways how vaccines reduce hospitalizations. One is indirect by reducing symptomatic COVID and thus hospitalizations which are a consequence of symptomatic COVID. The other is directly by reducing the chance a person with symptomatic COVID will develop symptoms severe enough to require hospitalization.
To understand how hospitalizations are mediated through cases we estimate the direct effect of vaccines on hospitalizations for people with symptomatic COVID (cases).
\[ VE_{D(C)}^i = 1-\frac{P(H=1|do(V=v_i),do(C=1))}{P(H=1|do(V=v_0),do(C=1))}. \]
This allows us to ascertain how vaccinations reduce hospitalizations, by reducing symptomatic infections and leave the risk of hospitalization unchanged given symptomatic infection, or if vaccines also reduce the risk of hospitalization given breakthrough symptomatic infection and requires estimation of the quantities
\[ P(H=1|do(V=v_i),do(C=1)) = \sum_a P(H=1|V=v_i,C=1,A=a)P(A=a). \]
This gets complicated by not having access to line-level data and having to make assumptions about timing, which we will gloss over.
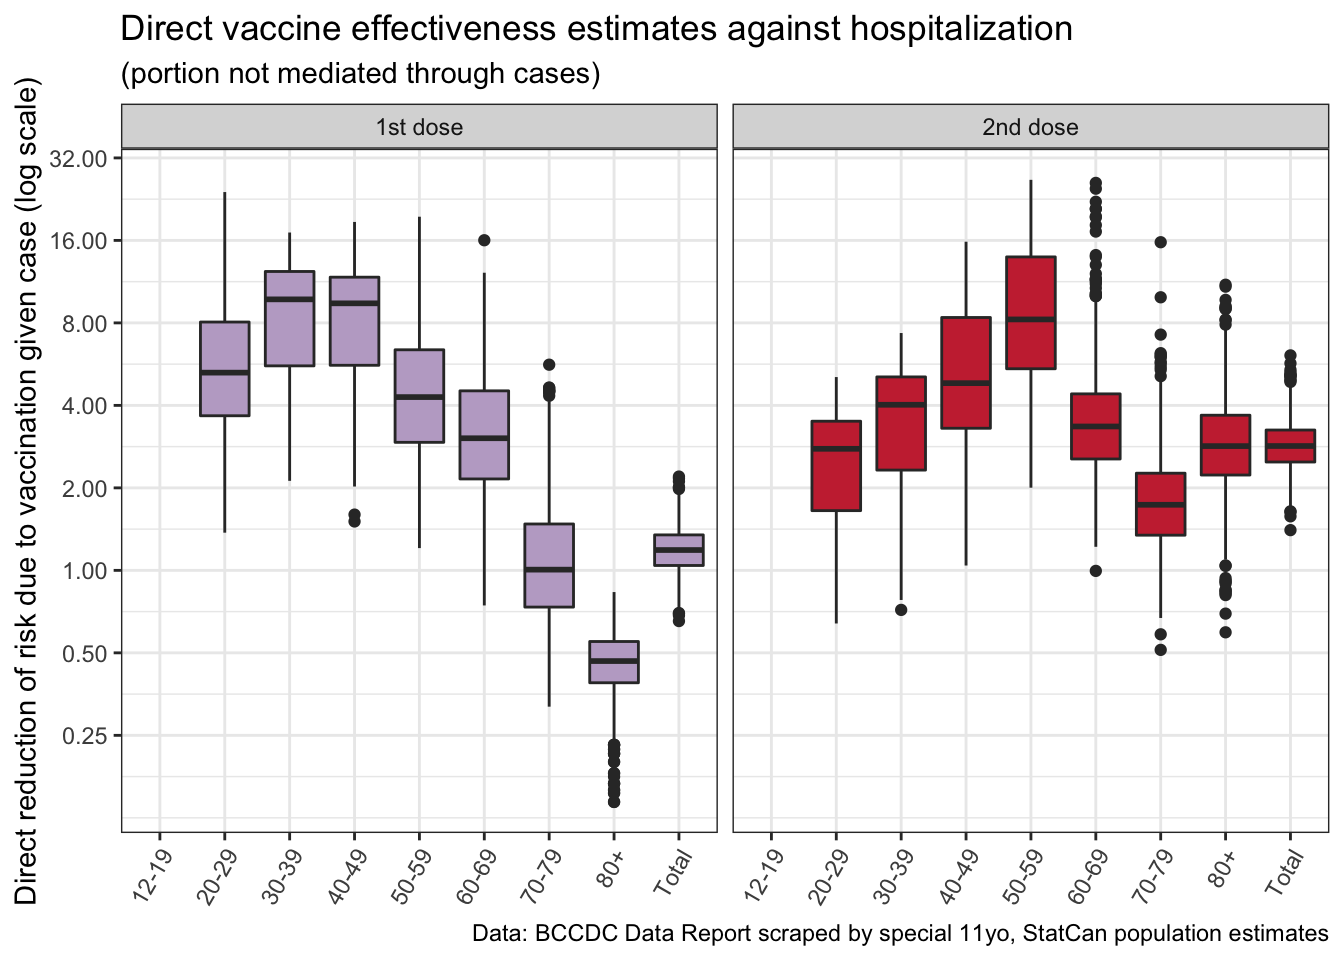
Here we run into issues with our data, likely because of failure to adjust for SES. The 80+ year old age group with only 1 dose shows an increased risk of getting hospitalized, given they have symptomatic COVID. This seems contradictory to all we know about how COVID and vaccines work, and points to the population of 80+ year olds with a single dose being substantially different from the population of unvaccinated 80+ year olds. Data for the fully vaccinated population looks a little better and gives some indication that vaccines protect us not just by preventing symptomatic COVID, but also by reducing the severity of the disease for people that do exhibit symptoms.
Upshot
Vaccine effectiveness estimates are difficult, they require proper accounting of confounders to be meaningful. Age is an important one as age heavily impacts both the likelihood of developing symptomatic COVID as well as the likely severity. Not adjusting for age is likely to substantially bias vaccine effectiveness downward.
Over the past year we have learned that SES is also an important factor in COVID, it impacts vaccine effectiveness in a variety of ways, from the vaccine rollout and vaccine uptake, to risk to be exposed to COVID, to test seeking behaviour, to likelihood of severe outcomes due to comorbidities. Unfortunately BC does not collect the relevant data which renders vaccine effectiveness estimates difficult to do with BC data. But there is no reason to expect that vaccines behave fundamentally different in BC compared to other jurisdictions, which allows us to have confidence in vaccine effectiveness data from jurisdictions where better estimates are possible.
As usual, the code for this post is available on GitHub for anyone to reproduce or adapt for their own purposes.
Reproducibility receipt
## [1] "2021-08-31 10:32:49 PDT"## Local: master /Users/jens/Google Drive/R/mountaindoodles
## Remote: master @ origin (https://github.com/mountainMath/doodles.git)
## Head: [34a1425] 2021-08-31: image positions## R version 4.1.0 (2021-05-18)
## Platform: x86_64-apple-darwin17.0 (64-bit)
## Running under: macOS Big Sur 10.16
##
## Matrix products: default
## BLAS: /Library/Frameworks/R.framework/Versions/4.1/Resources/lib/libRblas.dylib
## LAPACK: /Library/Frameworks/R.framework/Versions/4.1/Resources/lib/libRlapack.dylib
##
## locale:
## [1] en_CA.UTF-8/en_CA.UTF-8/en_CA.UTF-8/C/en_CA.UTF-8/en_CA.UTF-8
##
## attached base packages:
## [1] stats graphics grDevices utils datasets methods base
##
## other attached packages:
## [1] googlesheets4_1.0.0 cansim_0.3.9 forcats_0.5.1
## [4] stringr_1.4.0 dplyr_1.0.7 purrr_0.3.4
## [7] readr_2.0.1 tidyr_1.1.3 tibble_3.1.3
## [10] ggplot2_3.3.5 tidyverse_1.3.1
##
## loaded via a namespace (and not attached):
## [1] Rcpp_1.0.7 lubridate_1.7.10 assertthat_0.2.1 digest_0.6.27
## [5] utf8_1.2.2 R6_2.5.1 cellranger_1.1.0 backports_1.2.1
## [9] reprex_2.0.0 evaluate_0.14 httr_1.4.2 blogdown_1.4
## [13] pillar_1.6.2 rlang_0.4.11 readxl_1.3.1 rstudioapi_0.13
## [17] jquerylib_0.1.4 sanzo_0.1.0 rmarkdown_2.8 googledrive_2.0.0
## [21] munsell_0.5.0 broom_0.7.6 compiler_4.1.0 modelr_0.1.8
## [25] xfun_0.24 pkgconfig_2.0.3 htmltools_0.5.1.1 tidyselect_1.1.1
## [29] bookdown_0.22 fansi_0.5.0 crayon_1.4.1 tzdb_0.1.2
## [33] dbplyr_2.1.1 withr_2.4.2 grid_4.1.0 jsonlite_1.7.2
## [37] gtable_0.3.0 lifecycle_1.0.0 DBI_1.1.1 git2r_0.28.0
## [41] magrittr_2.0.1 scales_1.1.1 cli_3.0.1 stringi_1.7.3
## [45] fs_1.5.0 xml2_1.3.2 bslib_0.2.5.1 ellipsis_0.3.2
## [49] generics_0.1.0 vctrs_0.3.8 tools_4.1.0 glue_1.4.2
## [53] hms_1.1.0 yaml_2.2.1 colorspace_2.0-1 gargle_1.2.0
## [57] rvest_1.0.1 knitr_1.33 haven_2.4.1 sass_0.4.0Reuse
Citation
@misc{thoughts-on-vaccine-effectivess-estimates.2021,
  author = {{von Bergmann}, Jens},
  title = {Thoughts on Vaccine Effectivess Estimates},
  date = {2021-08-30},
  url = {https://doodles.mountainmath.ca/posts/2021-08-30-thoughts-on-vaccine-effectivess-estimates/},
  langid = {en}
}
