With the first batch of data from the 2021 census we can start to answer some questions about how Vancouver has grown. One of these is how population growth relates to zoning as Gil Meslin reminded me today. It would be very useful to have a custom tabulation available for that, but it will still take a lot of time before 2021 custom tabulations will become available.
In the meantime, we can get a pretty good idea how low-density zoning has or has not contributed to Vancouver’s population growth by following a line of analysis like we did back when the 2016 data came out. The idea is quite simple, we are going to take block level population change data, and divided it into three categories. Block that lie entirely within low-density zones (“Core” blocks), blocks that have parts inside and parts outside of low-density zones (“Fringe” blocks), and blocks that are entirely outside of low-density zones (“Rest”). To refine this a little we will remove parks from the census data, and shrink the census blocks by 10m in all directions to avoid issues with boundaries along roads or other places being drawn slightly differently.
One minor complication is that we don’t have population change at the census block level, StatCan only provides back-calculated 2016 population counts on 2021 census tract geographies or higher. But not to despair, our {tongefen} package is made for just this application and it automates the creation of a common custom geography based on dissemination blocks from 2016 and 2021 where we can get counts from both censuses.
however, nothing is perfect and during this process of taking out parks and messing with the geographies we are losing track of some. Most of these have zero population, but there are some caretaker residences in parks and some geocoding errors in StatCan Data like the strech of beach north of English Bay with a population of 15 people where clearly nobody lives. This kind of mixups happen. But overall regions that fall by the wayside in this analysis only account for 28 people in 2016 and 45 in 2021. Which we are happy to ignore for now.
Just like we did last time around when we ran this analysis we are also going to look separately at low-density “Core” and “Fringe” areas on the West and East sides of the city.
One last question we have to answer is what version of zoning we should look at. We could take the areas zoned for low density housing, specifically the RS, RT and FSHCA districts, as of the starting point in 2016, or as of the endpoint in 2021. Taking the zoning at the end point would focus on population growth low-density zoning via organic growth within the zones, e.g. through addition of suites and laneways. Taking zoning as of the beginning of the period would additionally allow growth via rezonings.
Ideally we would want to split specifically those rezoned areas, but our current data is not fine enough for this and this will require a custom tabulation.
So let’s take a look how this shakes out.

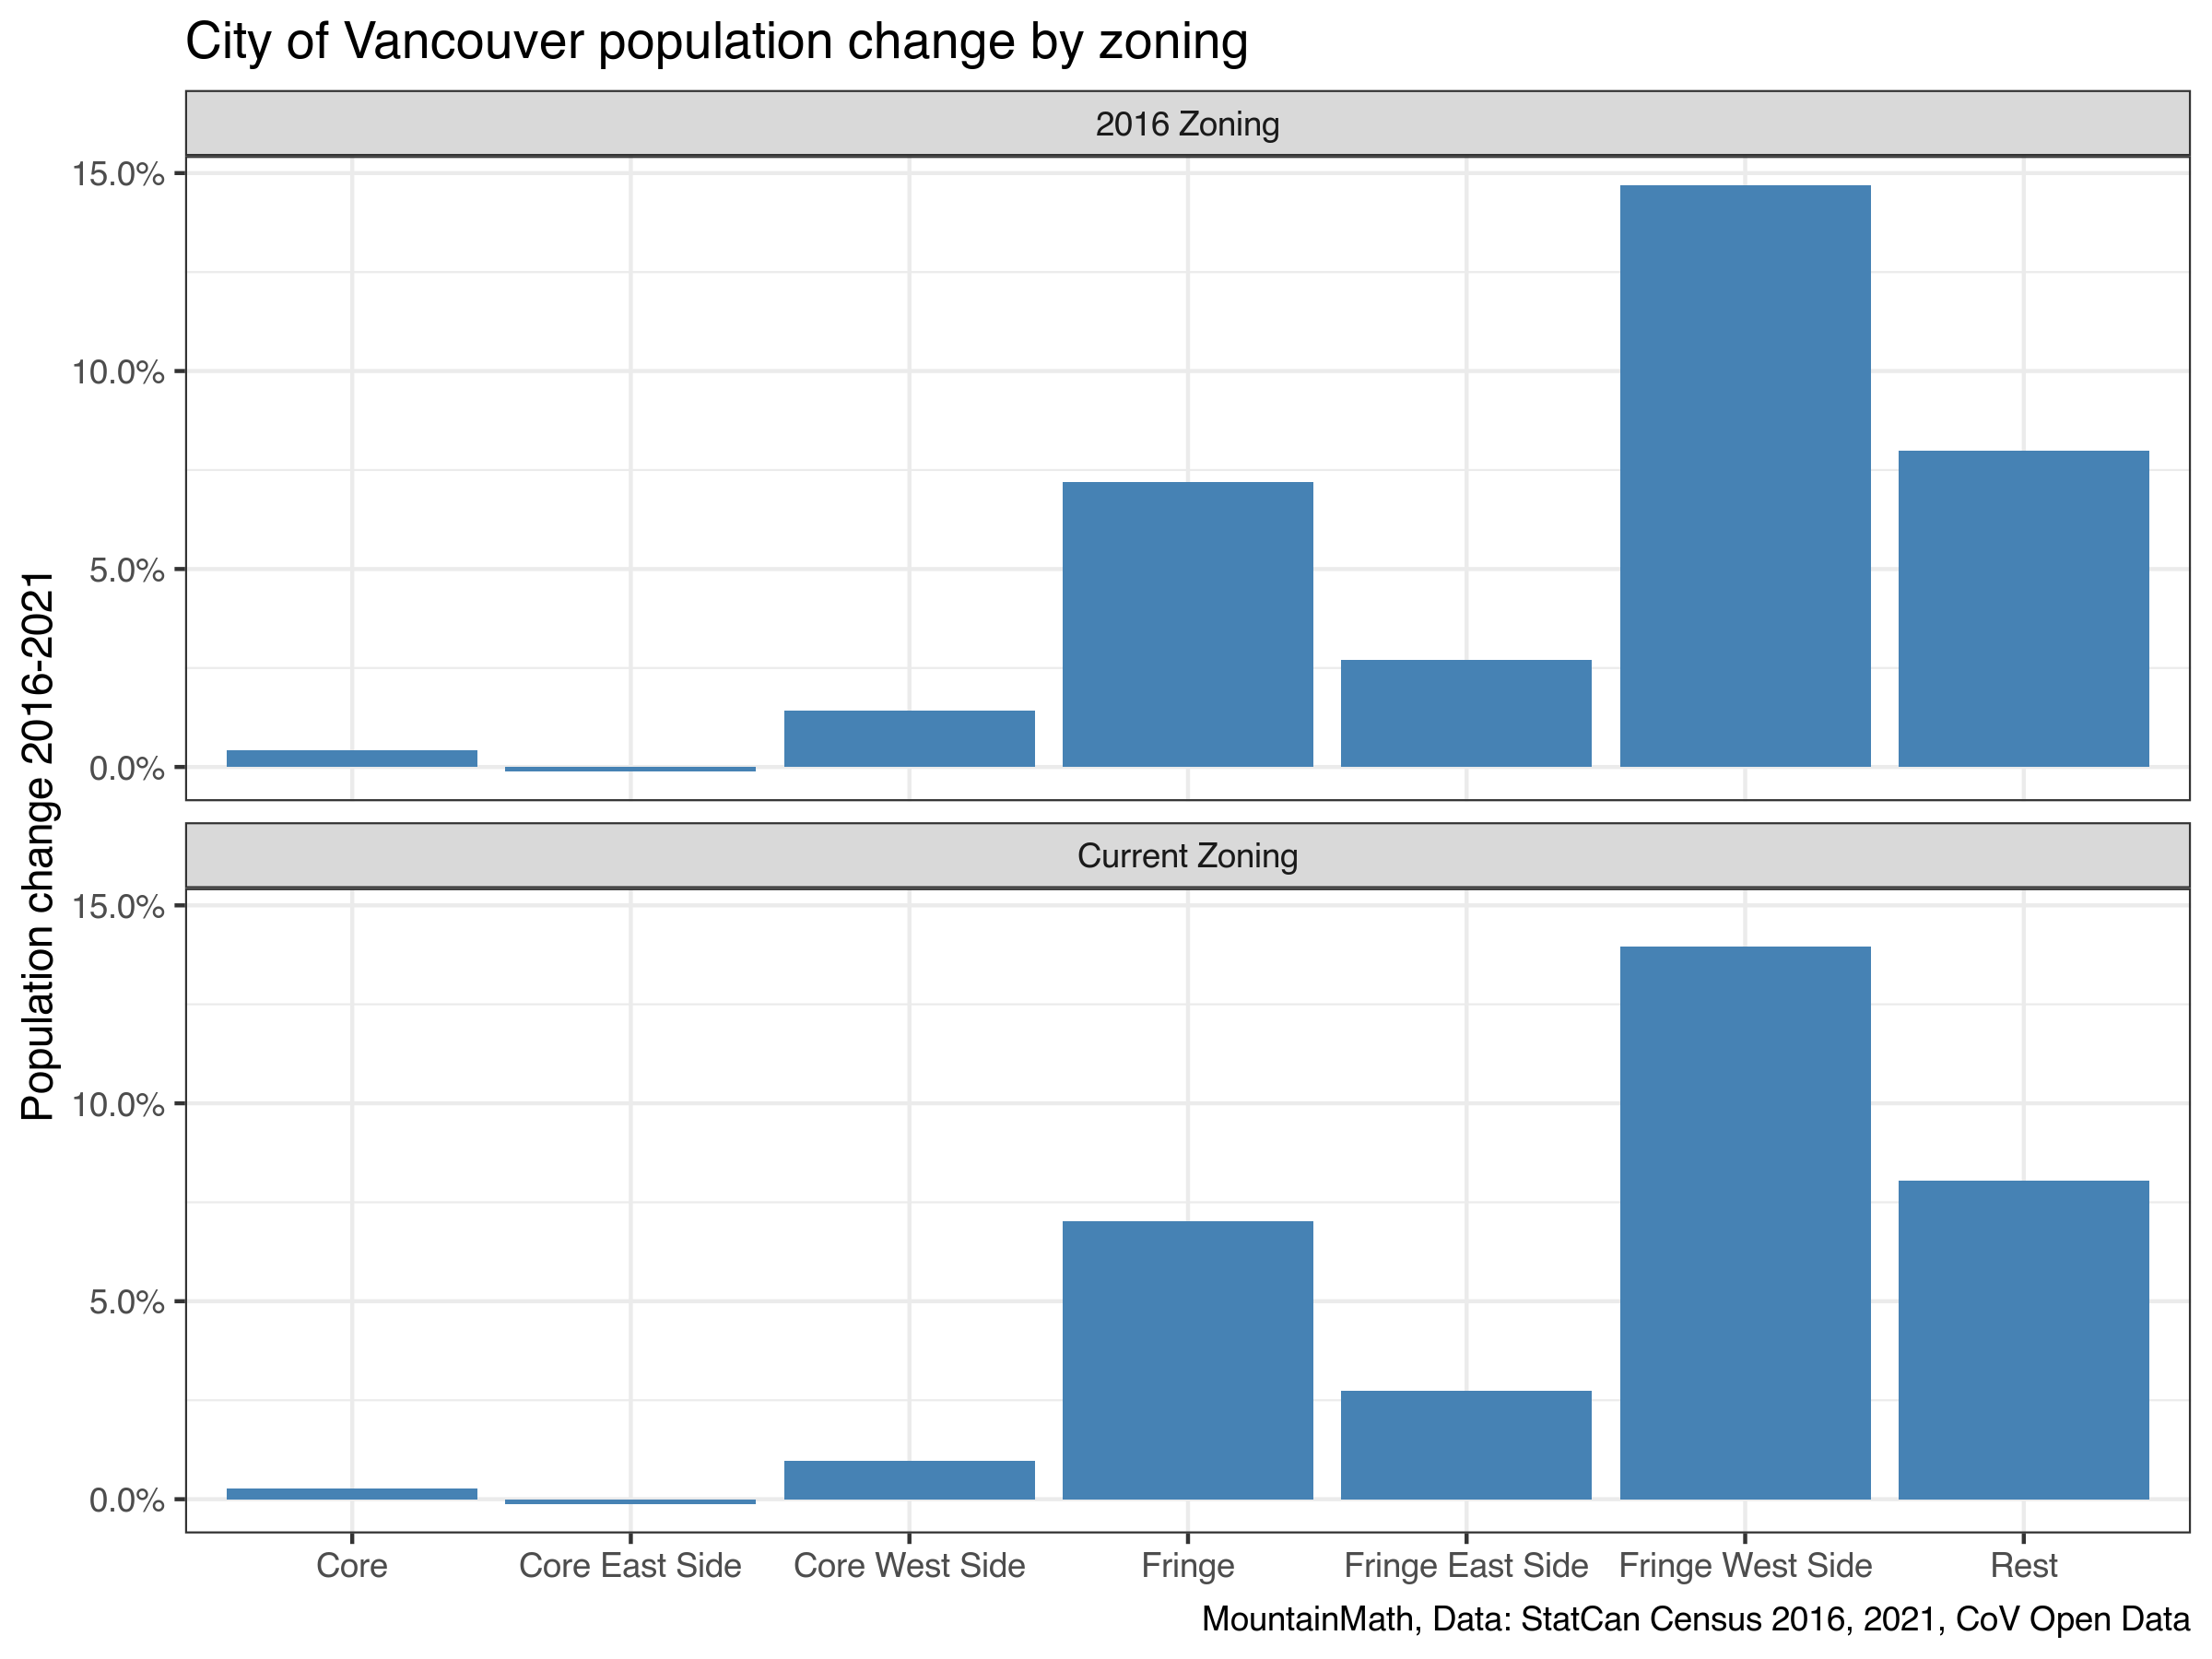
There is surprisingly little difference from the choice of vintage of the zoning fabric. Most of the difference will likely have been in the fringe for either of those two, just because that’s how we most of our rezonings have worked out, our rezonings focus on areas that are already adjacent to higher density zones.
What stands out, just like last time we ran this analysis for the 2011-2016 period, that the Core areas don’t grow much. Low-density zoning is deadbeat zoning, they take up lots of space but don’t contribute to population growth. At least they are not losing population, adding suites and laneways manages to roughly balance out other demographic factors like declining household size. During the 2011-2016 cycle the core areas on the West side lost population and whereas the East side gained population. This time around it’s reversed. Either way, the effects were small and we chalk this up to statistical noise and there isn’t much of a difference.
There does seem to be a difference when it comes to fringe areas, which is likely due to the Cambie Corridor. The other big driver of growth in the fringe areas is C-2 zoning, which generally only extends half a block and will inevitably be caught in the fringe areas. We will need a custom tabulation to disentangle this.
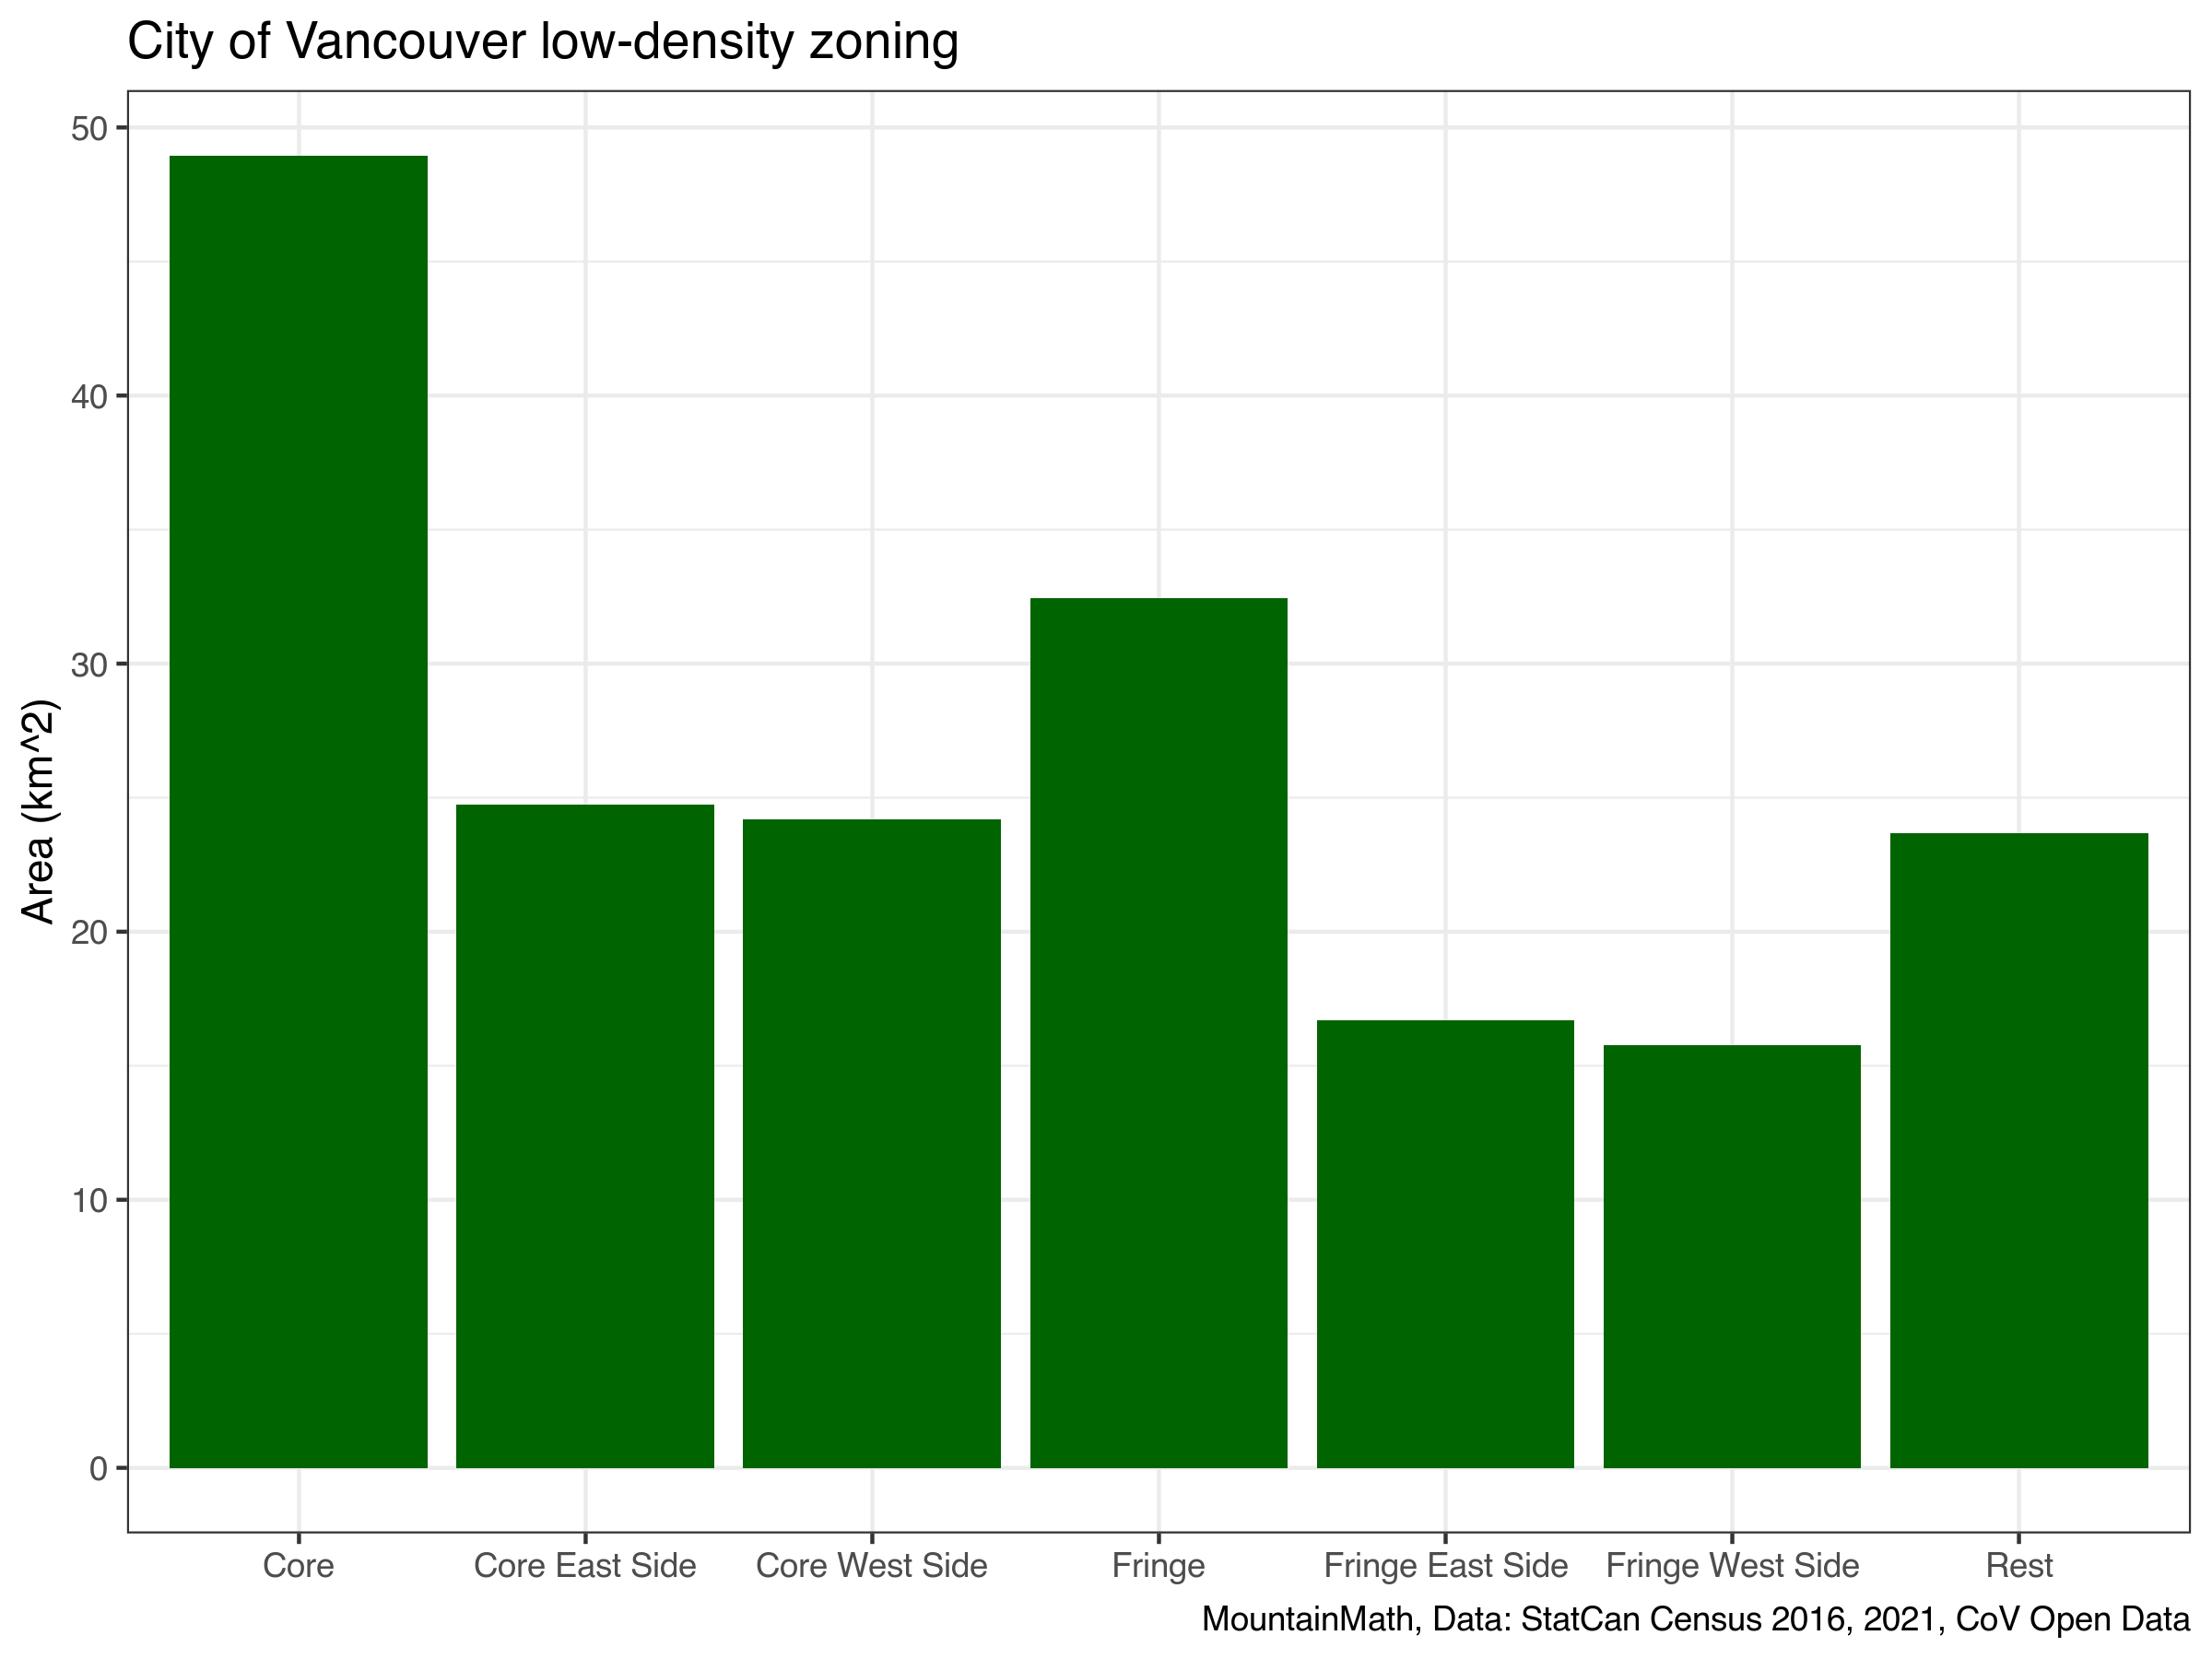
To underline that point, let’s look at how much these various categories take up, after cutting out parks.

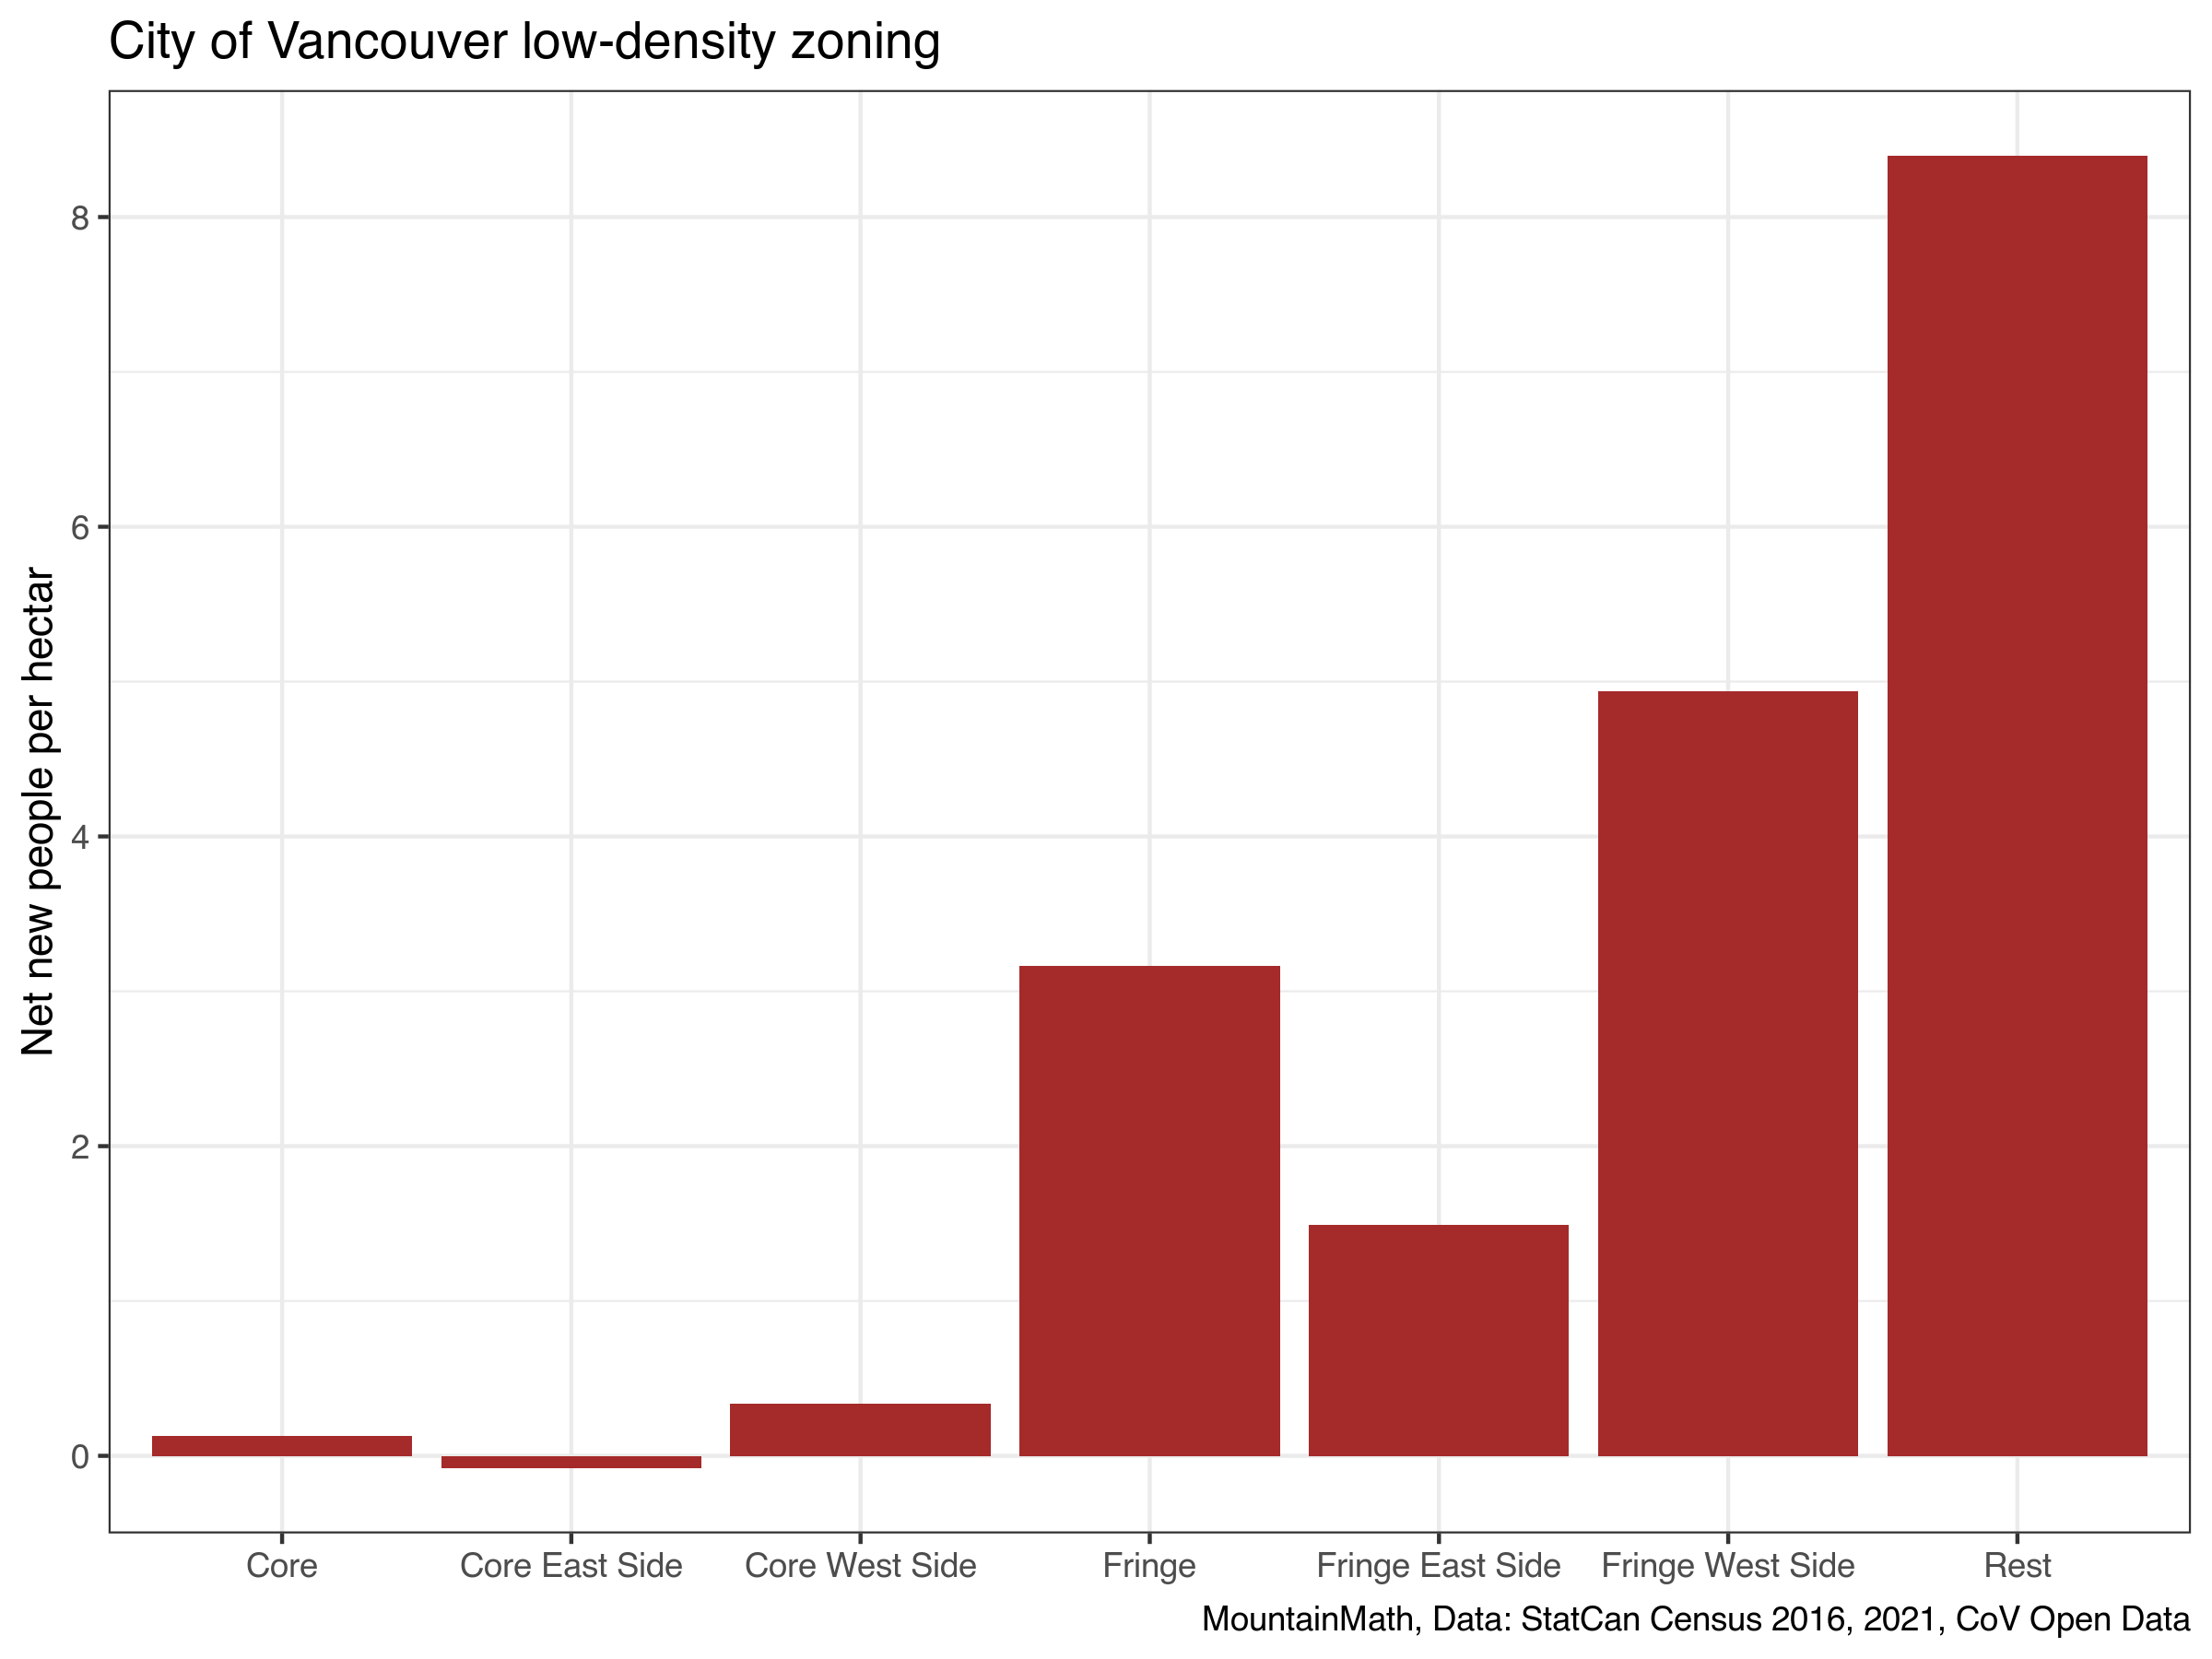
One issue here is that we are including agricultural zoning in Southlands in the “Rest” category, which inflates it’s area. Still, this shows what we already know, the deadbeat core low-density areas take up a huge portion of our city, and the low-density parts of the fringe will add to that. We can combine the data from these last to graphs to see how much population change per area we got for each of these categories.

This makes it very clear which land carries most of the weight when it comes to accommodating our population growth. Bottom line is that low density zoning does exactly what it was designed to do. Nothing. Unless it gets upzoned.
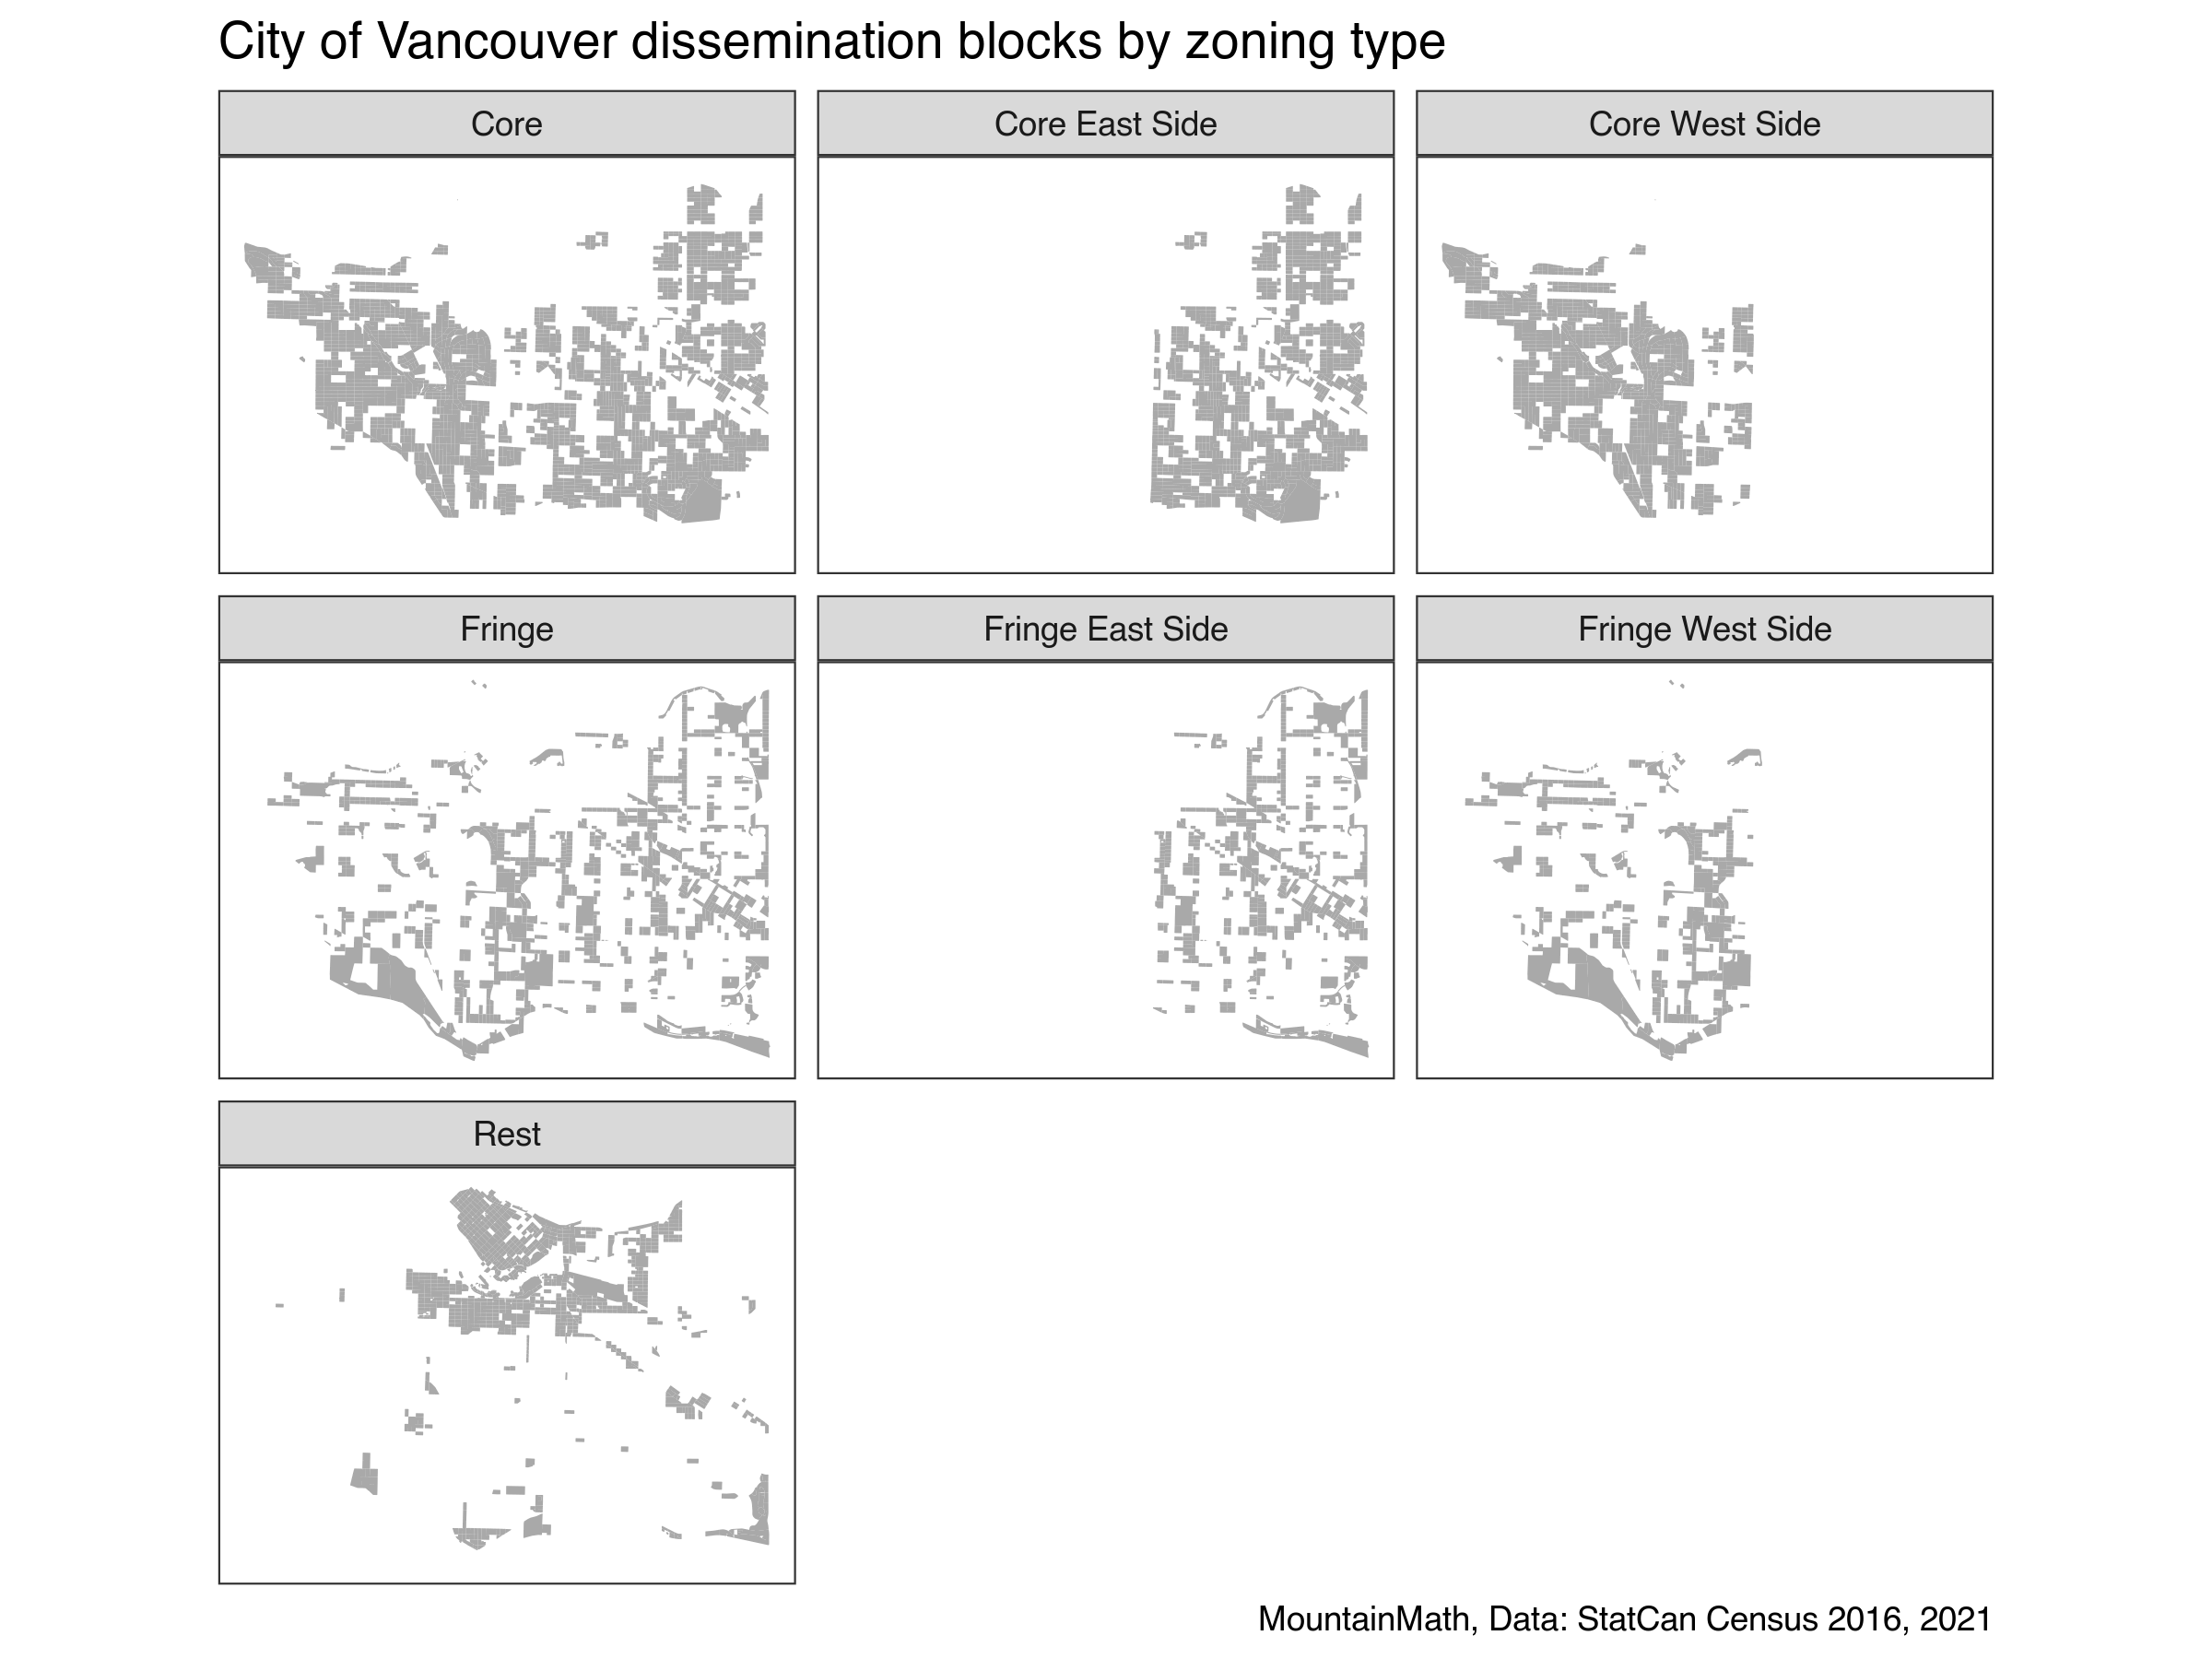
One last thing to do is a quick visual check which areas ended up in the Core, Fringe and Rest categories in relation to low-density zoning.

Update (Feb 13th)
Of course we can ask how this pans out through other Metro Vancouver municipalities. Thanks to our UBC Socioology Zoning Project we can grab the data from our interactive metro wide zonig map and run this for all Metro Vancouver municipalities. We have investigated before how zoning impacts population growth, time to run it against 2021 data.
Additionally we will refine the above analysis by running a second version that includes agricultural zoning. This won’t really make much of a difference in Vancouver, but will matter for some other Metro Vancouver municipalities with large share of agricultural land. However, much of the agricultural zoning is in the flood plains, and the benefits of densifying in this area have to be carefully weighted against the risks. At some point we should come back to this with a more detailed analysis, for now we just run two versions, one with agricultural zoning included in “low density” areas, and one where it’s not included. This really only matters when looking at population change per hectare. (Update Fev 14: Additionally we cut out unzoned areas like roads, which removes some issues where people have been geocoded to highway medians but also dignificantly improves the match of census data to zoning data. However this also hints at data quality problems in the census that are likely to impact some of the analysis. We are removing Pitt Meadows from this analysis because of geocoding problems. A good reminder that census data is not always as accurate as we might light it to be, and visual inspection and ground-truthing of data is important.)

This paints a more varied picture of how growth has been allocated with respect to low-density zoning. Some municipalities, like Surrey and the District of Langley, do manage to add population in low-density zoning. We will need to look in more detail if this is happening due to greenfield development or densification, or due to increasing household sizes as initial naive data suggests. However it should not surprise that all municipalities are better at adding population to higher-density areas, especially when considering the Metro Vancouver Zoning Project zoning data that is pegged to summer 2021, so at the end of our 2016-2021 population change observation period.
Again, all these categories have different areas, and thus the impact of the population change can be quite different. To get a better view of this we can look at total population change per hectare of land in each of these categories, after removing schools and parks. This is where it will matter more if we count agrecultural zoning as part of the low-density areas or not.

This brings home the point that across the region most of the growth happens outside of low-density areas, especially if we include agricultural land in our low-density base.
As usual, the code for this post, including the code to scrape the data out of the PDFs, is available on GitHub for anyone to reproduce or adapt.
Reproducibility receipt
## [1] "2022-05-11 08:35:12 PDT"## Local: master /Users/jens/Documents/R/mountaindoodles
## Remote: master @ origin (https://github.com/mountainMath/doodles.git)
## Head: [f6dd25d] 2022-05-11: typo, thanks Bert!## R version 4.2.0 (2022-04-22)
## Platform: aarch64-apple-darwin20 (64-bit)
## Running under: macOS Monterey 12.3.1
##
## Matrix products: default
## BLAS: /Library/Frameworks/R.framework/Versions/4.2-arm64/Resources/lib/libRblas.0.dylib
## LAPACK: /Library/Frameworks/R.framework/Versions/4.2-arm64/Resources/lib/libRlapack.dylib
##
## locale:
## [1] en_CA.UTF-8/en_CA.UTF-8/en_CA.UTF-8/C/en_CA.UTF-8/en_CA.UTF-8
##
## attached base packages:
## [1] stats graphics grDevices utils datasets methods base
##
## other attached packages:
## [1] sf_1.0-7 mountainmathHelpers_0.1.4
## [3] VancouvR_0.1.7 tongfen_0.3.5
## [5] forcats_0.5.1 stringr_1.4.0
## [7] dplyr_1.0.8 purrr_0.3.4
## [9] readr_2.1.2 tidyr_1.2.0
## [11] tibble_3.1.7 ggplot2_3.3.6
## [13] tidyverse_1.3.1
##
## loaded via a namespace (and not attached):
## [1] Rcpp_1.0.8.3 lubridate_1.8.0 class_7.3-20 assertthat_0.2.1
## [5] digest_0.6.29 utf8_1.2.2 R6_2.5.1 cellranger_1.1.0
## [9] backports_1.4.1 reprex_2.0.1 e1071_1.7-9 evaluate_0.15
## [13] httr_1.4.2 blogdown_1.9 pillar_1.7.0 rlang_1.0.2
## [17] readxl_1.4.0 rstudioapi_0.13 jquerylib_0.1.4 rmarkdown_2.13
## [21] urltools_1.7.3 triebeard_0.3.0 munsell_0.5.0 proxy_0.4-26
## [25] broom_0.8.0 compiler_4.2.0 modelr_0.1.8 xfun_0.30
## [29] pkgconfig_2.0.3 htmltools_0.5.2 tidyselect_1.1.2 bookdown_0.26
## [33] fansi_1.0.3 crayon_1.5.1 tzdb_0.3.0 dbplyr_2.1.1
## [37] withr_2.5.0 grid_4.2.0 jsonlite_1.8.0 gtable_0.3.0
## [41] lifecycle_1.0.1 DBI_1.1.2 git2r_0.30.1 magrittr_2.0.3
## [45] units_0.8-0 scales_1.2.0 KernSmooth_2.23-20 cli_3.3.0
## [49] stringi_1.7.6 fs_1.5.2 xml2_1.3.3 bslib_0.3.1
## [53] ellipsis_0.3.2 generics_0.1.2 vctrs_0.4.1 tools_4.2.0
## [57] glue_1.6.2 hms_1.1.1 fastmap_1.1.0 yaml_2.3.5
## [61] colorspace_2.0-3 classInt_0.4-3 rvest_1.0.2 knitr_1.38
## [65] haven_2.5.0 sass_0.4.1Reuse
Citation
@misc{deadbeat-zoning.2022,
  author = {{von Bergmann}, Jens},
  title = {Deadbeat Zoning},
  date = {2022-02-11},
  url = {https://doodles.mountainmath.ca/posts/2022-02-11-deadbeat-zoning/},
  langid = {en}
}
