How much have City of Vancouver neighbourhoods changed 2016-2021? We have our interactive Canada-wide population change map on CensusMapper showing 2016-2021 population change down to the census tract level, and we have looked at finer geography population change using TongFen. But sometimes we don’t want maps but just a list of how city neighbourhoods changed.
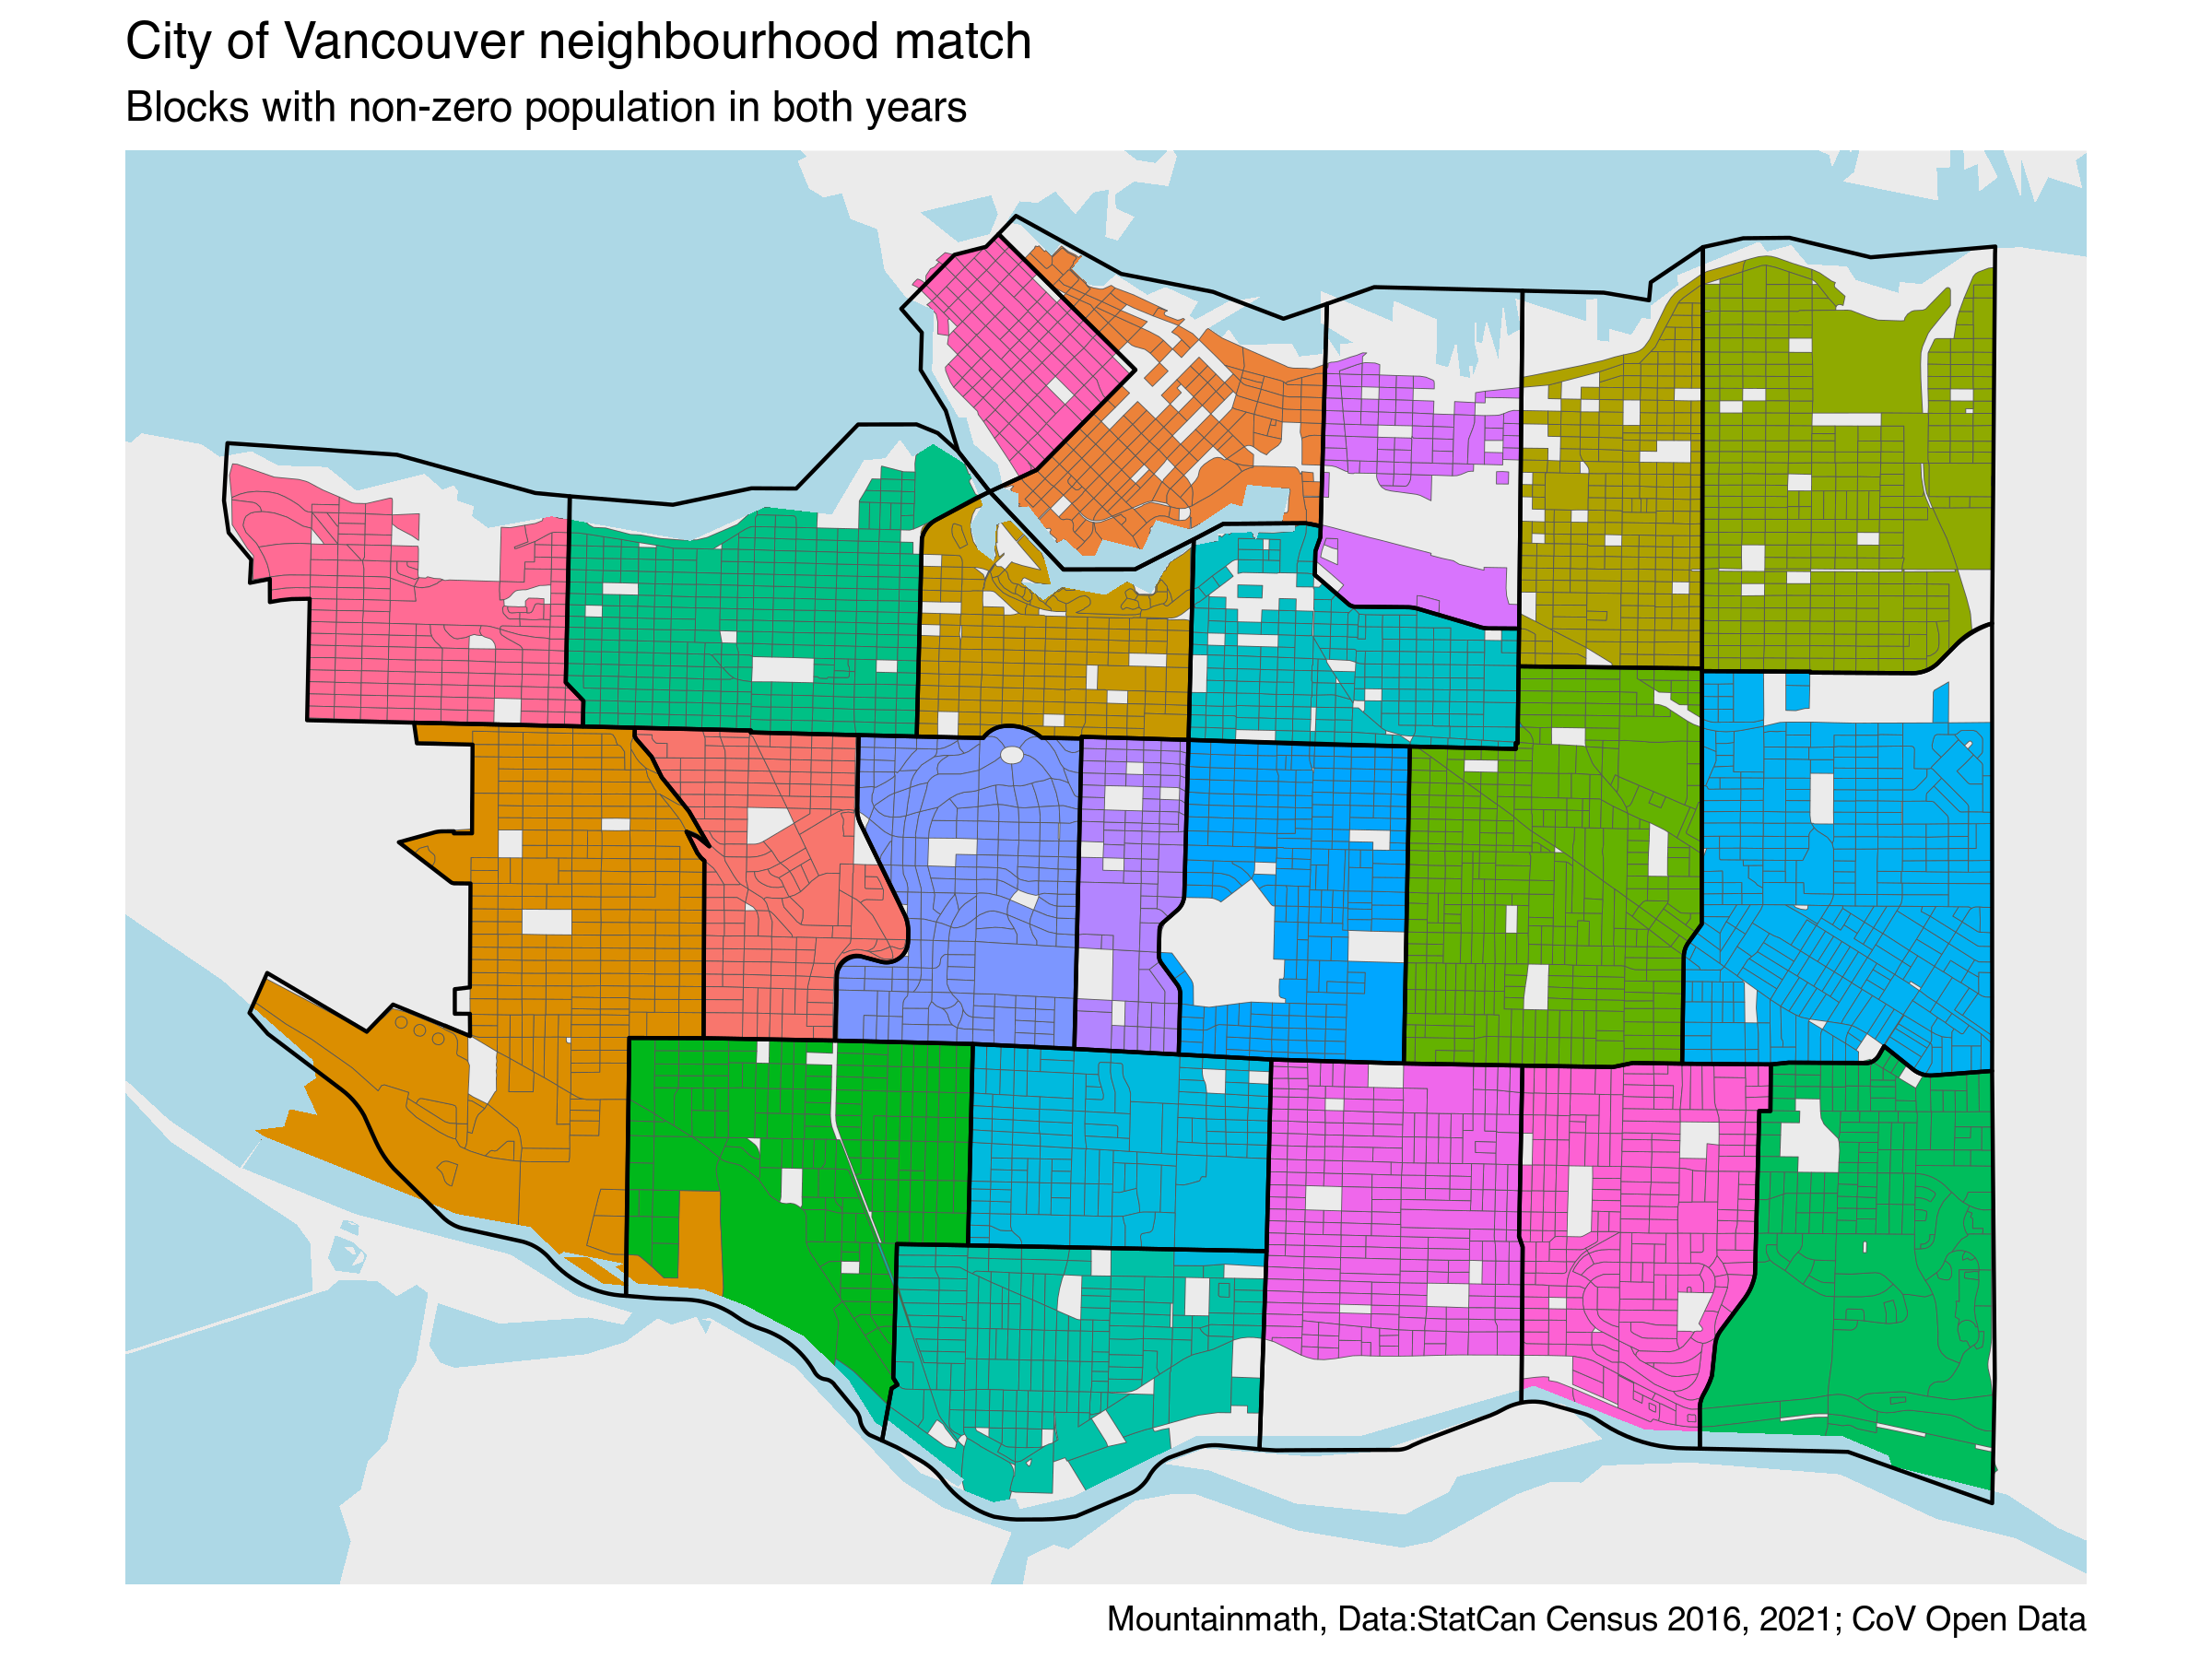
The city pulls a custom tabulation for city neighbourhood geographies for every census, but that will still take more than year until that arrives. Until then we can use TongFen to get good estimates, just like what we did for our deadbeat zoning post to go down to block level and build a least common denominator geography for the 2016 and 2021 based on the respective dissemination blocks. Then we can categorize the geographies by which neighbourhood they (mostly) fall in. Strictly speaking we are going to look at the City of Vancouver together with Musqueam 2, which is part of the Dunbar-Southlands neighbourhood.
Let’s take a look what that matchup between the (harmonized) dissemination blocks and the city neighbourhoods looks like.

Overall the match is good, with the exception of a small areas of Kerrisdale bleeding into Dunbar-Southlands in this classification. We will ignore this for this post. Part of the advantage of creating the unified geography is that the population in that area will be consistently classified as Dunbar-Southlands for both censuses.
Absolute population change
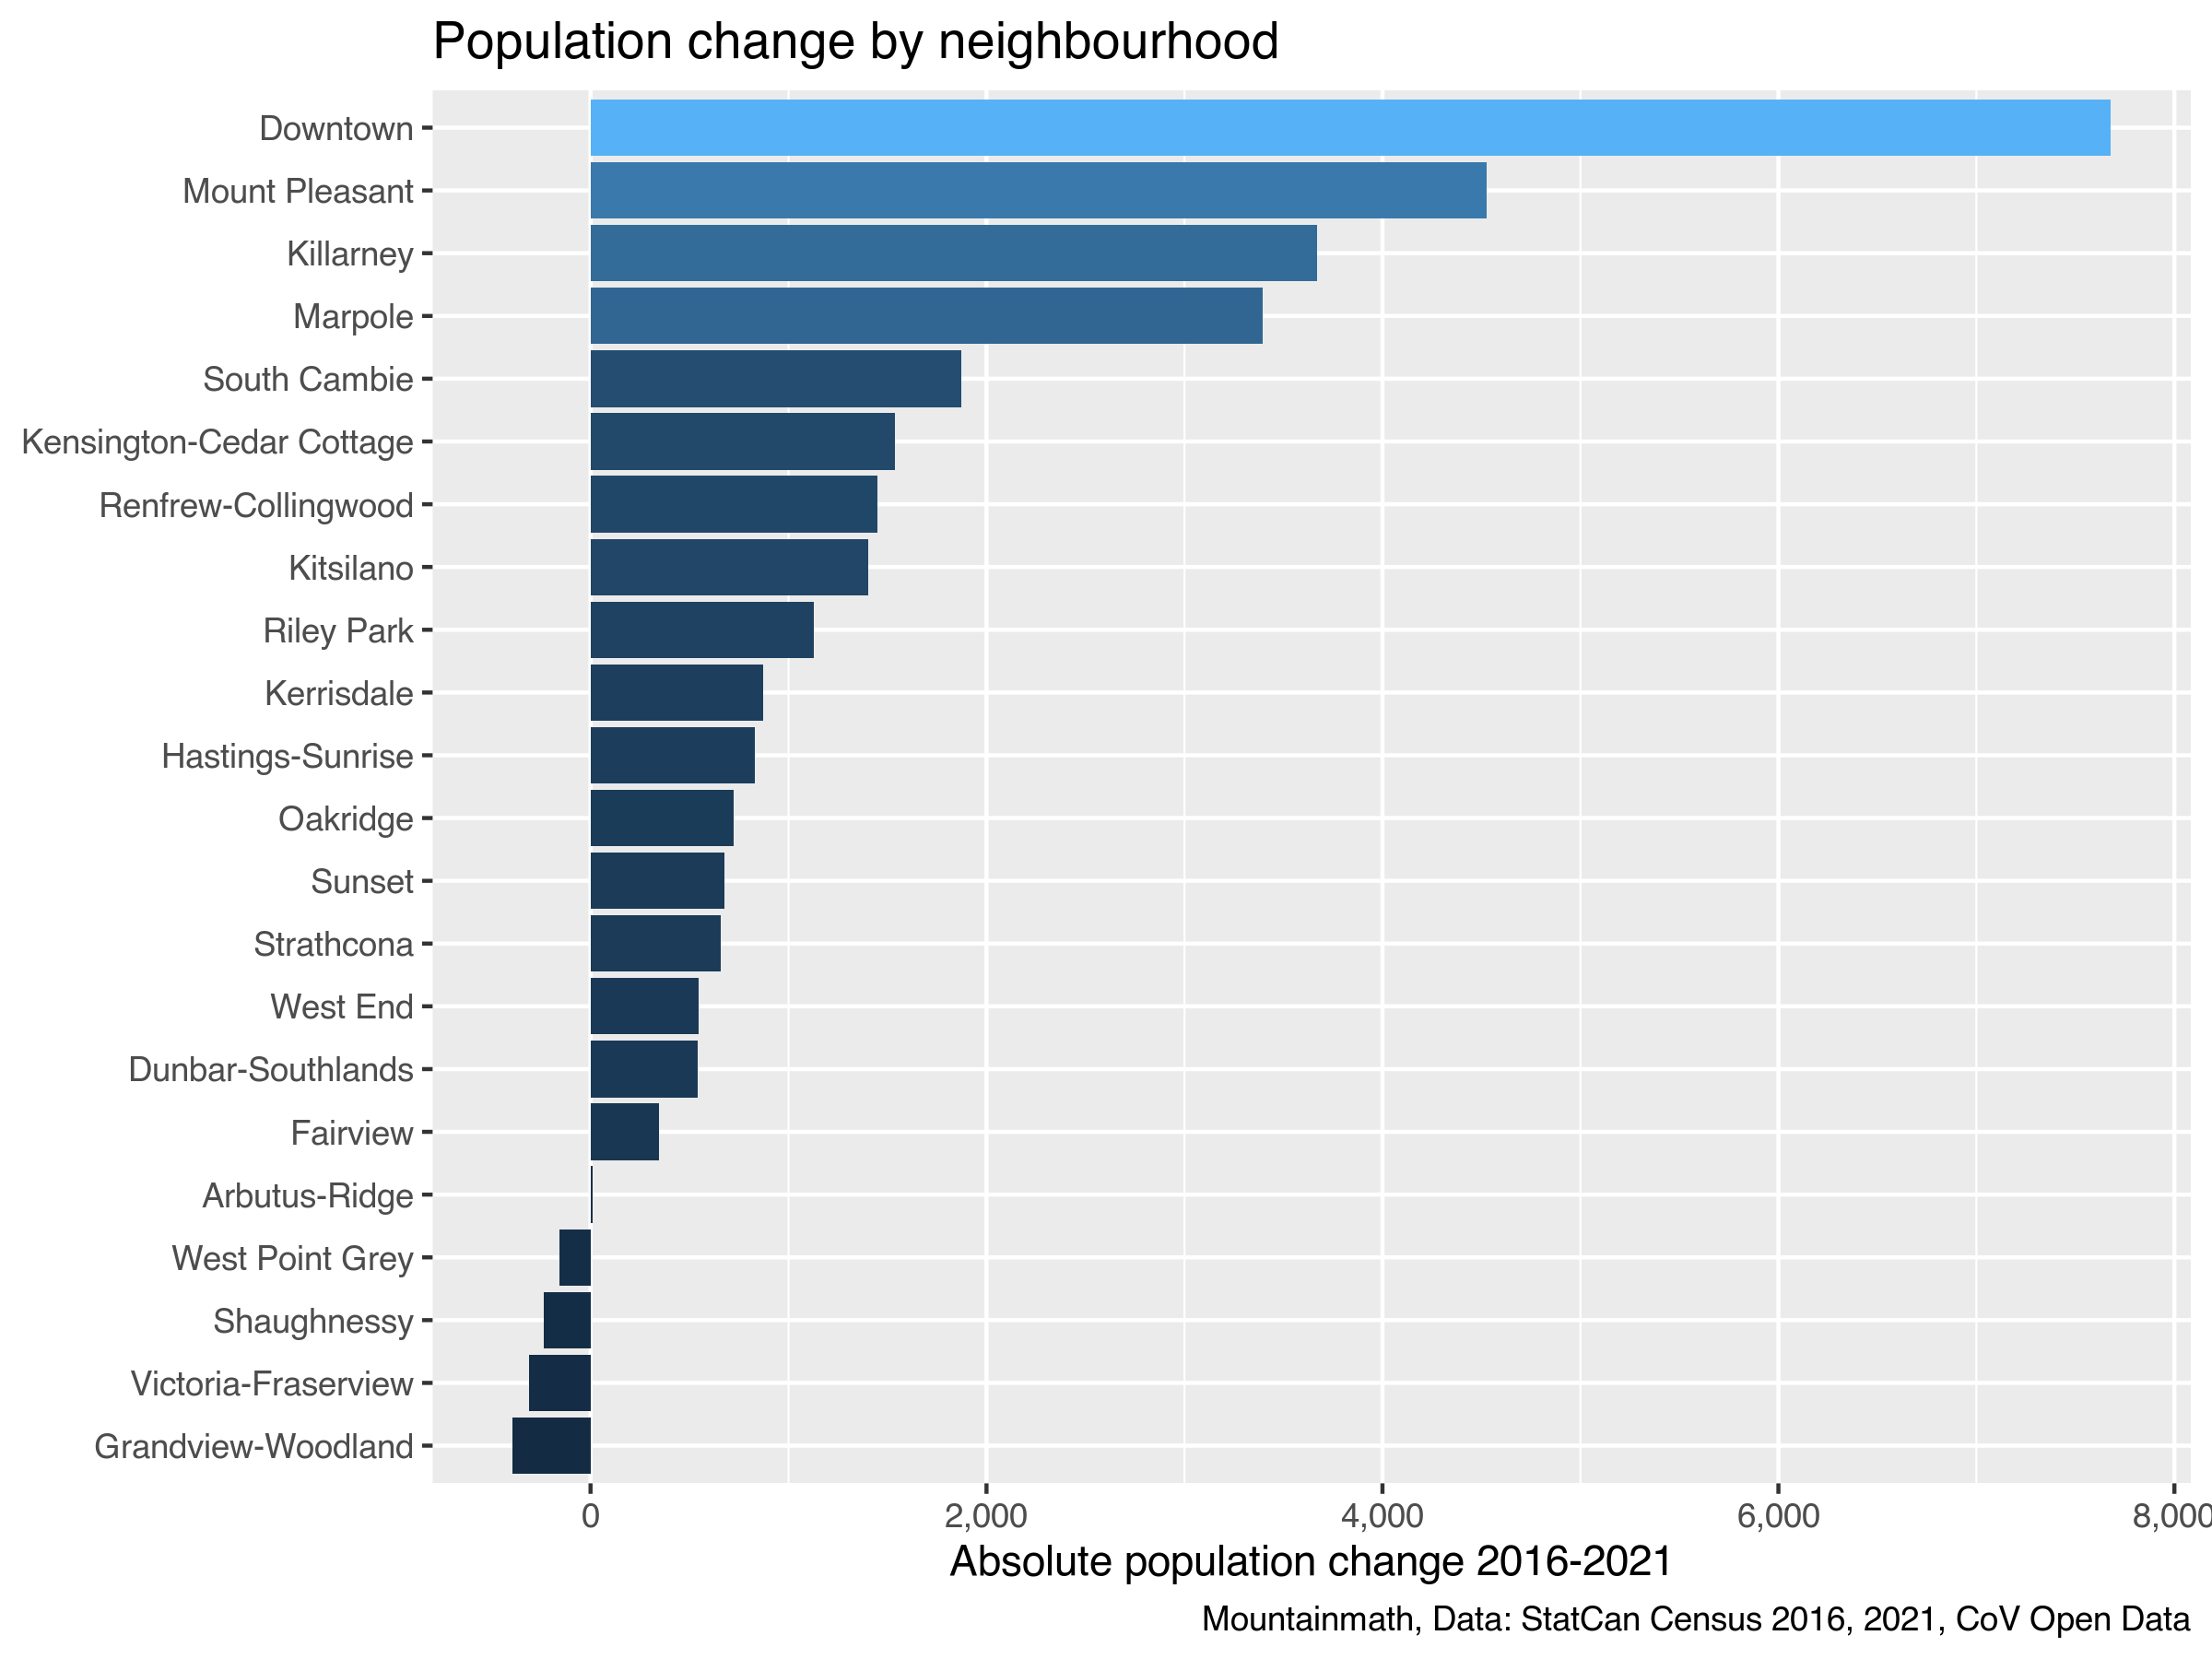
First, let’s look at absolute population change. Which neighbourhood added the most people, and which added the least.

It’s probably not a surprise that Downtown, Mount Pleasant, and Marpole lead the pack. That’s where a lot of the development in this city has been concentrated over this cycle. On the other end of the spectrum we see neighbourhoods with population drops, with the “No Towers” neighbourhood of Grandview-Woodland seeing the highest population drop. In total, the census counted 28 more dwelling units in 2021 compared to 2016 in Grandview-Woodland, not nearly enough to make up for other demographic factors like declining household size.
We don’t have income data yet, but it will be interesting to see the effects of the gentrification pressure on Grandview Woodland resulting from this lack of adding housing. Looking at census tract level taxfiler data that takes us up to 2017 Grandview-Woodland stands out as one of the areas with the highest drop in low-income population and large increase in median income.
Relative population change
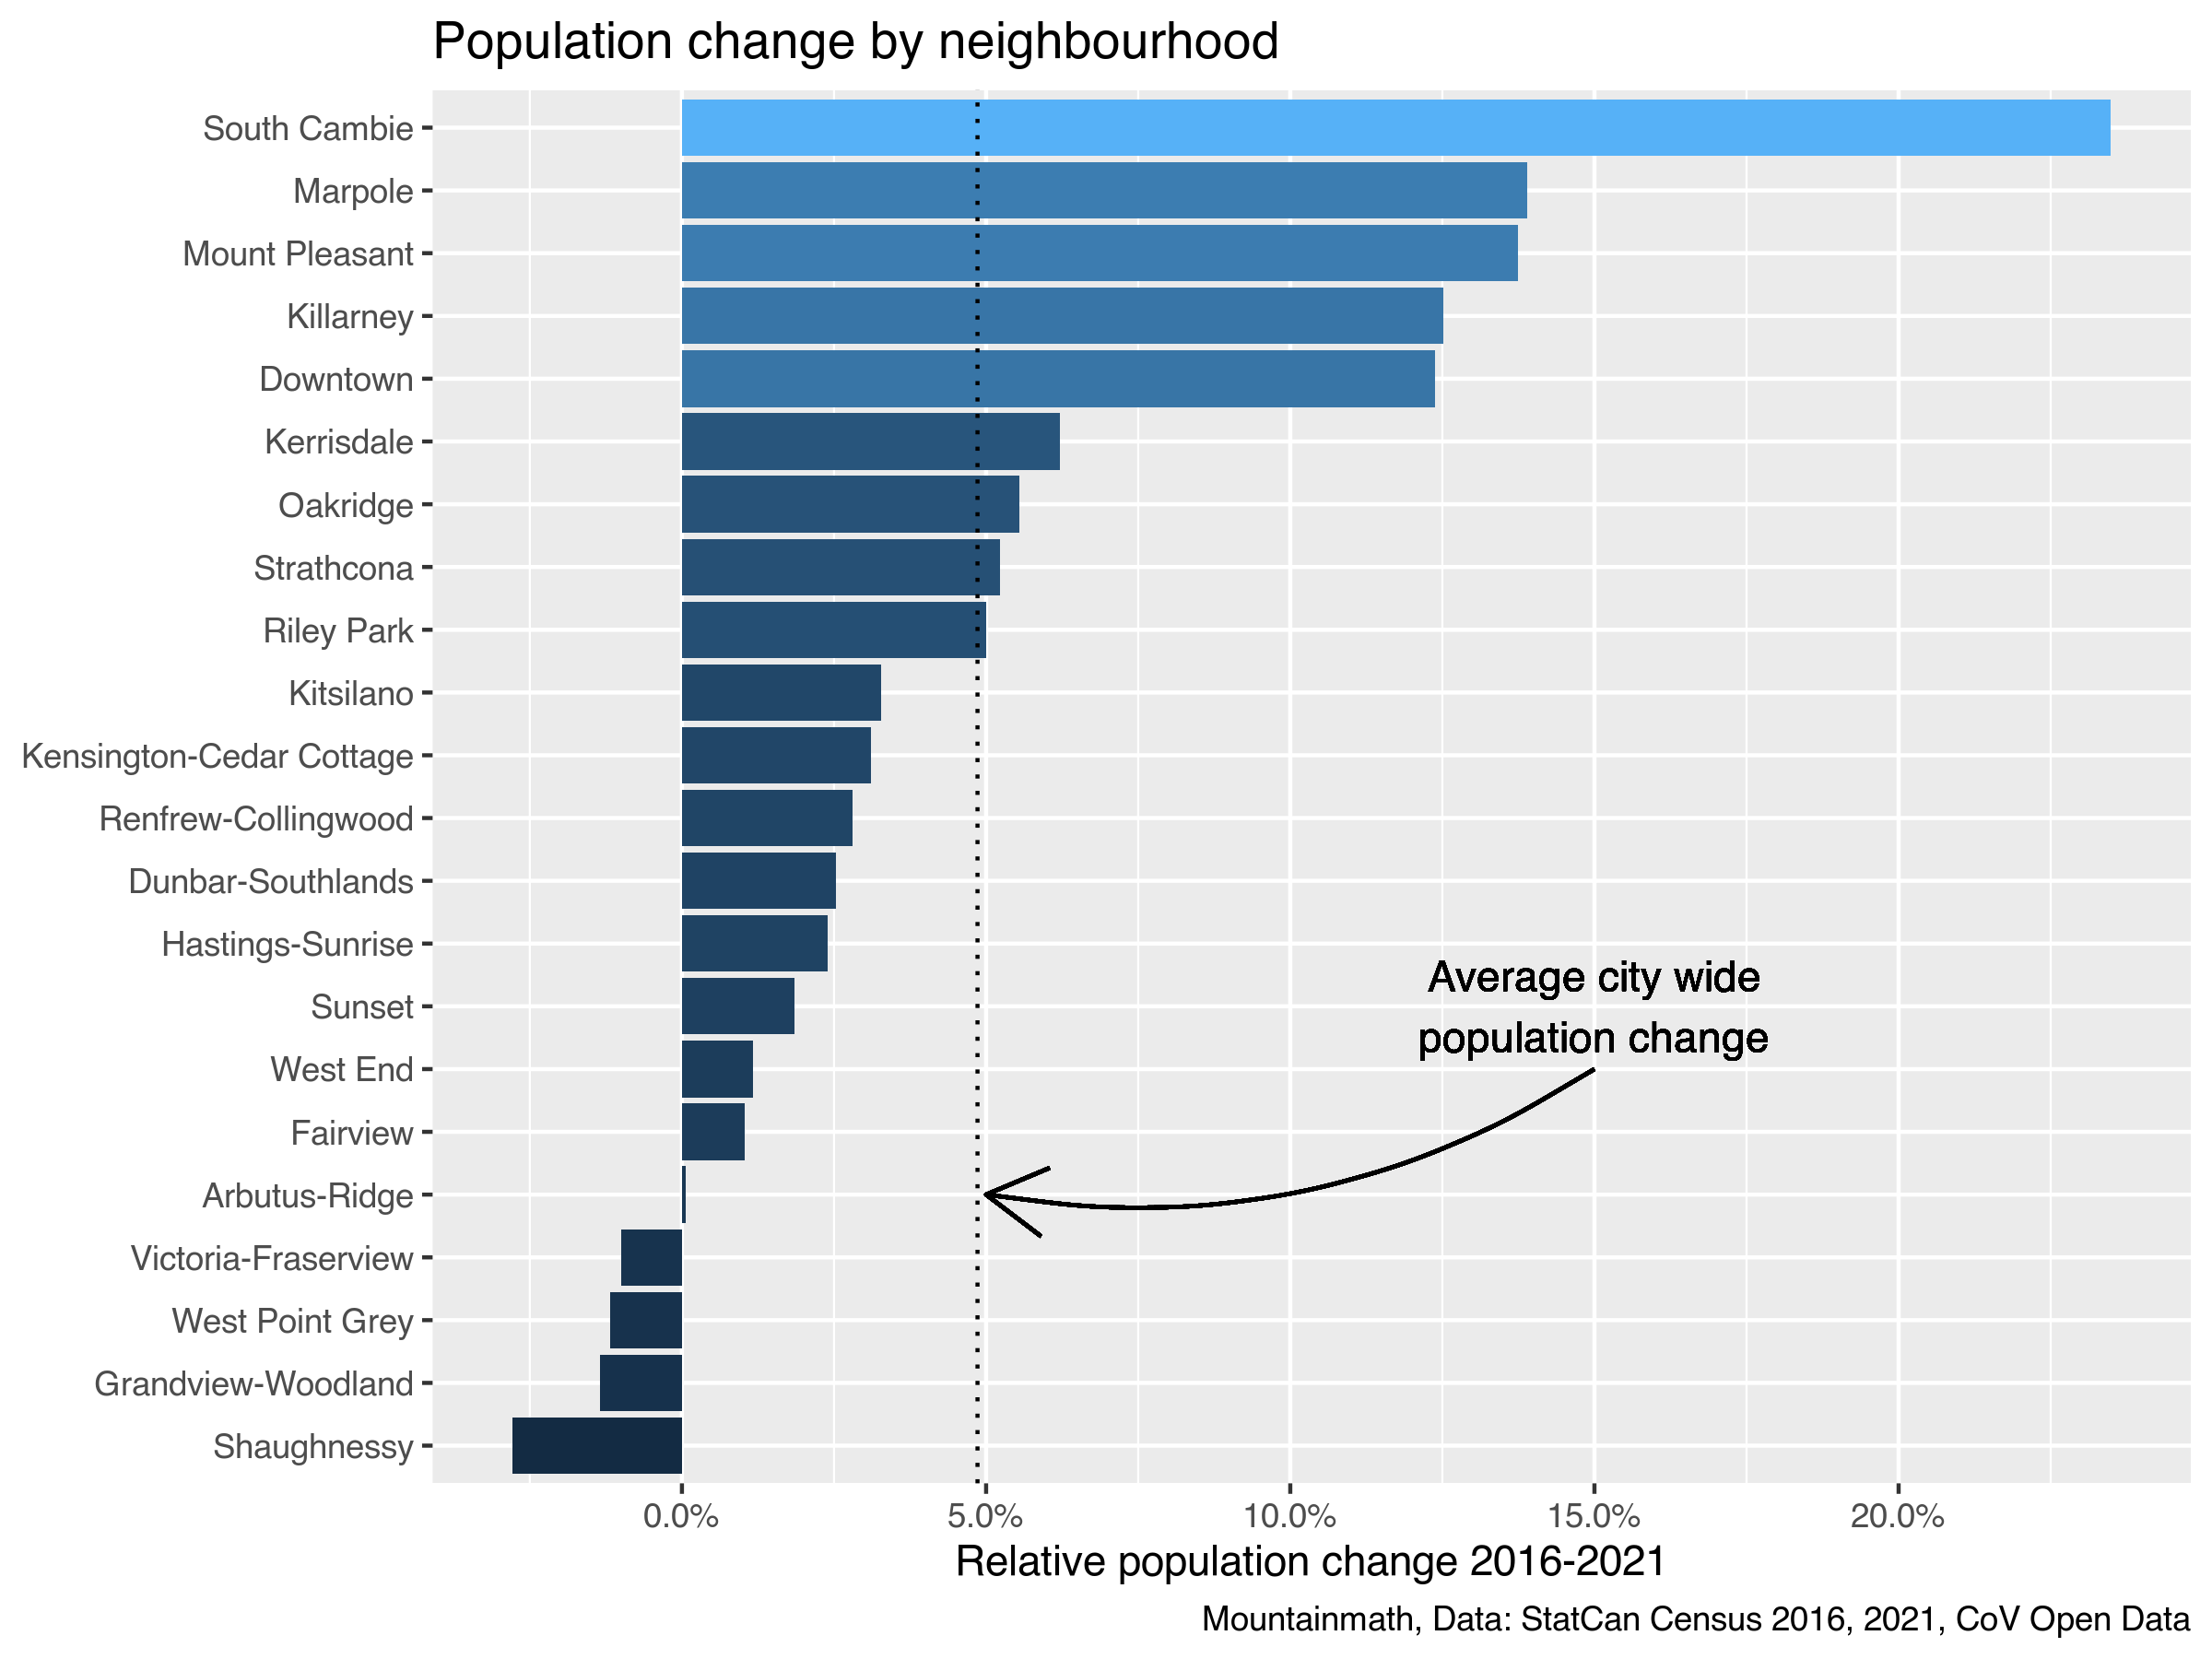
Not all neighbourhoods are the same (population) size, so growth by the same number of people can feel different in different neighbourhoods. Let’s look at relative population change by neighbourhood.

That reshuffles things a little, with South Cambie rising to the top where densification along the Cambie Corridor has added significant population to the otherwise fairly low-population neighbourhood. At the bottom end Shaughnessey takes the lead, due to its already quite small starting population.
When comparing to the city average growth rate there have to be neighbourhoods that punch above their weight and neighbourhoods that fall below the average. For the next round we should pay special attention to those neighbourhoods that have fallen behind, and especially to the deadbeat neighbourhoods that have gone the opposite direction and dropped population.
Components of population change
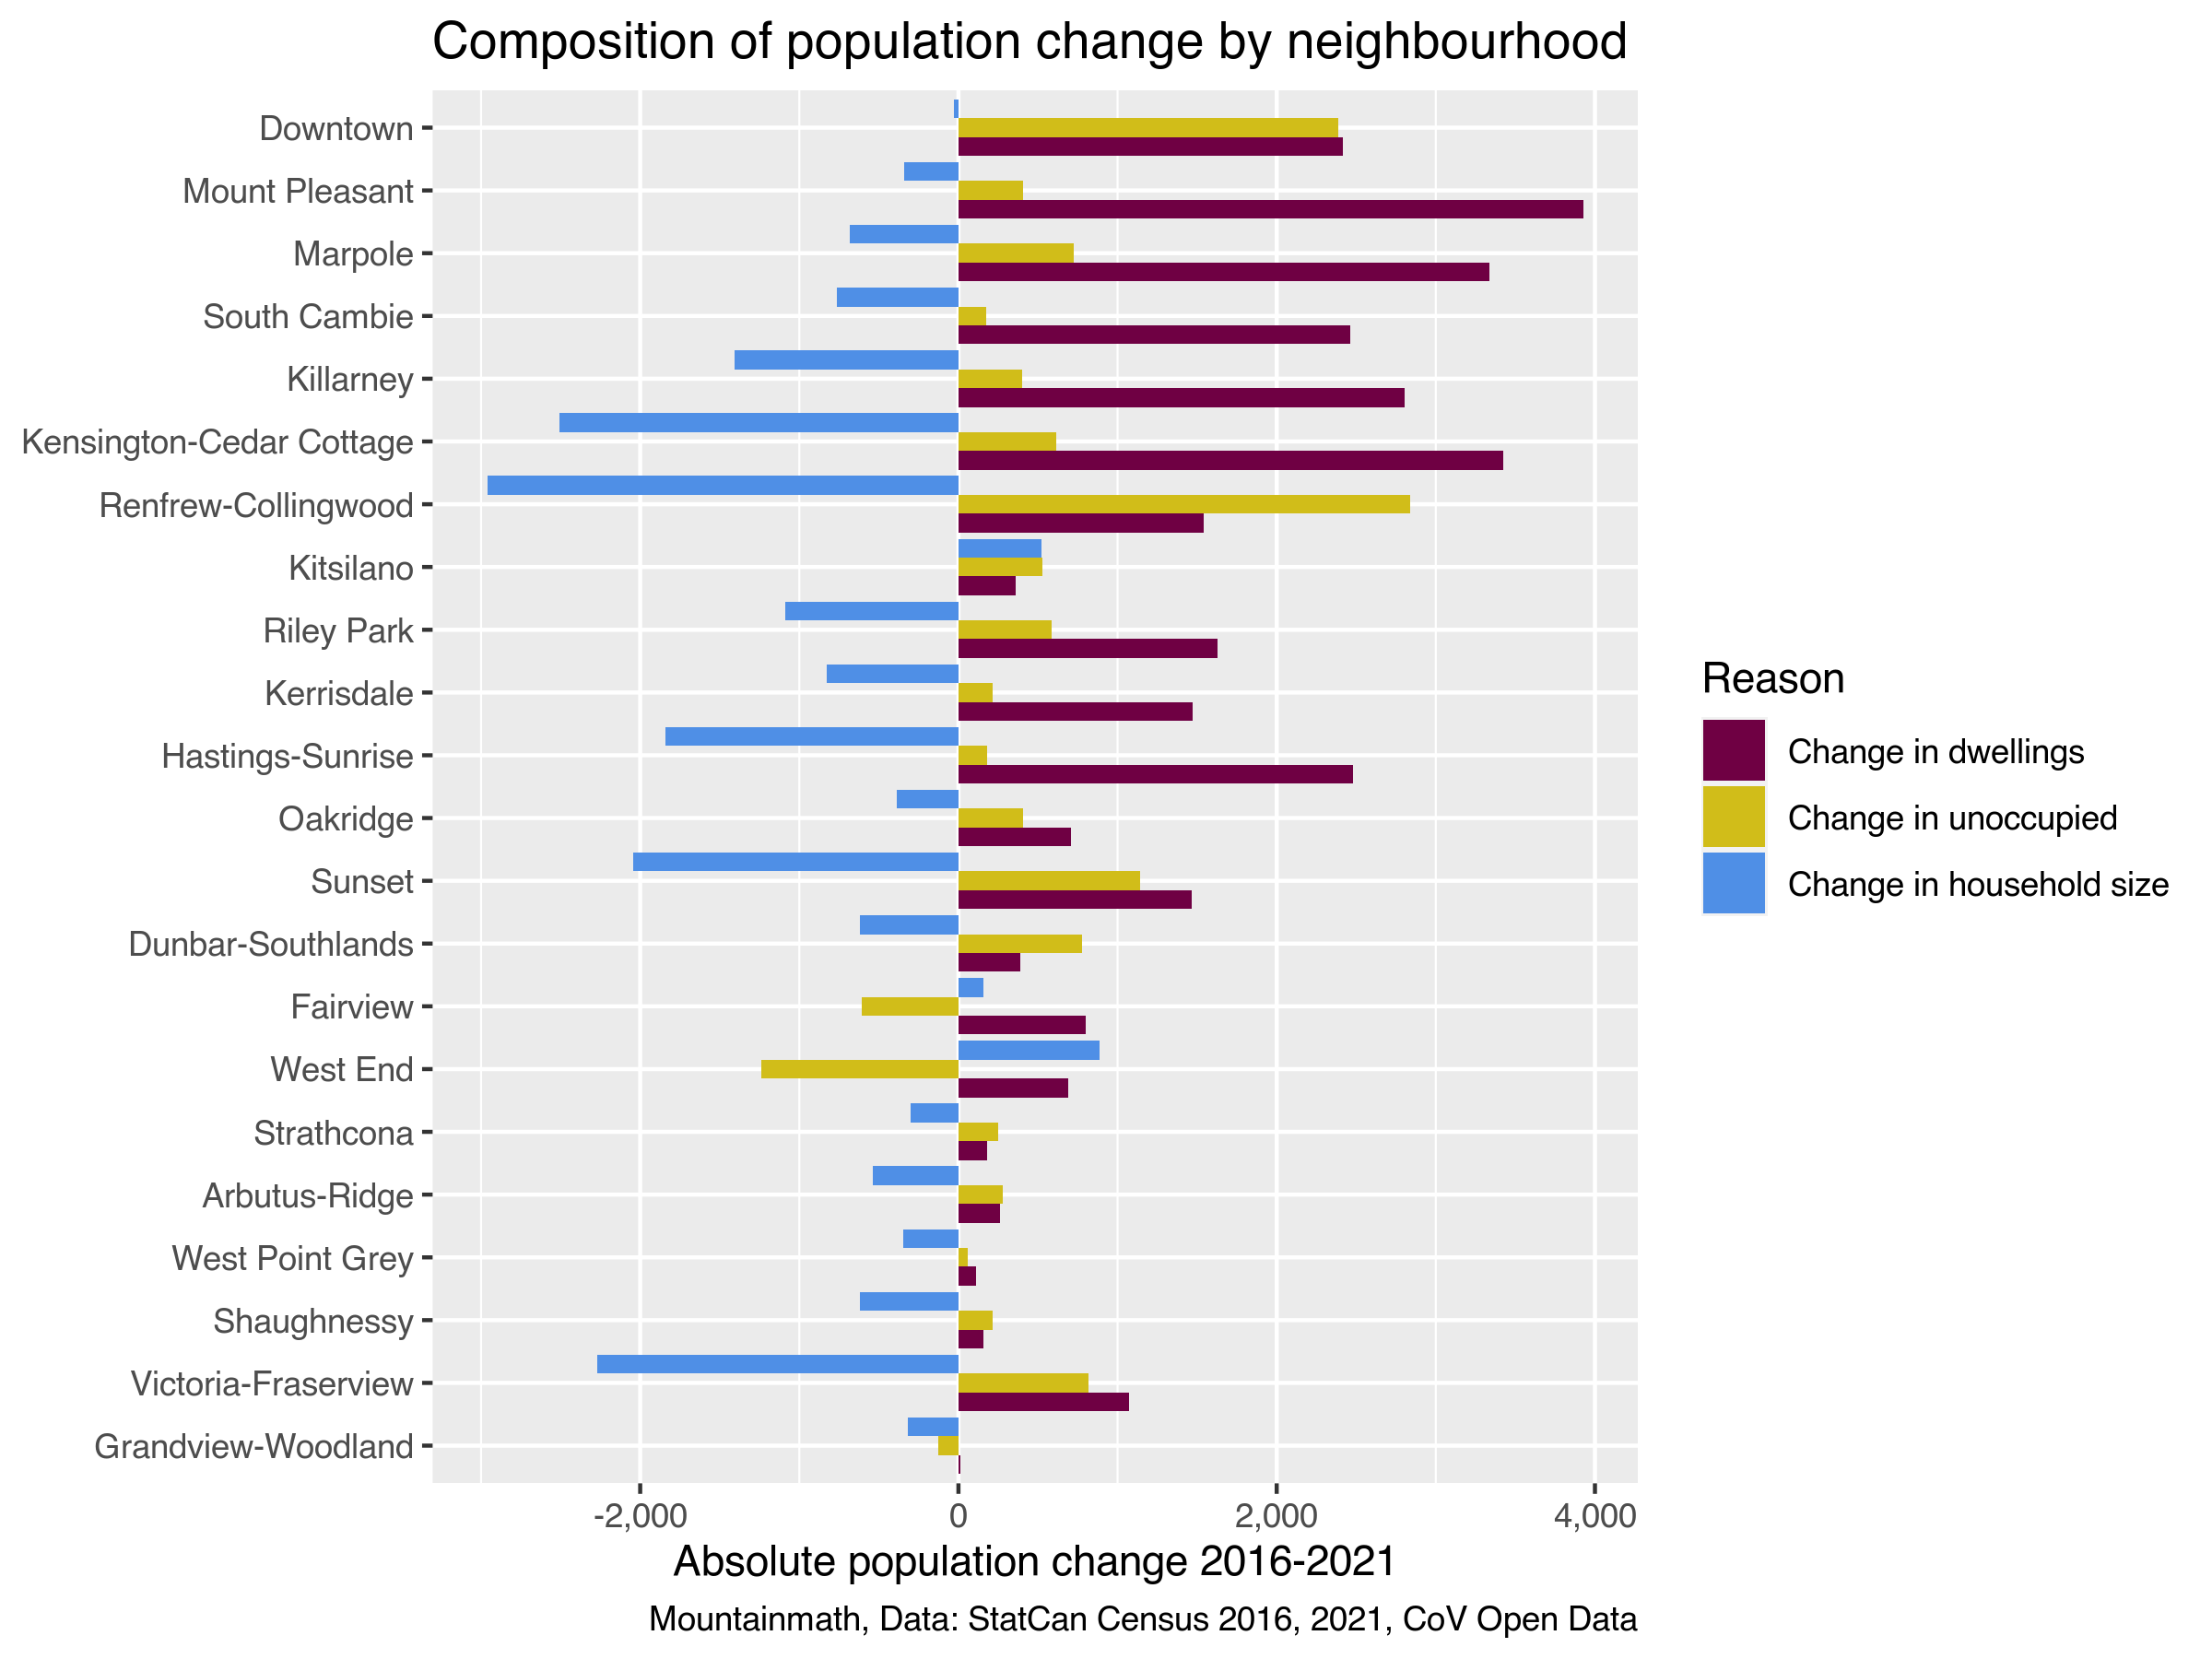
One useful way to slice the data is to break down the population change into three components:
- population change due to a (net) change in dwelling units,
- population change due to a change in household size,
- population change due to a change in dwellings unoccupied by usual residents.
At this point it’s a bit of a hack because we should be using population in private households instead of overall population, but that data is not yet available and the difference for larger areas like city neighbourhoods won’t be large and we will gloss over this detail. This gives a pretty good idea why population has changed.

We see that declining household size has been a major component in the population change in most areas. In particular the population loss in Victoria-Fraserview is entirely due to a drop in average household size in this period, while population increased due to increased dwelling stock and decrease in unoccupied dwellings. Grandview-Woodland really stands out with it’s dismal dwelling growth.
What’s interesting is that the decrease in unoccupied dwellings, and associated increase in population, can be seen across almost all neighbourhoods, with the exception of the West End, Fairview and Grandview-Woodland. While it’s good to remember that this metric is difficult to interpret and outliers in some areas should be expected, it is consistent with the notion that the Empty Homes Tax and Speculation and Vacancy tax had some effect.
We also have an interactive Canada-wide map on CensusMapper showing these components of population change in each region down to the census tract level.
As usual, the code for this post, including the code to scrape the data out of the PDFs, is available on GitHub for anyone to reproduce or adapt.
Reuse
Citation
@misc{deadbeat-neighbourhoods.2022,
  author = {{von Bergmann}, Jens},
  title = {Deadbeat {Neighbourhoods}},
  date = {2022-02-15},
  url = {https://doodles.mountainmath.ca/posts/2022-02-15-deadbeat-neighbourhoods/},
  langid = {en}
}
