(Joint with Nathan Lauster and cross-posted at HomeFreeSociology)
This is the first in a series of posts where we will explore what’s gone wrong with planning for growth, how misguided planning and policy-making has exacerbated our housing shortage, and ways to start fixing things.
The second post in this series tries to estimate suppressed household formation.
Planning vs controlling
Growth mostly happens along the intersection between markets and regulation. We are all for ramping up non-market housing, which is badly needed, but most housing creation and exchange in Canada occurs within market contexts. Yet housing markets are heavily structured by regulation. Municipal zoning and code, provincial land and tenancy, and federal mortgage, interest, and taxation policies all create the framework within which housing markets operate. We’re especially interested in local level planning and its relationship to growth. At the local level, we want to highlight two (idealized) regimes in which the nexus between markets and regulation can operate.
- The planning regime, where zoning creates a broad framework for where and how builders can respond to market pressures. Zoning generally does not restrict how much growth happens, but guides it. A prominent example might be Tokyo.
- The controlling regime, where zoning is tight and essentially all new growth has to be individually greenlit by planners or politicians, tightly controlling which development project will go forward and which won’t. A prominent example might be the City of Vancouver.
While most cities fall somewhere in between these two poles, it is instructional to understand the implications of the two idealized regime types on how cities grow and the role of population projections.
In the planning regime population projections are important in planning for infrastructure and amenities, but not for shorter term (on the order of 5 years) residential development. The planning regime ensures that there is ample capacity to grow so that builders can react to shorter term fluctuations in demand (producing high supply elasticity).
In the controlling regime population projections become essential to guide short term residential development. There is little capacity for builders to react to demand (as expressed in low supply elasticity) without approval from planners and politicians, who in turn might outright deny a development proposal or impose onerous conditions on a project by project basis, impacting economic feasibility. As a result, new residential developments become justified based on “needs” as expressed through seemingly neutral population projections. The control exerted remains asymmetric, planners and politicians can only approve housing, but developers operating within market contexts decide whether it’s economically advantageous to build under a given set of conditions. To put the asymmetry slightly differently, the regime has many strings it can pull to stop development, but pushing on these strings remains ineffectual in producing development.
This asymmetry translates to an asymmetry of the impact of population projections. If population projections are too high and planners and politicians approve more housing than justified by demand, developers will likely elect simply to not build some of the approved housing. If population projections are too low and underestimate demand, planners and politicians will likely approve too little housing and the shortage will drive up prices and rents.
In conjunction this functions like a ratchet where ever-increasing scarcity drives up prices and rents. And this ratchet is further accelerated by naive and faulty population projection models employed by planners. This first post will take a closer look at what goes wrong with the population and housing projections broadly employed by planners.
Population and housing projections
When in the controlling regime, population and housing projections tend to serve as self-fulfilling prophecies. In this section we will explore how planners generally do population and housing projections, and how this process tends to amplify housing scarcity.
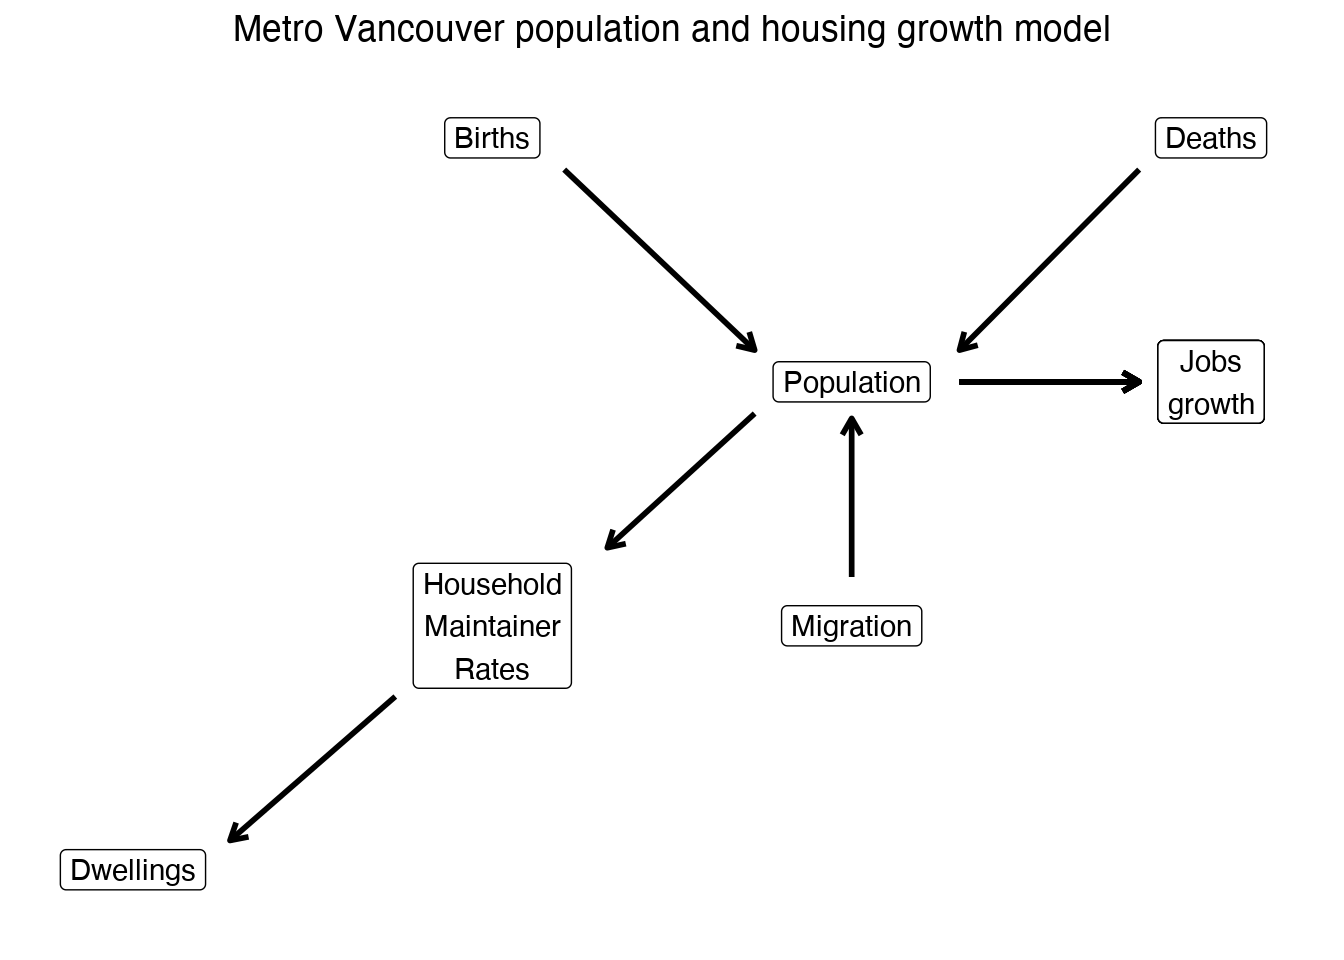
As an example we take the Metro Vancouver Population and Housing projections, which implicitly builds on the following model.

It starts from projections of births, deaths and migration, which are simply derived from past trends applied to current age structures and adjusted for changes to federal immigration targets, which then directly translate to population projections. These then are used to derive jobs projections and, after being processing through an age-specific household maintainer rates model (also informed by past trends), translate into household estimates mislabeled as dwelling estimates in the Metro Vancouver projections.
At first sight this looks scientific and value-free, but the assumptions of the model, in particular the migration and household maintainer assumptions, encode the value that past trends were fine and should and will continue. It’s worth challenging this encoding of values for places like Vancouver, where housing crisis has been tossed around for decades. In particular, we might consider housing outcomes over the past 10 or 20 years, witnessing persistently low vacancy rates and prices ratcheting dramatically upward, as evidence of a problem. Feeding these trends back into projections bakes in our existing problems and amplifies them into the future. In other words, planners are making things worse through the choice of model they are using.
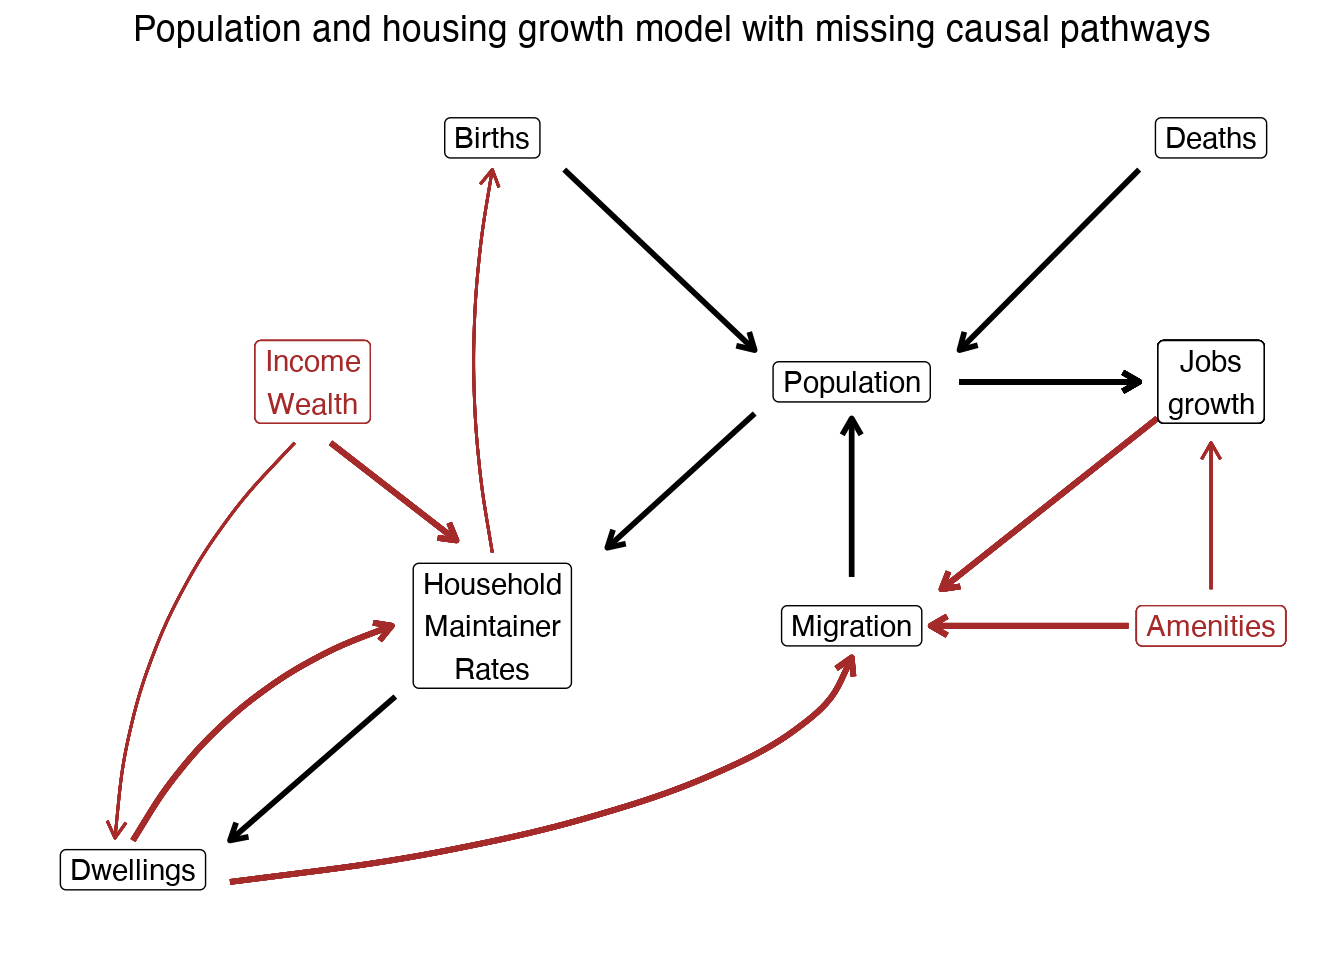
To better understand how exactly this works we need to move away from the framework of projections and flow diagrams that show how we compute the estimates and toward a causal framework that tries to capture how the different components in the model interact. This is quite ambitious, the causal processes at work are complex and hard to measure. Here we will focus on what we see as the most important mechanisms.

We added a bunch of factors and causal pathways. Most importantly, dwelling growth impacts both (net) migration and household maintainer rates. Demographers understand this when they talk about the “two-sided relationship” between population and dwelling growth. Similarly, this is what economists mean when they say population and dwelling growth are endogenous.
Other factors are important too. Jobs don’t just grow in response to population growth (when e.g. the need for hairdressers or retail workers scales with population), jobs can also drive population growth (for example a large tech firm opening a jobs cluster or a multi-national company opening a side office). Similarly, boosts to income and wealth have implications for both household maintainer rates and dwelling allocation. In short, rich people consume more housing. Household maintainer rates are also tied to a variety of family processes. Here we add an important feedback to childbearing (reflecting that most childbearing takes place after adults have left their parents’ households, but also after they’ve partnered). We added in amenities as a largely exogenous factor, with Vancouver’s weather and geographic beauty acting as a net pull on migration. Together with other dynamics, this makes Vancouver an attractive place for companies to locate.
There are other pathways, but these are the ones we think are most realistic and important to consider in this context. Of note, they also make the values assumption explicit. Projecting past migration trends forward means we think past trends that might have pushed people out of the region, or prevented them from moving here because of a lack of available homes, were fine and these processes should be allowed to continue. Similarly, projecting past trends in household maintainer rates forward means that we think any suppressed household formation, e.g. people doubling up or forced to remain in their parents’ basements in response to the unavailability of housing, is a-ok. Carry on!
While we feel our model offers a more realistic guide to how housing relates to population, the causal pathways we’re left with are complex and circular. How can we resolve this and move forward with a model that can help us guide our expectations about the future?
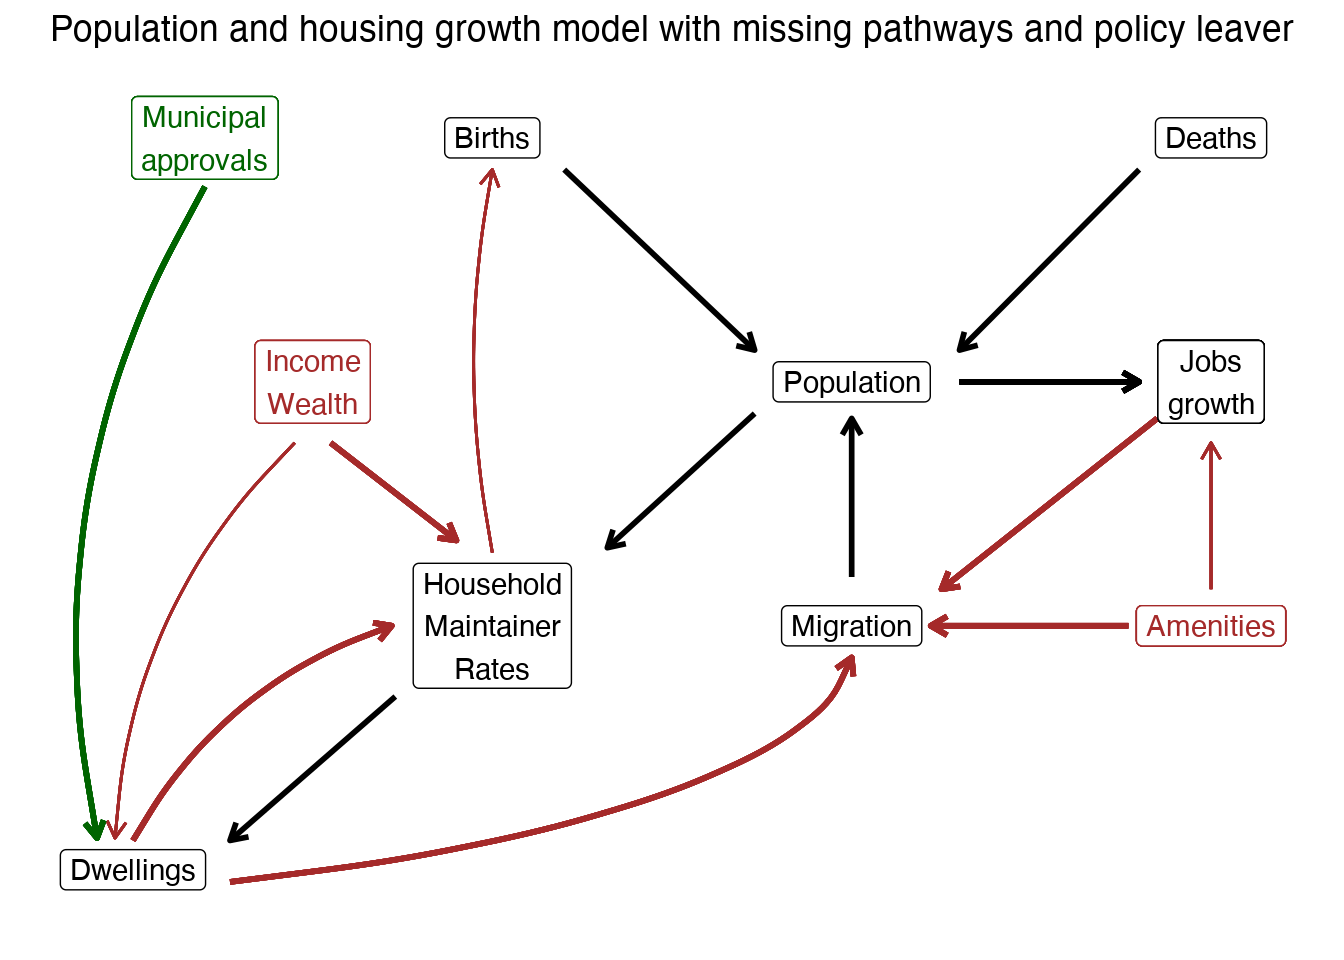
One key observation is that there’s only one prominent policy lever at the local level. Municipalities can’t directly impact migration, or other important aspects of the model. They can tinker with amenities and attempt to draw in new business investment, but these efforts probably aren’t too important. But there’s one set of powers municipalities have been granted in abundance, and that’s control over the addition of new dwellings.

Which brings us to the final version of our graph, where we add in municipal approvals. And with it we gain a replacement for the Metro Vancouver population projections. We need to do scenario-based modelling, starting from a range of scenarios of municipal housing approvals and their economic feasibility. Of note, adding in estimates of feasibility is just what New Zealand has recently attempted in its reforms to move away from its current control regime and back toward a planning regime. In effect, we can vary the amount, type (market, non-market, rental, ownership, etc.), and location of housing approvals, and then work through the model to estimate the impacts on population, migration, prices and rents, household maintainer rates, jobs and the other factors to paint a picture of the resulting scenarios of a future Vancouver. These estimates will come with uncertainties, but they will roughly show how the demographics change, who will get pushed out and who gets to stay in Vancouver under the given scenarios.
The question which scenario should be adopted is a political question, ultimately reflecting our values. As such, demographic and economic modelling should be telling us what the likely outcomes of various housing approvals might look like rather than feeding us a stale number reflecting a dispassionate assessment of need. Which is the future Vancouver we want? How inclusive will it be? How do household maintainer rates and migration patterns differ between a scenario that emphasizes the preservation of low-density neighbourhoods with some towers going up in various pockets vs a scenario that opens up our low density areas to mutliplexes and lowrise rental apartments? Who gets pushed out? Who gets to stay? And which of these scenarios aligns best with values for what the Vancouver of the future should look like?
This is the first in a series of posts, the next one will work through the household maintainer model and try to understand how Vancouver’s past choices have impacted Vancouver’s current household maintainer rates.
Reuse
Citation
@misc{planning-for-scarcity.2022,
  author = {{von Bergmann}, Jens and Lauster, Nathan},
  title = {Planning for Scarcity},
  date = {2022-04-26},
  url = {https://doodles.mountainmath.ca/posts/2022-04-26-planning-for-scarcity/},
  langid = {en}
}
