This excellent NYTimes article on mobility in the US coming out today nudged me into doing a quick post on residential mobility in Canada. While there are lots of similarities between Canada and the US, there are some important differences when it comes to residential mobility. A while back Nathan Lauster compared residential mobility between the two countries and noticed that the declining trend in US residential mobility is much more muted in Canada, and may have reversed by the 2016 census, the last year for which we currently have data in Canada. (The 2021 data is slated to come out on October 26, 2022.) Nathan’s post also takes a closer look at what has changed in the US and why residential mobility declined by examining the reasons people give for moving. And Yes, it’s housing related reasons that are driving the decline in moving.
The NYTimes article places this into a longer timeline, showing that this trend started well before the 2000-2001 year which Nathan used as a starting point. While we are waiting for the 2021 data we want to take this as an opportunity to push the Canadian data back a bit further to see how Canada’s residential mobility has evolved. And also look into how this varies across the country and depending on tenure and age.
One-year mobility
The NYTimes article looks at 1-year mobility, which is a useful metric because few people move more than once within a year and thus gives a good measure of residential mobility. Unfortunately, this is not available prior to the 1991 census.

Overall this paints a picture of declining residential mobility across Canada, with hints of a recovery during the year before 2016. But the level of residential mobility, as well as the shape and makeup of the decline, varies across the different CMAs broken out here. For the initial 1990-1991 movers data we don’t have a breakdown for people moving within the same municipality (“Non-migrants”) and people moving from elsewhere within the province (“Intraprovinical migrants”). Additionally, we need to be aware that some metro area have expanded over this time period, as have municipal boundaries – most notably the City of Toronto between 1996 and 2001. That complicates interpreting these timelines.
As Nathan already observed on his blog, most moves are local, and the reduction of mobility is mostly driven by local moves. To better zoom into this we can plot the data as a line graph, which does reveal some divergence from this pattern for some regions.

In this post we want to dive a little bit deeper into residential mobility, looking at longer timelines, and understand how this relates to age and tenure.
Five-year mobility
If we want to go further back in time we have to content ourselves with looking at 5-year mobility data, so the share of the population who lived at a different address 5 years prior. This is available in electronic form back to 1971.

Here we have some finer categories, splitting up intraprovincial migrants into those staying in the same census district and those coming from a different census district in the same province.
But how does this look like across different parts of the country? We only have information for Montréal and Toronto all the way back to 1971, more metro areas get added to the PUMF in successive censuses.

In addition to the caveats we already mentioned above, that some metro areas as well as some municipal boundaries have changed over time, the relationship of metro areas and the cities within to census district also varies, with for Vancouver the census district and metro area coinciding, but for Toronto the City boundaries coinciding with their census district starting with 2001. That can lead to some artificial changes among the categories.
Each of these regions shows an overall declining trend in residential mobility. We will look at how this interacts with tenure and age to better understand what is driving this.
Tenure
We know that renters move more frequently than owners. This happens for many reasons, which are worth getting into in more detail, but we will leave this for another post.

Comparing the mobility rates we indeed see large differences by tenure that dominate the differences across metro areas. Renters move much more frequently, but the decline in mobility is visible in both categories.
Age

Again we see a fairly consistent decline in mobility across age groups. Especially the 20-24 year old age group stands out, and the older age groups also show a clear drop in residential mobility.
Dropping the mobility status take a look how this differs across metro areas.

The trends are fairly consisted, although e.g. Montréal is showing lower drops than other metro areas, hinting that some of this effect may be due to suppressed household formation that we have observed in a previous post.
Putting it all together
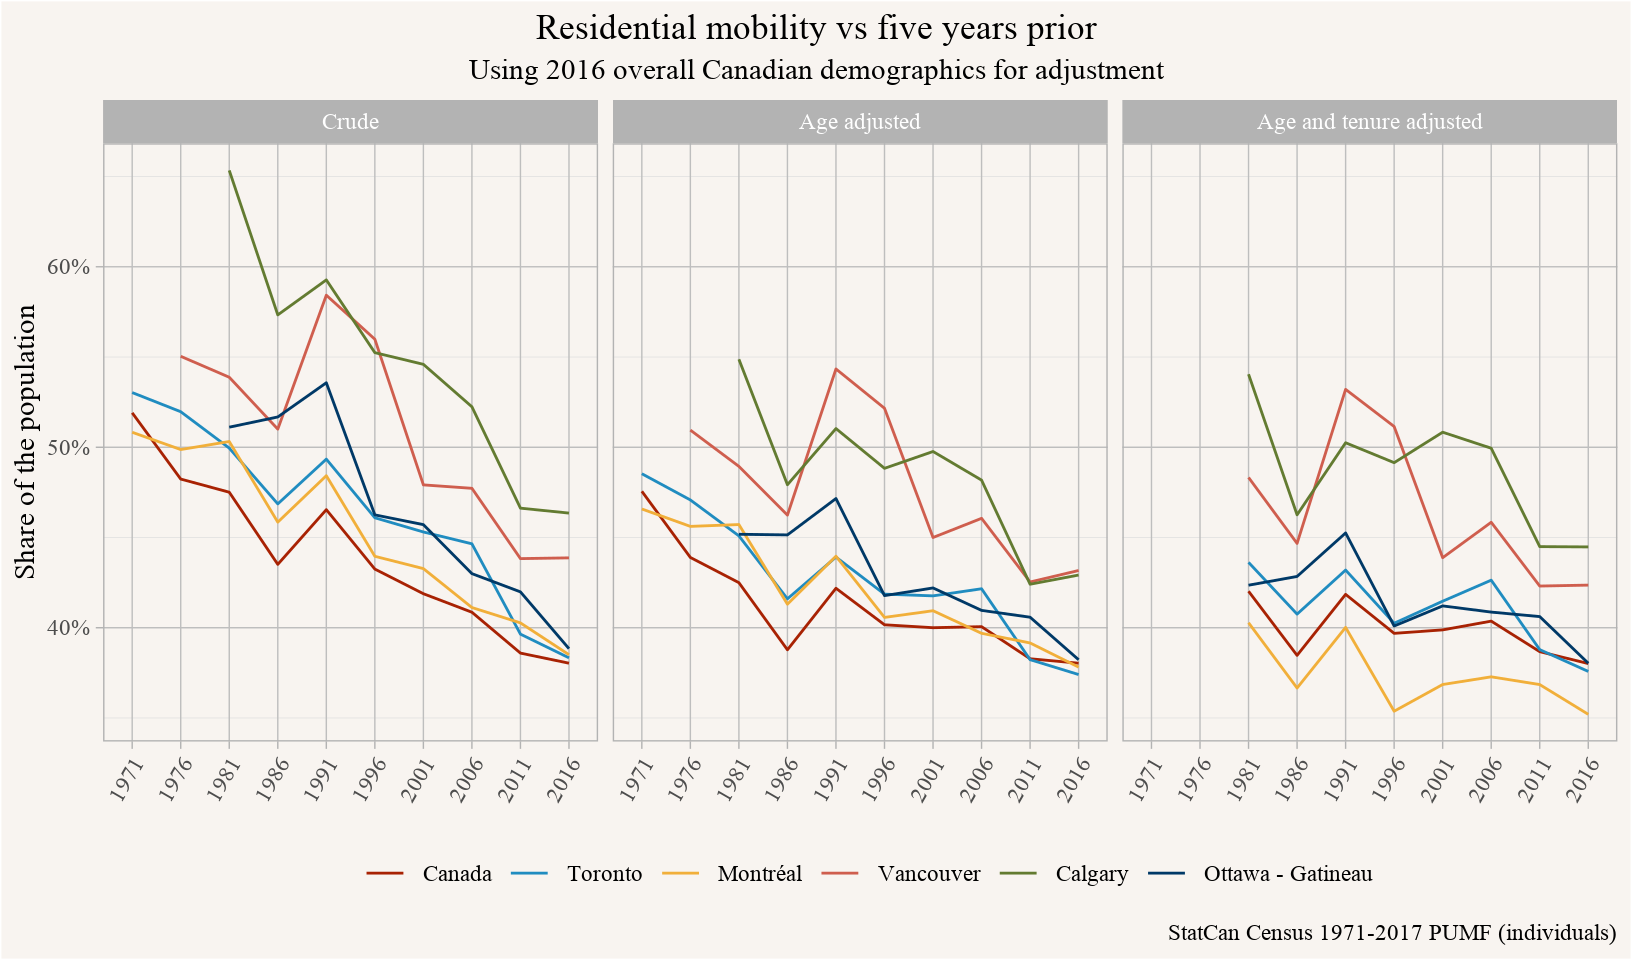
Looking at the difference across age and tenure we can ask ourselves how much of the overall drop in residential mobility are explained by these two. This lets us remove the effect of change in tenure and age distribution across time and across geographies, using the 2016 overall Canadian distribution as a counterfactual demographic distribution.

This shows that some, but not all of the effect of the declining mobility is explained by shifts in demographics and housing tenure. But some differences remain, in particular it’s remarkable how low Montréal’s residential mobility is, especially when accounting for tenure. Which also hints that tenure itself is probably less of a driving factor of mobility, but that there are other factors apart from age that are a common cause of tenure and mobility. And the model adjusting for age and tenure should probably be treated with caution.
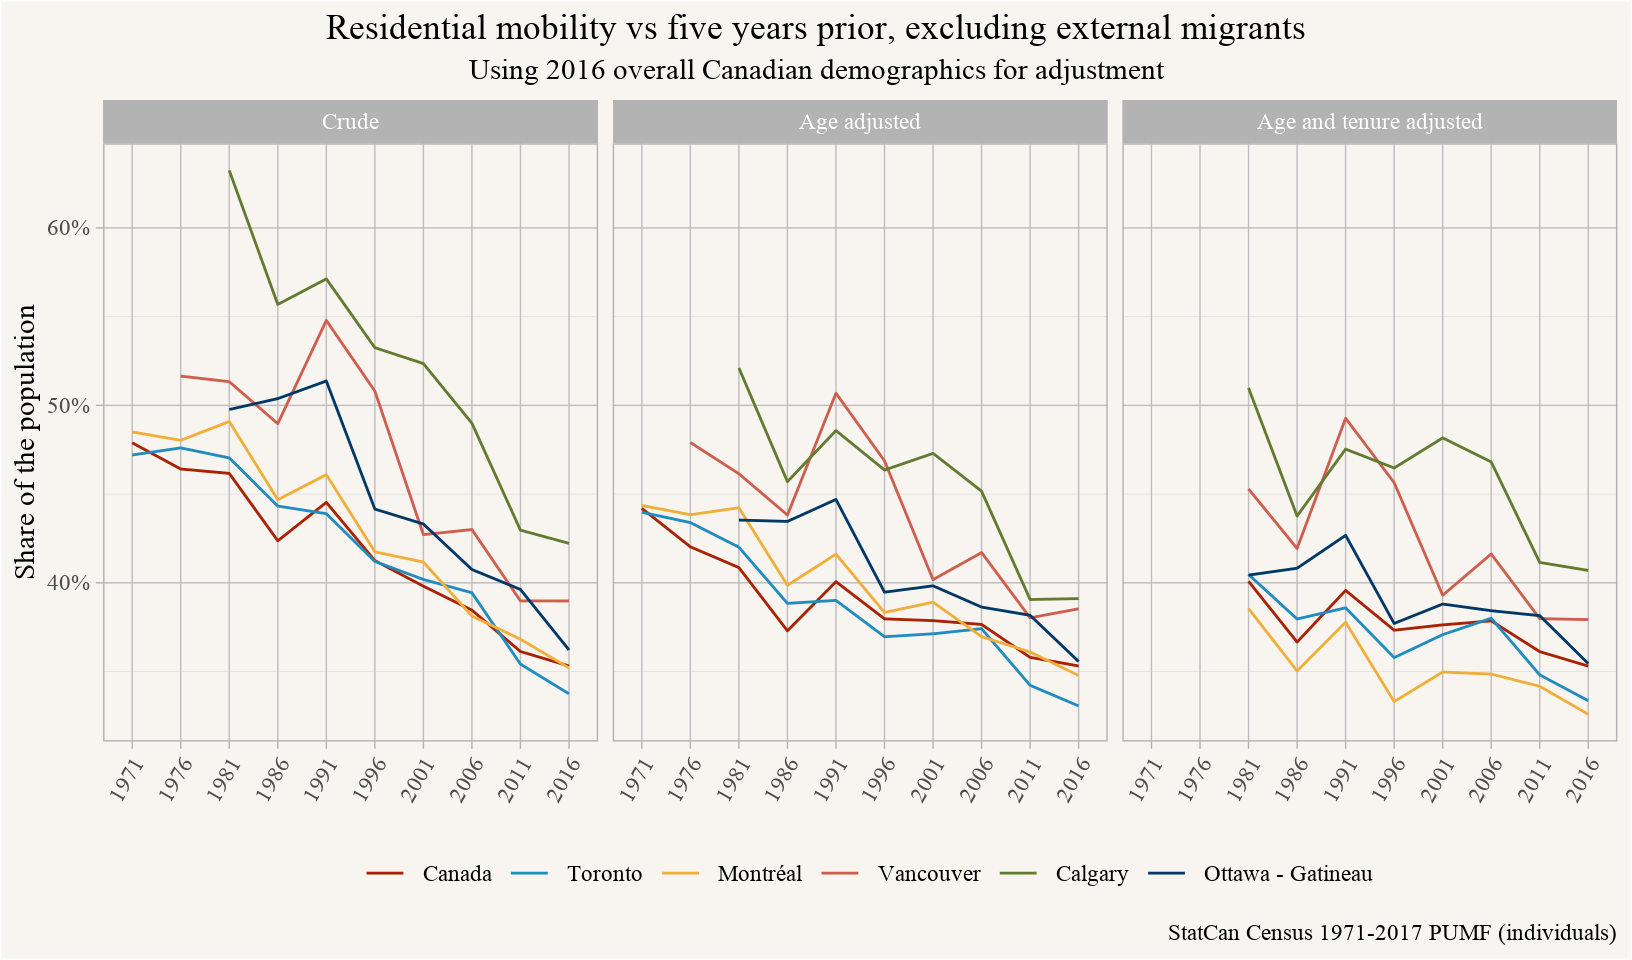
One last remaining question is that of the role of external migration. That does not quite fit into the concept of mobility for the purposes of this post since external migrants don’t corresponds to moves of people in Canada but rather moves into Canada. We can remove external migrants and see how that changes things.

This does somewhat depress the mobility rates of regions that see a lot of external migration, but the general pattern is quite similar.
Upshot
Moving is an important factor in our economy and our housing system. In our housing discussions, for example during the ongoing public hearing of the Broadway Plan, many people have a very naive understanding of how residential mobility works. There is often an implicit assumption that new buildings have to be matched with newcomers. We know this is by and large not how things work, the majority of people who move into new housing already lived in the region. Similarly, the vast majority of people who move move into old housing. One very obvious way to see this is that almost half of the population in the City of Vancouver lived at a different address five years prior. Which highlights the absurdity of people questioning who new housing is for. New housing only makes up a tiny portion of destinations for movers, it’s perfectly ok if it only suites a small portion of those people moving. That’s not to say we should not strive to create non-market housing whenever possible, we absolutely should. (Raise my property taxes to pay for it!) But denying new housing because e.g. median incomes can’t afford it misunderstands how housing and mobility work and is counter-productive.
Trends in mobility are interesting because they have implication for the broader economy. If people can’t easily move, they may not be able to change jobs to one that better fits the skills and pays more, and on the flip side employers will have a harder time recruiting talent to increase their productivity. People may get stuck in housing situations for longer than they want, resulting in suppressed household formation. Adjusting for changes in demographics can help better understand these trends, and alleviate underlying causes of reduced mobility.
Another important direction is to understand the reasons for moving. In Canada we are only now getting decent data on why people move, with the CHS giving us a way to understand reasons for moving, in particular forced vs choice moves. This view allows us to shine a light onto the two sides of residential mobility, which can be bad if people are looking for stability and can’t find it because they are forced to move, or it can be good if it enables choice moves closer to work, family and friends, or amenities, or to adapt to changing family needs. We are looking forward to the next round of the CHS data getting released.
A good discussion on declining residential mobility in the US and its implications and drivers can be found in a nice recent sudy by Dowell Myers at al, broken down in easily digestible form in a twitter thread.
As usual, the code for this post is available on GitHub for anyone to reproduce or adapt.
Reproducibility receipt
## [1] "2022-05-30 09:56:23 PDT"## Local: master /Users/jens/Documents/R/mountaindoodles
## Remote: master @ origin (https://github.com/mountainMath/doodles.git)
## Head: [8b0def3] 2022-05-29: add sentence on non-market housing## R version 4.2.0 (2022-04-22)
## Platform: aarch64-apple-darwin20 (64-bit)
## Running under: macOS Monterey 12.3.1
##
## Matrix products: default
## BLAS: /Library/Frameworks/R.framework/Versions/4.2-arm64/Resources/lib/libRblas.0.dylib
## LAPACK: /Library/Frameworks/R.framework/Versions/4.2-arm64/Resources/lib/libRlapack.dylib
##
## locale:
## [1] en_CA.UTF-8/en_CA.UTF-8/en_CA.UTF-8/C/en_CA.UTF-8/en_CA.UTF-8
##
## attached base packages:
## [1] stats graphics grDevices utils datasets methods base
##
## other attached packages:
## [1] mountainmathHelpers_0.1.4 cancensus_0.5.1
## [3] forcats_0.5.1 stringr_1.4.0
## [5] dplyr_1.0.8 purrr_0.3.4
## [7] readr_2.1.2 tidyr_1.2.0
## [9] tibble_3.1.7 ggplot2_3.3.6
## [11] tidyverse_1.3.1
##
## loaded via a namespace (and not attached):
## [1] tidyselect_1.1.2 xfun_0.30 bslib_0.3.1 haven_2.5.0
## [5] colorspace_2.0-3 vctrs_0.4.1 generics_0.1.2 htmltools_0.5.2
## [9] yaml_2.3.5 utf8_1.2.2 rlang_1.0.2 pillar_1.7.0
## [13] jquerylib_0.1.4 withr_2.5.0 glue_1.6.2 DBI_1.1.2
## [17] dbplyr_2.1.1 readxl_1.4.0 modelr_0.1.8 lifecycle_1.0.1
## [21] cellranger_1.1.0 munsell_0.5.0 blogdown_1.9 gtable_0.3.0
## [25] rvest_1.0.2 evaluate_0.15 knitr_1.38 tzdb_0.3.0
## [29] fastmap_1.1.0 fansi_1.0.3 broom_0.8.0 scales_1.2.0
## [33] backports_1.4.1 jsonlite_1.8.0 fs_1.5.2 hms_1.1.1
## [37] digest_0.6.29 stringi_1.7.6 bookdown_0.26 grid_4.2.0
## [41] cli_3.3.0 tools_4.2.0 magrittr_2.0.3 sass_0.4.1
## [45] crayon_1.5.1 pkgconfig_2.0.3 ellipsis_0.3.2 xml2_1.3.3
## [49] reprex_2.0.1 lubridate_1.8.0 assertthat_0.2.1 rmarkdown_2.13
## [53] httr_1.4.2 rstudioapi_0.13 R6_2.5.1 git2r_0.30.1
## [57] compiler_4.2.0Reuse
Citation
@misc{residential-mobility-in-canada.2022,
  author = {{von Bergmann}, Jens},
  title = {Residential Mobility in {Canada}},
  date = {2022-05-27},
  url = {https://doodles.mountainmath.ca/posts/2022-05-27-residential-mobility-in-canada/},
  langid = {en}
}
