This is a data-focused post, it’s targeted at people consuming or otherwise working with CMHC data. And also at the future me that will stumble again over problems outlined in this post and will have to remember the ins and outs of CMHC data.
The data
CMHC creates and maintains lots of important data on housing. We start with an overview over the more important data sources, and the relevant definitions.
The Starts and Completions Survey (Scss) tracks housing starts, completions, and related data. Data is available on a monthly frequency down to census tract geography and can be split by intended market. Part of this is the Market Absorption Survey that tries to track how many units remain unsold after completion, and at what prices completed units sell.
The definitions of the structural types differ from StatCan definitions in important ways, for example a single family home with a secondary suite will be categorized as two “duplex” units by StatCan, but as one “single” unit plus one “rental apartment” unit in the Scss.
The Rental market survey (Rms) aims to track privately initiated market rental apartments with at least 3 units by bedroom type, age of structure and number of units in structure. It also collects information about rents and vacancy rate. The data is available on an annual frequency (twice annually before 2016) down to census tract level geography.
Rms data often gets misrepresented as covering “rental apartments”, but it excludes a broad range of rental housing like non-profit or other non-market or public housing, seniors housing, student housing and secondary rentals.
The Secondary Market Rental Survey (Srms) aims to capture information on the secondary rental market, in particular condominium units but also other secondary rentals. Data quality is substantially lower than the primary rental market survey (Rms), but it adds important context and serves as a cross-check to make sure the conditions found via the Rms broadly carry over to the overall rental market. Data is available at an annual frequency down to the CMA level.
The Seniors’ Housing Survey targets senior’s residences.
The cmhc R package

All of this is important data that is relevant to many housing related questions, and we have been using this data extensively. CMHC does not have a data API, but our cmhc R package develops a pseudo API to facilitate easy programmatic access to the data and enables reproducible and adaptable analysis. Version 0.2.0 contains many breaking changes to the previous version that we have used in past work and blog posts, we have archived version 0.1.0 to maintain reproducibility, installing this package, now called “cmhc2” and loading this instead of the cmhc package will enable older work to continue to run through unchanged. These breaking changes hopefully won’t cause too many issues, but the old version was not very user friendly, and there were (likely) only a handful of people using it anyway. But starting with version 0.2.0 it should be a lot more broadly accessible.
There are also various other less organized data sources strewn over a selection of excel sheets and PDFs, including demolitions with older demoltions in PDFs, rents of vacant apartments and others.
The gaps
There are important data gaps and categorization issues that need to get fixed. As housing becomes more complex, our traditional ways of accounting for, measuring, and tabulating housing need to evolve. Things have changed a bit within CMHC data reporting, but not enough to keep the data robust and maximize it’s usefulness.
Non-market housing
There is no good data on non-market housing. The Scss does not distinguish market or non-market rentals, although it does break out co-op housing. The Rms does not cover non-market housing at all, some non-market housing is captured in the Seniors survey but it isn’t broken out.
There is the fairly new Social and Affordable Housing Survey that now has data for 2019 and 2021, although it only gets released as Excel sheets, only has provincial and CMA breakdowns, and is generally of low quality.
Non-market housing is inherently complex and difficult to enumerate. There is a broad spectrum of types of non-market units, how far below market are rents set, what the eligibility criteria for renting are, and how wait lists are administered to name a few important questions.
But the lack of comprehensive decent-quality data on non-market housing makes it really hard to understand how regions are doing in meeting housing needs. There are some initiatives underway to catalogue non-market housing, but it is not clear to me that this will turn into a regularly updated and reliable data source.
Student housing
Student housing is not enumerated as part of the Rental Market Survey. In theory it should be part of the Scss if it has self-contained units, but in practice coverage is spotty. Here in BC we have seen a resurgence of student housing getting built, which helps take pressure of the overall rental market. But we don’t have good and accessible data sources on this.
Classification problems
Starting sometimes in 2013 CMHC realized that secondary suites are part of the housing spectrum, and CMHC Scss data started to count secondary suites. But how is a start of a house with suite classified in Scss data? It’s a start of a “Single” homeowner unit and a start of an “Apartment” rental unit. Similarly, laneway homes are classified as “Single” single-detached rental unit. We can pinpoint the change in how to account for suites by looking at the data. The idea is to look for apartment completions with just 1 unit in them. We don’t have individual structure data, that’s internal to CMHC. But if we don’t count suites we expect that there only very rarely be a census tract with just one rental apartment unit completions, rental apartments will have more units and only the occasional small stacked townhouse would slip through, maybe having staggered completion times. But if we do count suites, then there should be census tracts with just one suite completing in a given months.
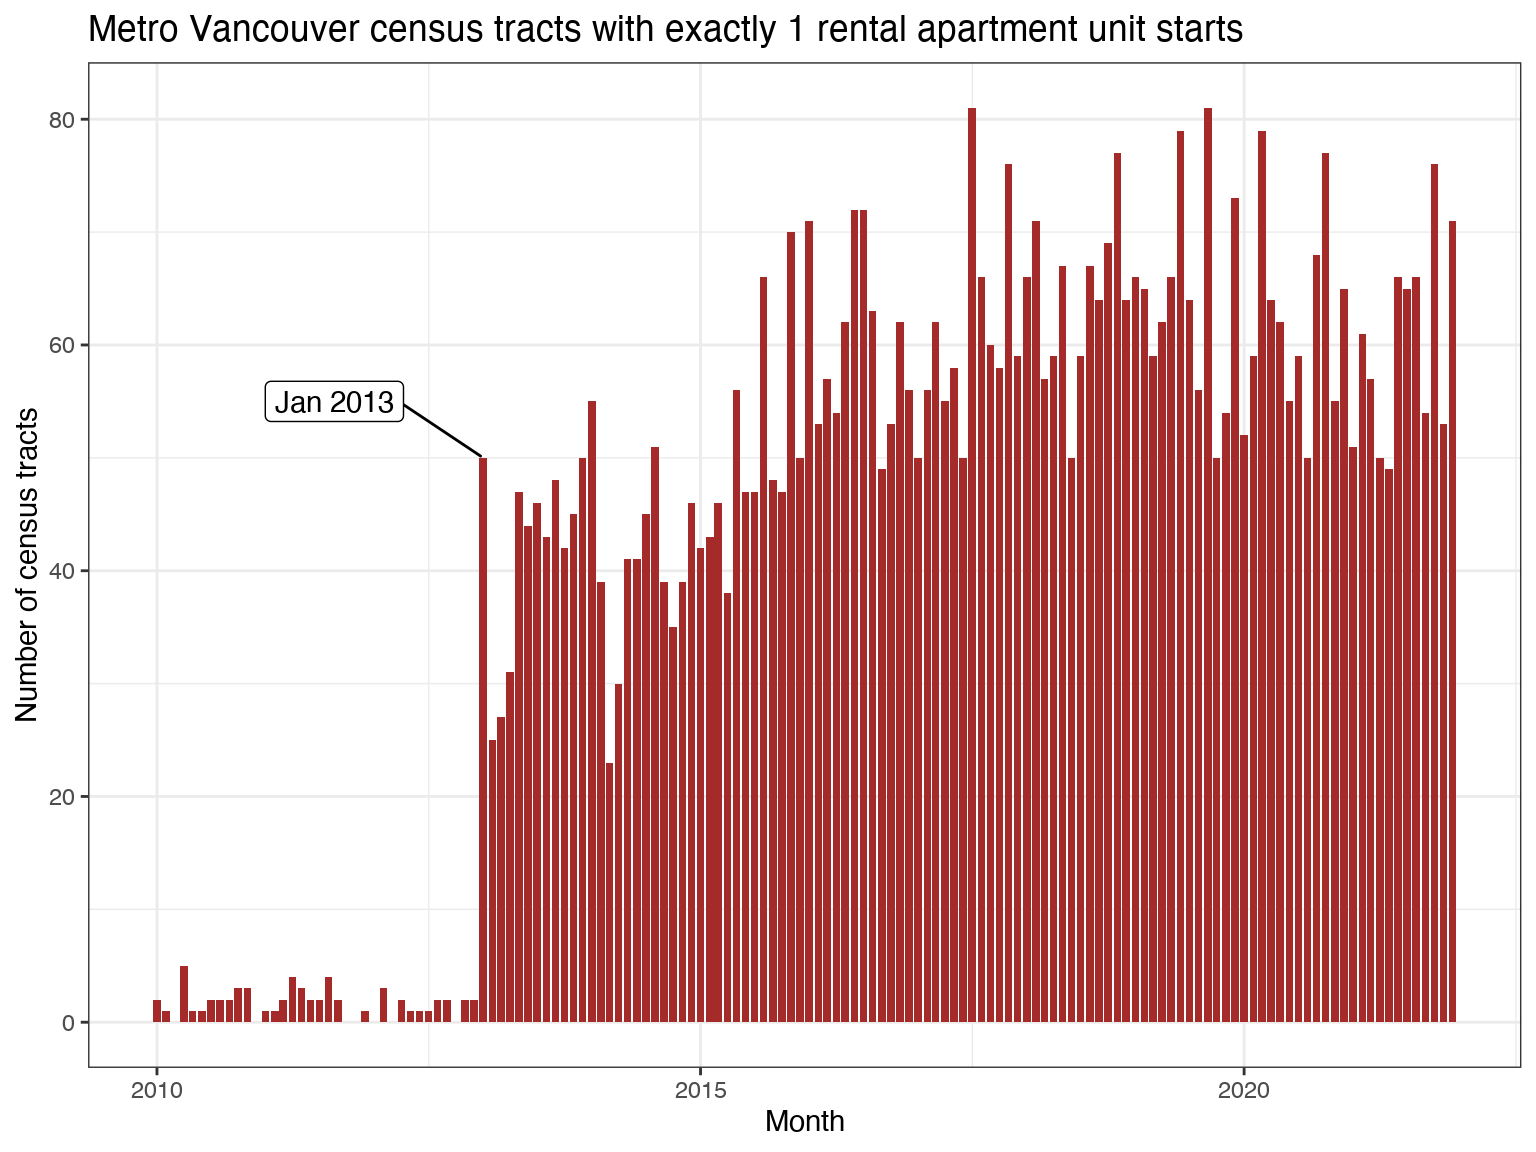
And indeed, the number of census tracts that see just one rental apartment units completing jumped in January 2013, this should be the date when CMHC data started counting suites in the Scss. Some census tracts may well have more than one suite completing in a given month, but here we are just focused on determining the timing of when the Scss methods changed. But this does pose an obstacle if we wanted to estimate how many rental completions are suites. CMHC has the ability to break out secondary suites in the Scss data, and they have done so in their recent Housing Supply Report. It would be nice if they could also break it out in their HMIP data.
Also, non-market rental housing, as well as senior housing, are classified as rental apartments in the Scss, but they aren’t part of the Rms universe, just like suites and laneways aren’t.
Laneways can be accounted for fairly easily as “Single” starts or completions with intended market “rental”. But the not being able to break out suites, non-market, and senior housing creates mismatches with the Rms data.
We take a look how this works out during the past three years in Metro Vancouver municipalities. For this we are interested in the number of new rental units, so rather than looking at net change in the total number of units in the Rms rental universe we only look at the change 2018-2021 in the units built 2000 or later, assuming that none of these will have gotten torn down. We compare that to Apartment and Row completions with intended market “rental” from the Scss that completed July 2018 through June 2021, the time frame matching the target of the Rms. This removes laneway homes from the completions, but leaves secondary suites, non-market housing and senior housing.
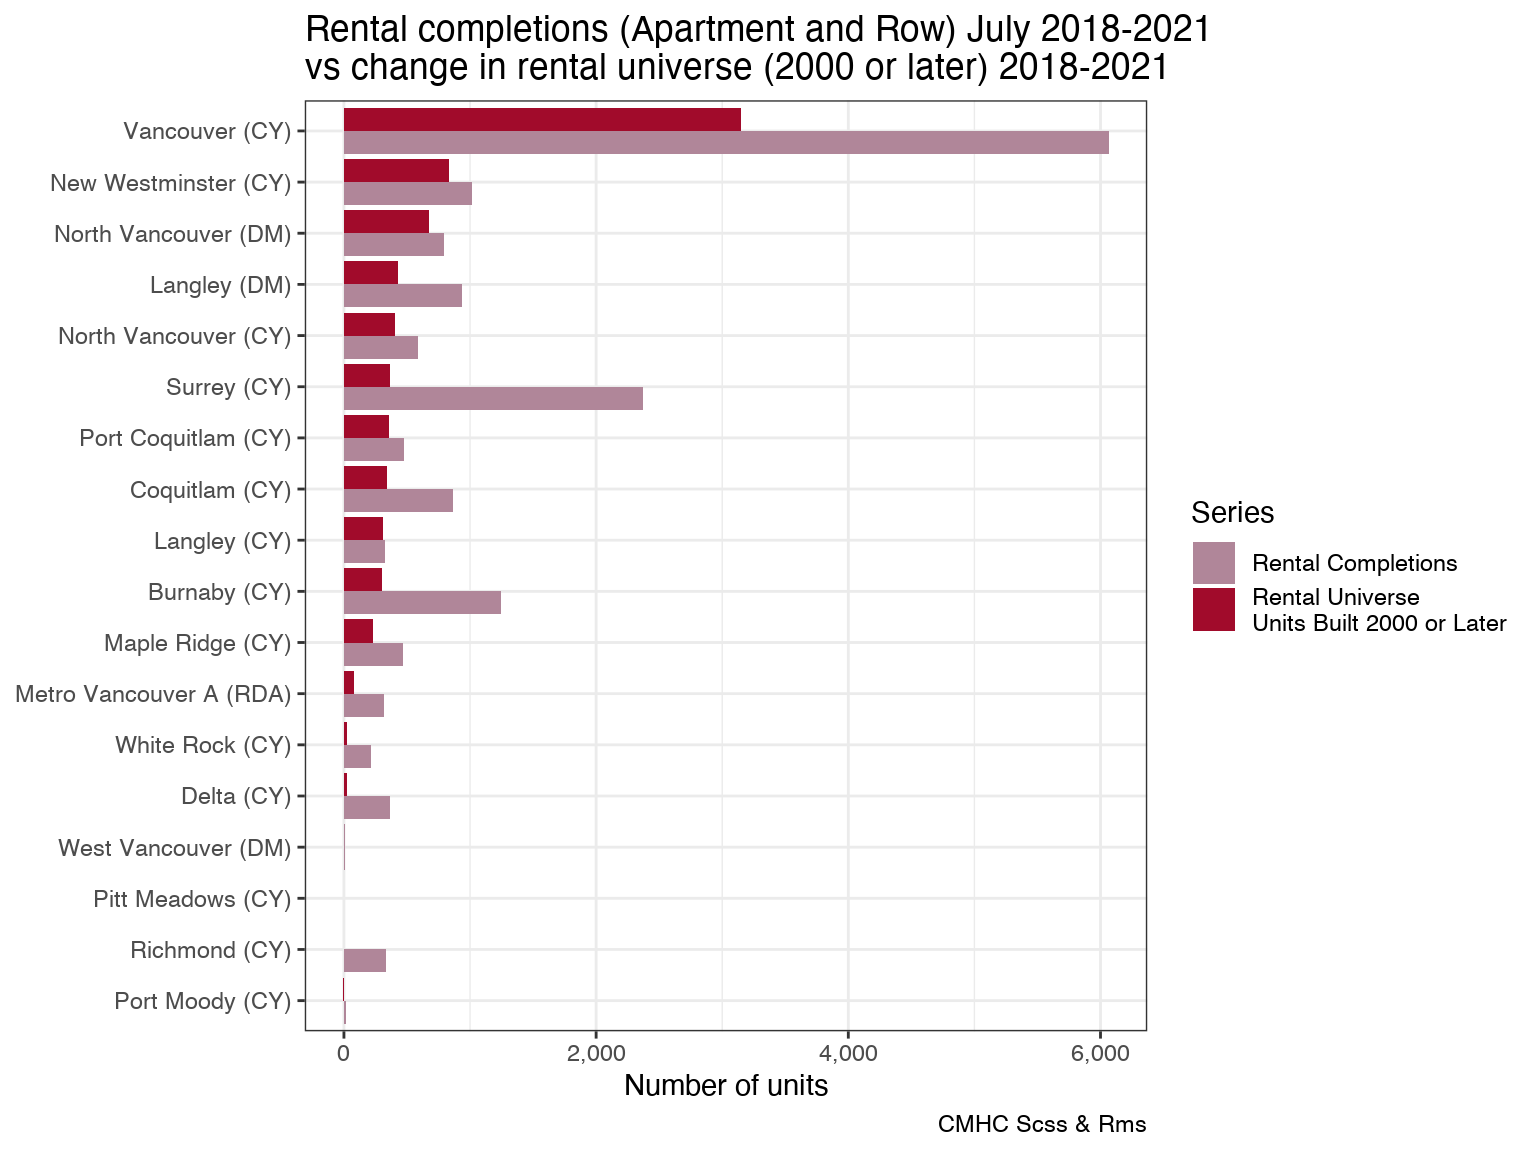
We can see that the difference between the two is rather large. Vancouver’s Rms universe has about 3k new units, but the Scss records about 6k rental Row and Apartment completions. That’s a factor 2 difference, and it’s not out of the ordinary looking at other municipalities, in some the mismatch is larger, in some it is smaller.
The difficult question is what does it tell us? Is the difference mostly secondary suites, or non-market or senior housing? Or is this due to misclassification in mixed-tenure buildings, which CMHC has a hard time properly capturing in their database. Mixed-tenure buildings, where part of a building is operated as strata, and another part as a purpose-built rental, or part is market rental, part is non-market rental, have become increasingly prevalent over the recent years.
The answer to this question matters for policy makers. Secondary suites are a great way to better utilize existing housing, but secondary suites are a double-edges sword, they don’t offer the same legal protections to renters as purpose-built rental and are inherently insecure. Of all types of housing, suites are the most frequently classified as “unoccupied” in the census, and there is no regulation that could compel owners to rent them out like we have for e.g. condos in form of the Empty Homes Tax or Speculation and Vacancy Tax. Colloquially they are often referred to as “mortgage helpers”, which captures the power dynamic and who these units mainly serve. For forward looking housing policy, secondary suites are probably not the best form of housing to incentivize.
On the other hand, non-market or senior housing is very much something that policy does want to incentivize. We have a desperate need for more housing of this type. If the purpose-built stock shrinks because a non-profit provider bought out a rental building and converted it to non-market housing, then the decrease of the purpose-built (market) rental stock will have a very different effect on overall housing outcomes than when a building just gets torn down. Right now it is difficult to distinguish those two scenarios from the data we have.
At the metro level we can use the Seniors survey to pull out net new senior housing spaces, between 2018 and 2021 Metro Vancouver gained 1,084 of these. But the gap between the rental universe and rental Apartment and Row completions was 60,686 units, leaving (roughly, this does not account for senior housing demolitions) 59,602, or 87% of rental completions unaccounted for in Metro Vancouver over those three years.
Or in other words, about half of Metro Vancouver’s rental completions were secondary suites or non-market housing. Probably. Or misclassifications. This kind of accounting by differencing can be error-prone. But it highlights the problem we have with understanding what kind of housing gets built.
Take the following graph, versions of which have been making the rounds. It’s the change in purpose-built market rental units in Metro Vancouver municipalities over the past 5 years.
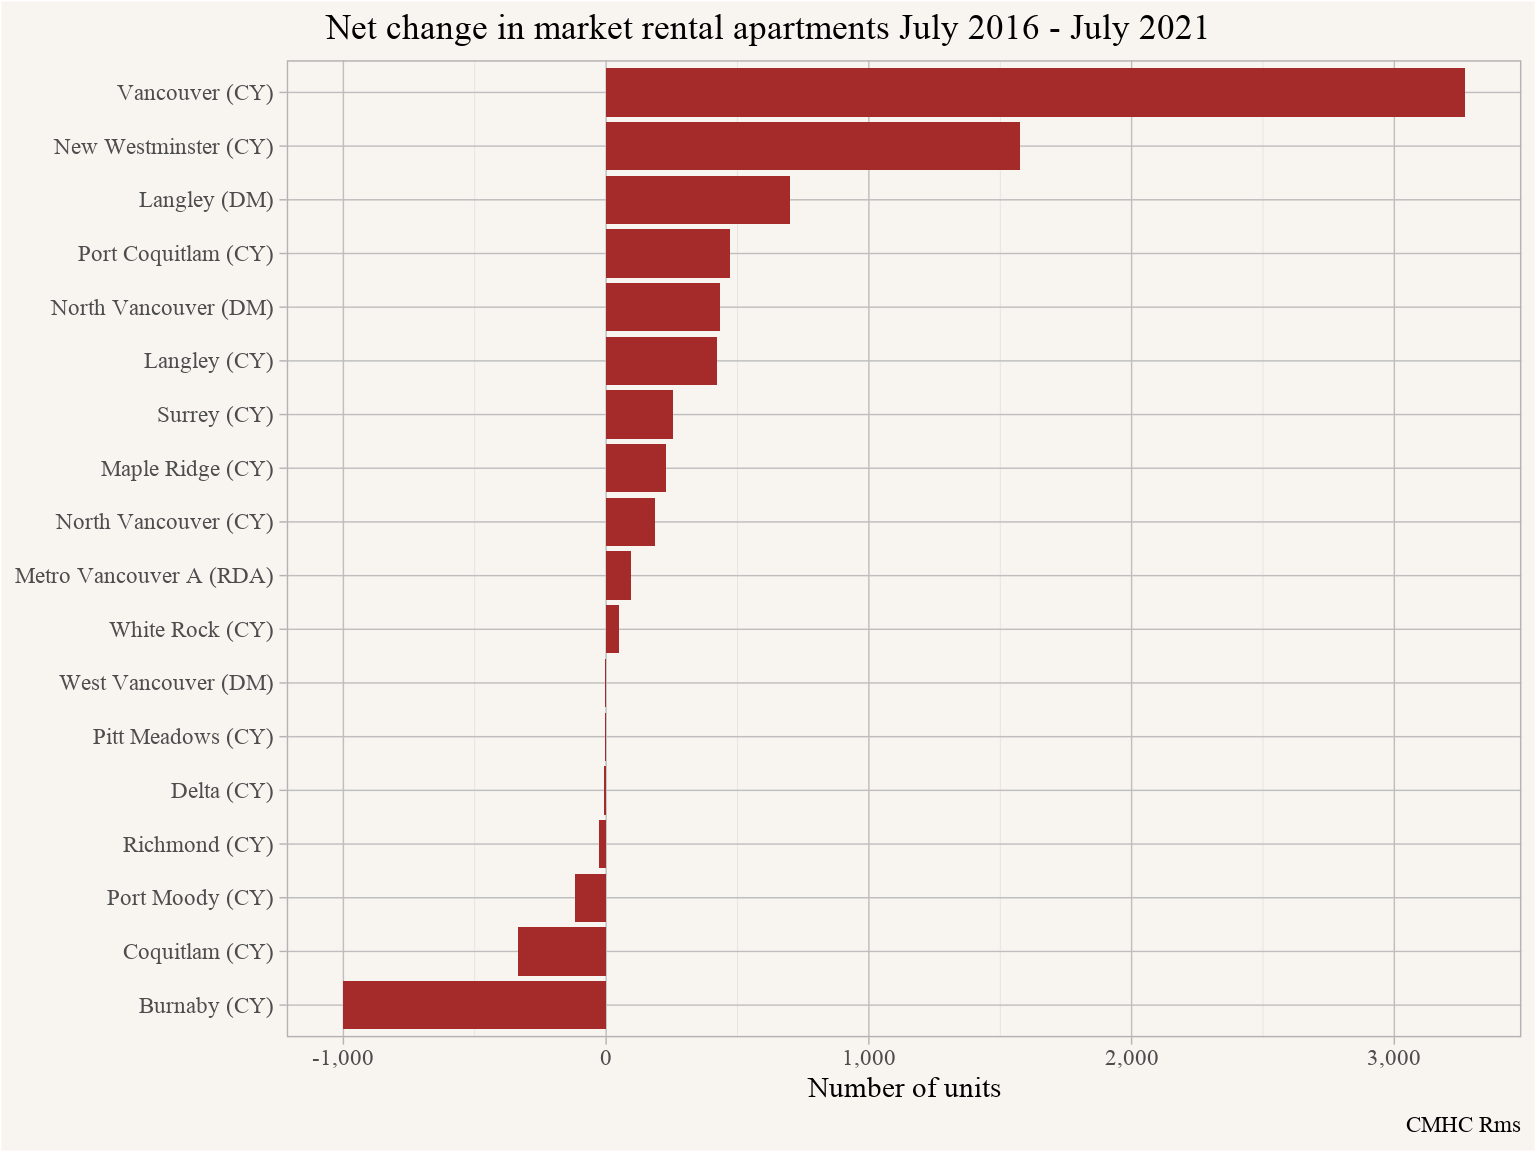
It shows that some municipalities have gained market rental units, others, most notably Burnaby, have lost market rental. Many municipalities have set adding purpose-built market rentals as a policy goal. But the same is true for non-market units, and Burnaby has now set an explicit goal to replace market rental that is lost with non-market units. This is a fairly recent change, and probably won’t have had much impact on the time frame depicted in this graph, but going forward it would be important to understand this. Just looking at the change in market rental apartments won’t suffice to understand how things are playing out in Burnaby, we need good accounting of non-market rental too.
We can get a glimpse of possible demolitions by splitting the data up by year of construction. This is not perfect, some older units might undergo deep renovations that require the building getting vacated, at which point they cycle out of the Rental Market Survey, and then later reappear as “old” (by year of construction) units.
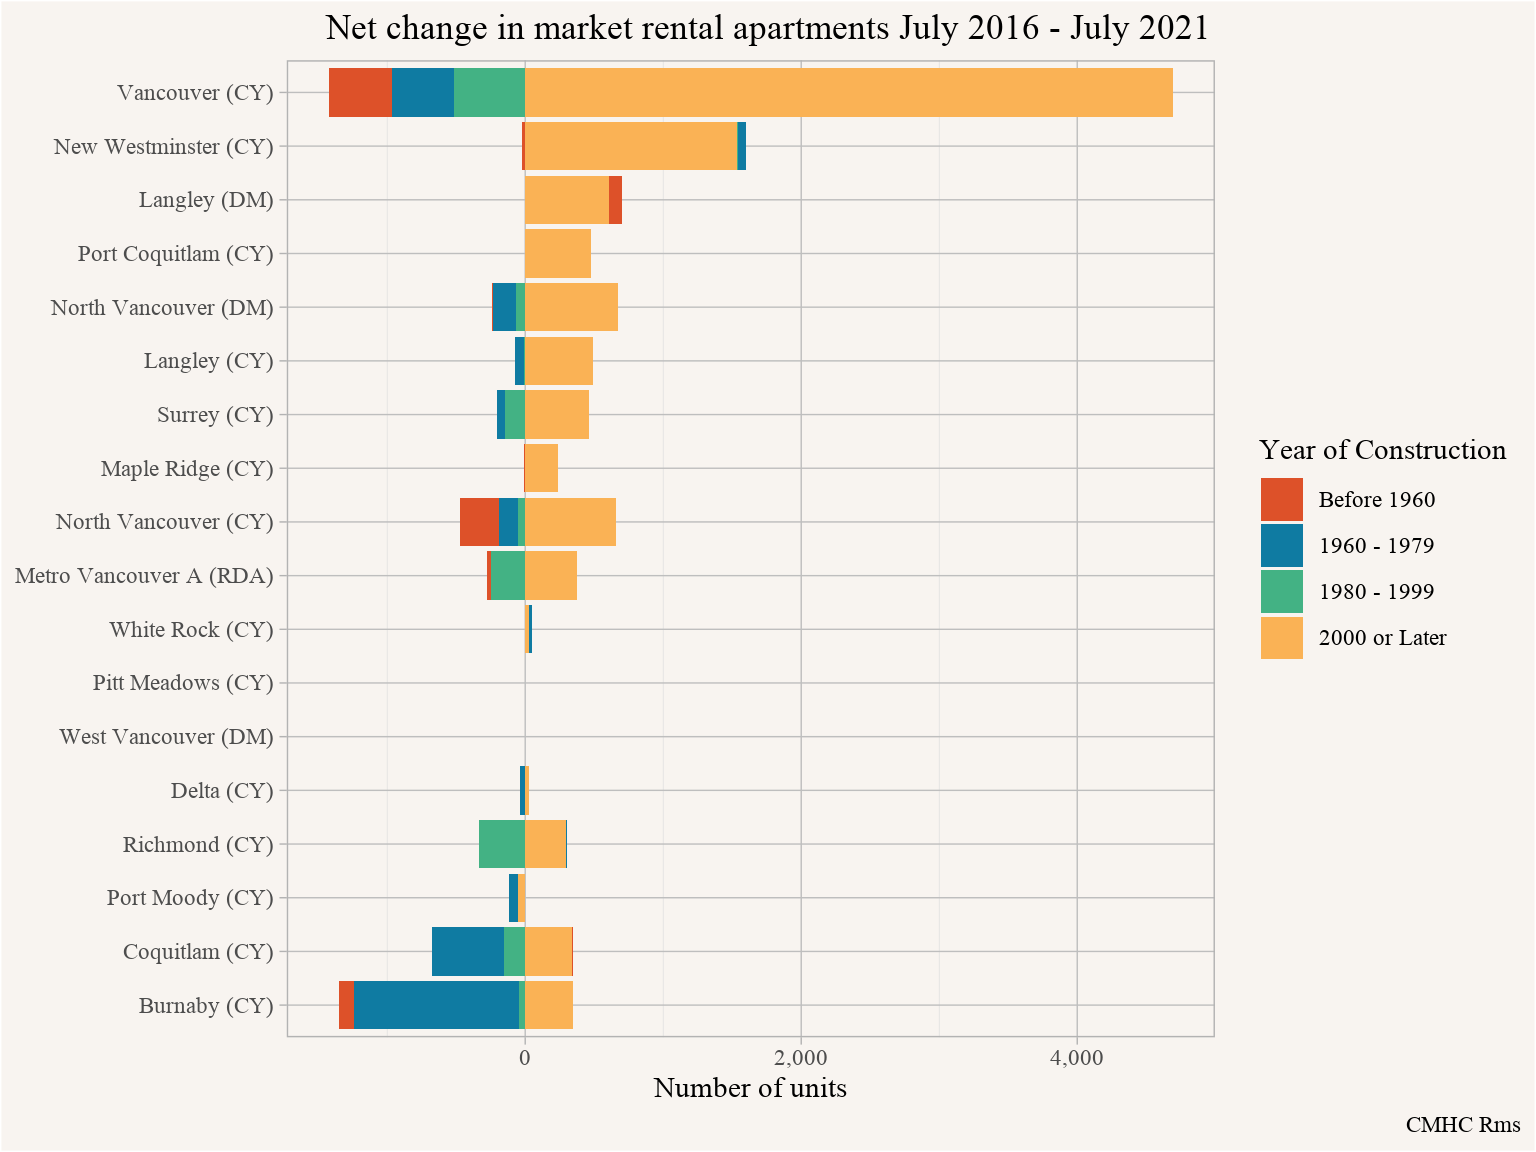
Both New Westminster and Langley show that they have gained “old” rental over this time frame, hinting at units taken off for deep renovations getting occupied again and cycling back into the survey. Another way to gain old rental is hotel conversions. But without better data it is hard to say what is going on there. How many older rental buildings were demolished? How many were converted to non-market housing? How many are undergoing deep renovations? This data can’t tell us, we would need to painstakingly look through other data sources to answer this question.
Data quality
Continuing along the lines of the previous section we can get a closer look is by comparing rental row and apartment completions to changes in the Rms universe at the census tract level.
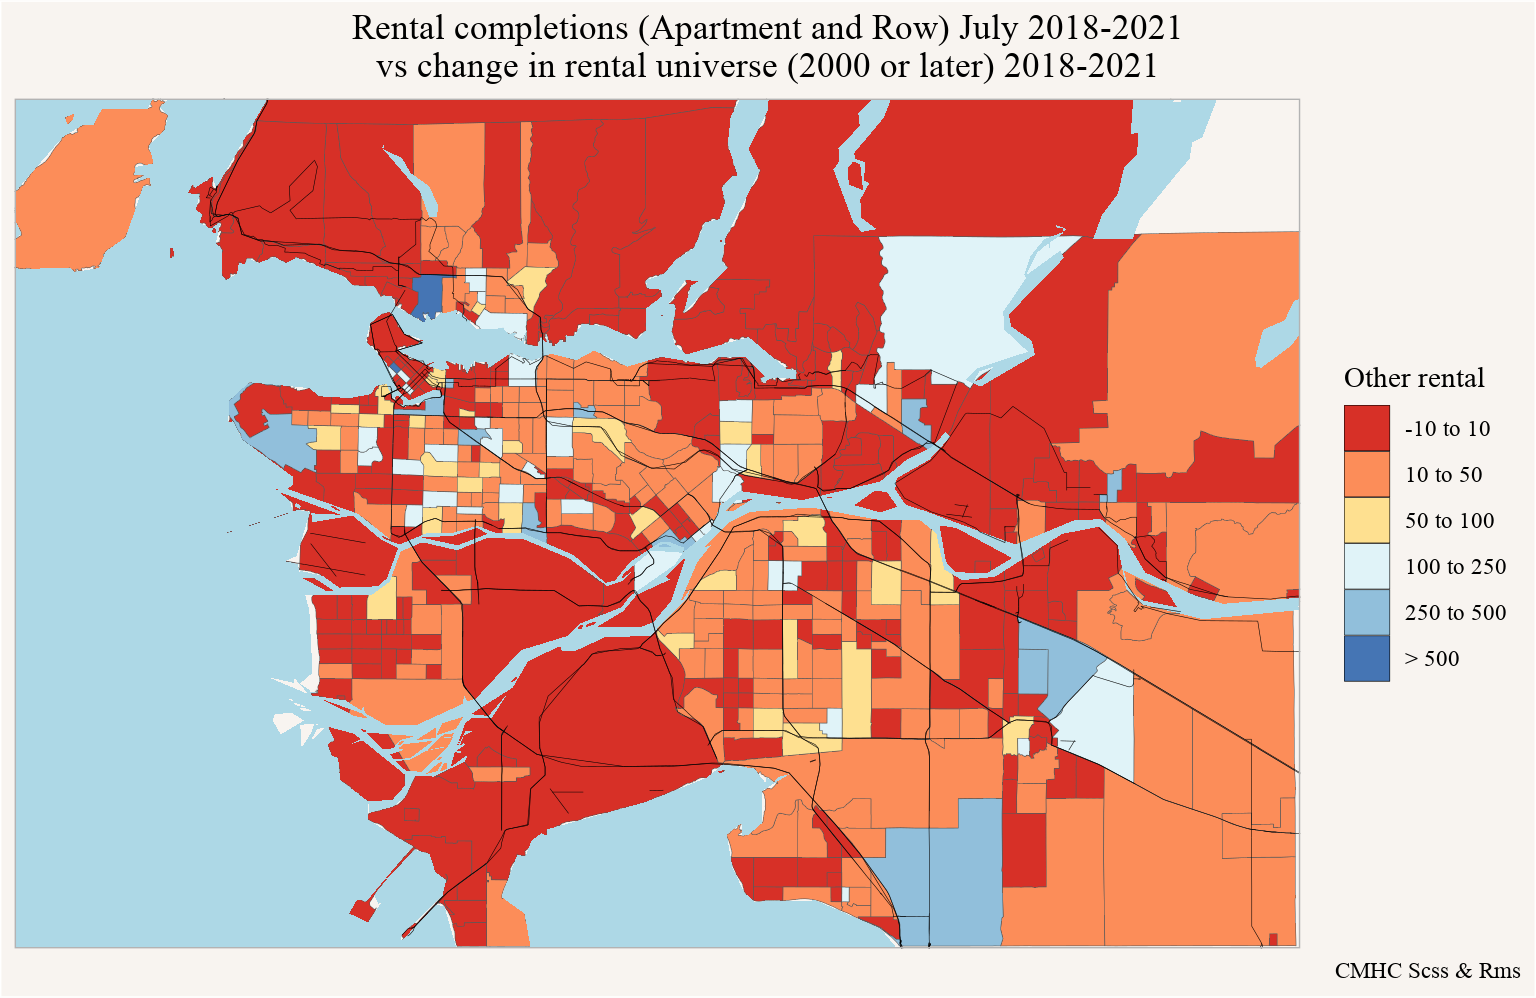
Plotting the difference between the two turns into an unexpected mess. The light blue regions are somewhat expected, these tend to be single family areas that have plausibly seen additions of suites over these years. The reddish areas are curious, these indicate that the Rms gained more Rms units built “2000 or later” between 2018 and 2021 than there were rental apartment and row completions in the Scss. This should not be possible.
The two census tracts at UBC stand out, with both showing large gaps of opposite sign. Looking more closely into the data it appears that some rental units have initially been incorrectly geocoded to the wrong census tract, which was subsequently corrected. But the change has not been applied consistently through time, making it appear in the data that a lot of market rental was demolished in one census tract and replaced with market rental in the other census tract.
We see similar issues in the West End, Yale Town, and Joyce-Collingwood.
This bring us back to the caveat from earlier, how differencing data can bring out problems in faulty datasets. And the difficulties of using CMHC data for analysis, it generally requires ground truthing and extensive cross-checking. Ideally we would have better quality data, but CMHC data simply isn’t designed to be a robust data source for (rental) housing. This could be fixed of course, but it will require a concerted effort that goes beyond just switching to a more modern database architecture.
The way forward
CMHC is a great source of housing data. Housing data is important. But CMHC data also problems. It is broadly used to inform housing discussions, but probably lacks the necessary robustness for some of the nuances. In broad strokes we know what the problems driving our housing issues are: We have a housing shortage and need more housing. But we need data to guide our response and monitor our progress and benchmark against. Tracking and understanding our housing stock is one important ingredient in this, and Canada would be well-served by better housing data.
Some of these gaps are getting addressed, but progress is slow. Administrative data remains locked up by many provinces. Nova Scotia is an outlier here with open data for property characteristics, assessment data and sales data, showing the way forward for other provinces to follow. British Columbia still chooses to keep this data locked up and sell it to private interests (as well as other branches of the Canadian government), fostering an information imbalance between large developers who buy this data and have the analytics capacity to use it on one side, and municipalities and the general public who only get selected subsets of the data at best and don’t have the capacity to create comprehensive analyses using their insular datasets. Ontario is probably in the worst shape, having lost control over how their administrative property data is used after outsourcing and selling it off. Although New Brunswick doesn’t even have a provincial land title registry.
The Canadian Housing Statistics Program has been trying to fill some of these gaps by buying and processing this data and linking it to demographic data, the other side that’s needed to address housing questions. StatCan’s refreshed building permit series helps understand how our building stock is changing, but the geographic resolution is unnecessarily coarse. The Canadian Housing Survey fills another important gap by trying to understand why people move and how satisfied they are with their living arrangements, and how this differs across segments of our society.
Some of CMHC’s methods are woefully antiquated. Starts and completions information is great, many other places don’t have this. The way this works in Canada is that people drive out to addresses where building permits have been issued to monitor construction and collect information on starts and completions. This could be automated by training a model on satellite images. StatCan is rumoured to be working on such a project, but it’s been taking quite a bit longer than one would expect.
As usual, the code for this post is available on GitHub for anyone to reproduce or adapt.
Reproducibility receipt
## [1] "2022-06-12 16:29:33 PDT"## Local: master /Users/jens/Documents/R/mountaindoodles
## Remote: master @ origin (https://github.com/mountainMath/doodles.git)
## Head: [bfe3b51] 2022-05-30: link to DM's study.## R version 4.2.0 (2022-04-22)
## Platform: aarch64-apple-darwin20 (64-bit)
## Running under: macOS Monterey 12.4
##
## Matrix products: default
## BLAS: /Library/Frameworks/R.framework/Versions/4.2-arm64/Resources/lib/libRblas.0.dylib
## LAPACK: /Library/Frameworks/R.framework/Versions/4.2-arm64/Resources/lib/libRlapack.dylib
##
## locale:
## [1] en_CA.UTF-8/en_CA.UTF-8/en_CA.UTF-8/C/en_CA.UTF-8/en_CA.UTF-8
##
## attached base packages:
## [1] stats graphics grDevices utils datasets methods base
##
## other attached packages:
## [1] mountainmathHelpers_0.1.4 cancensus_0.5.1
## [3] cmhc_0.2.0 forcats_0.5.1
## [5] stringr_1.4.0 dplyr_1.0.9
## [7] purrr_0.3.4 readr_2.1.2
## [9] tidyr_1.2.0 tibble_3.1.7
## [11] ggplot2_3.3.6 tidyverse_1.3.1
##
## loaded via a namespace (and not attached):
## [1] colorspace_2.0-3 ellipsis_0.3.2 class_7.3-20 fs_1.5.2
## [5] rstudioapi_0.13 httpcode_0.3.0 proxy_0.4-26 farver_2.1.0
## [9] ggrepel_0.9.1 bit64_4.0.5 fansi_1.0.3 lubridate_1.8.0
## [13] xml2_1.3.3 codetools_0.2-18 knitr_1.39 jsonlite_1.8.0
## [17] broom_0.8.0 dbplyr_2.1.1 rgeos_0.5-9 compiler_4.2.0
## [21] httr_1.4.2 backports_1.4.1 assertthat_0.2.1 fastmap_1.1.0
## [25] lazyeval_0.2.2 cli_3.3.0 s2_1.0.7 htmltools_0.5.2
## [29] tools_4.2.0 gtable_0.3.0 glue_1.6.2 geojson_0.3.4
## [33] wk_0.6.0 V8_4.1.0 Rcpp_1.0.8.3 cellranger_1.1.0
## [37] jquerylib_0.1.4 vctrs_0.4.1 crul_1.2.0 blogdown_1.9
## [41] xfun_0.31 rvest_1.0.2 lifecycle_1.0.1 jqr_1.2.3
## [45] scales_1.2.0 vroom_1.5.7 hms_1.1.1 parallel_4.2.0
## [49] RColorBrewer_1.1-3 yaml_2.3.5 curl_4.3.2 sass_0.4.1
## [53] stringi_1.7.6 highr_0.9 maptools_1.1-4 e1071_1.7-9
## [57] sanzo_0.1.0 rlang_1.0.2 pkgconfig_2.0.3 evaluate_0.15
## [61] lattice_0.20-45 sf_1.0-7 labeling_0.4.2 bit_4.0.4
## [65] tidyselect_1.1.2 magrittr_2.0.3 bookdown_0.26 geojsonsf_2.0.2
## [69] R6_2.5.1 geojsonio_0.9.4 generics_0.1.2 DBI_1.1.2
## [73] pillar_1.7.0 haven_2.5.0 foreign_0.8-82 withr_2.5.0
## [77] units_0.8-0 sp_1.4-7 modelr_0.1.8 crayon_1.5.1
## [81] MetBrewer_0.2.0 KernSmooth_2.23-20 utf8_1.2.2 tzdb_0.3.0
## [85] rmarkdown_2.13 rmapzen_0.4.3 grid_4.2.0 readxl_1.4.0
## [89] git2r_0.30.1 reprex_2.0.1 digest_0.6.29 classInt_0.4-3
## [93] munsell_0.5.0 bslib_0.3.1Reuse
Citation
@misc{ins-and-outs-of-cmhc-data.2022,
  author = {{von Bergmann}, Jens},
  title = {Ins and Outs of {CMHC} Data},
  date = {2022-06-12},
  url = {https://doodles.mountainmath.ca/posts/2022-06-12-ins-and-outs-of-cmhc-data/},
  langid = {en}
}
