(Joint with Nathan Lauster and cross-posted at HomeFreeSociology)
In May we estimated suppressed household formation across Canada using what we called the Montréal Method, finding strong evidence for suppression across many parts of Canada. As a reminder, we designed the Montréal Method to estimate housing shortfalls related to constraints upon current residents who might wish to form independent households but are forced to share by local housing markets. Now that we’ve got 2021 Census data out, it’s time to update our estimates. Given the data available, currently we can only estimate metro area effects of our previous Model 1 (crude household maintainer rates) and Model 2 (age-adjusted household maintainer rates). But that’s a start, and we’re also now enabled to extend the long timelines for Toronto, Montréal and Vancouver from our previous post to include 2021. Overall, current suppression of households alone suggests a shortfall of over 400,000 dwellings in Metro Toronto, and 130,000-200,000 across Metro Vancouver.
Comparing 2021 to 2016
To begin, we look at age-adjusted household maintainer rates across the 20 most populous metro areas in 2016 and 2021, ordered by how much they changed.
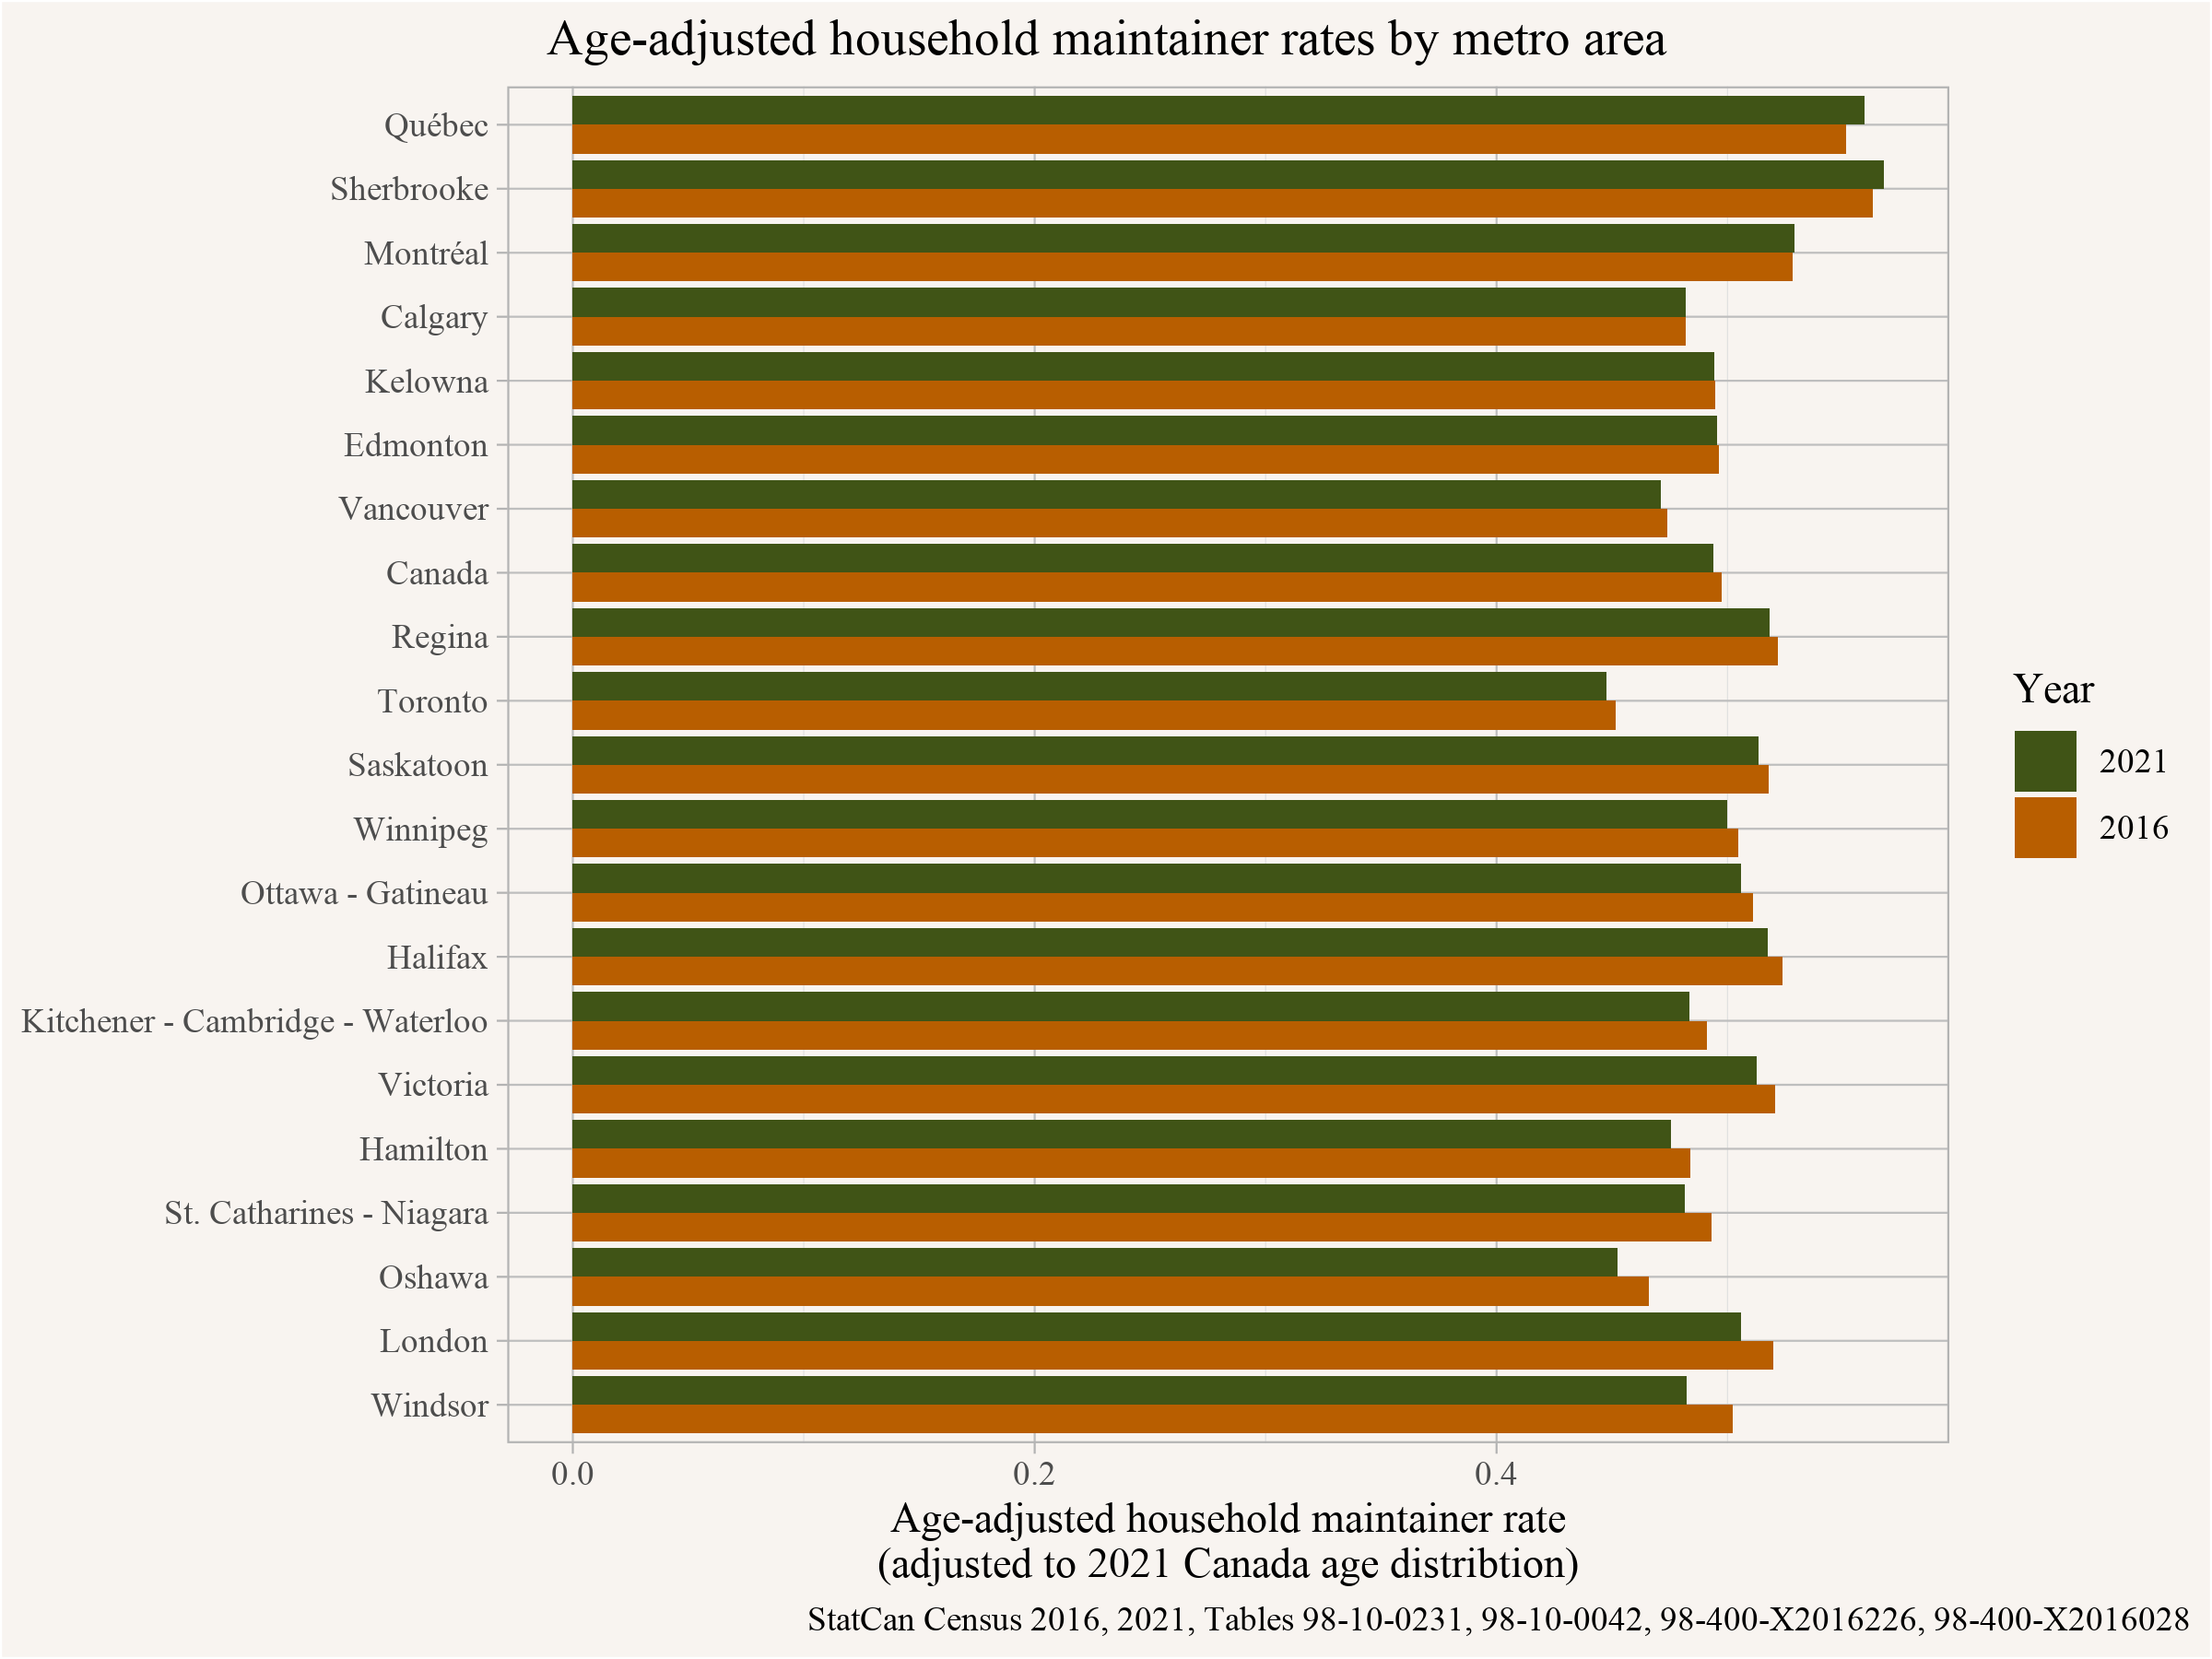
The picture we see shows some areas with increases in age-adjusted household maintainer rates, especially in Québec, but most show reductions, especially in in the Greater Toronto Area, implying it’s gotten harder to set up an independent household there.
Age-adjusted rates can mask how household maintainer rates are shifting across age groups, but looking at Canada overall the picture is quite consistent with reductions in household maintainer rates through almost all age groups.
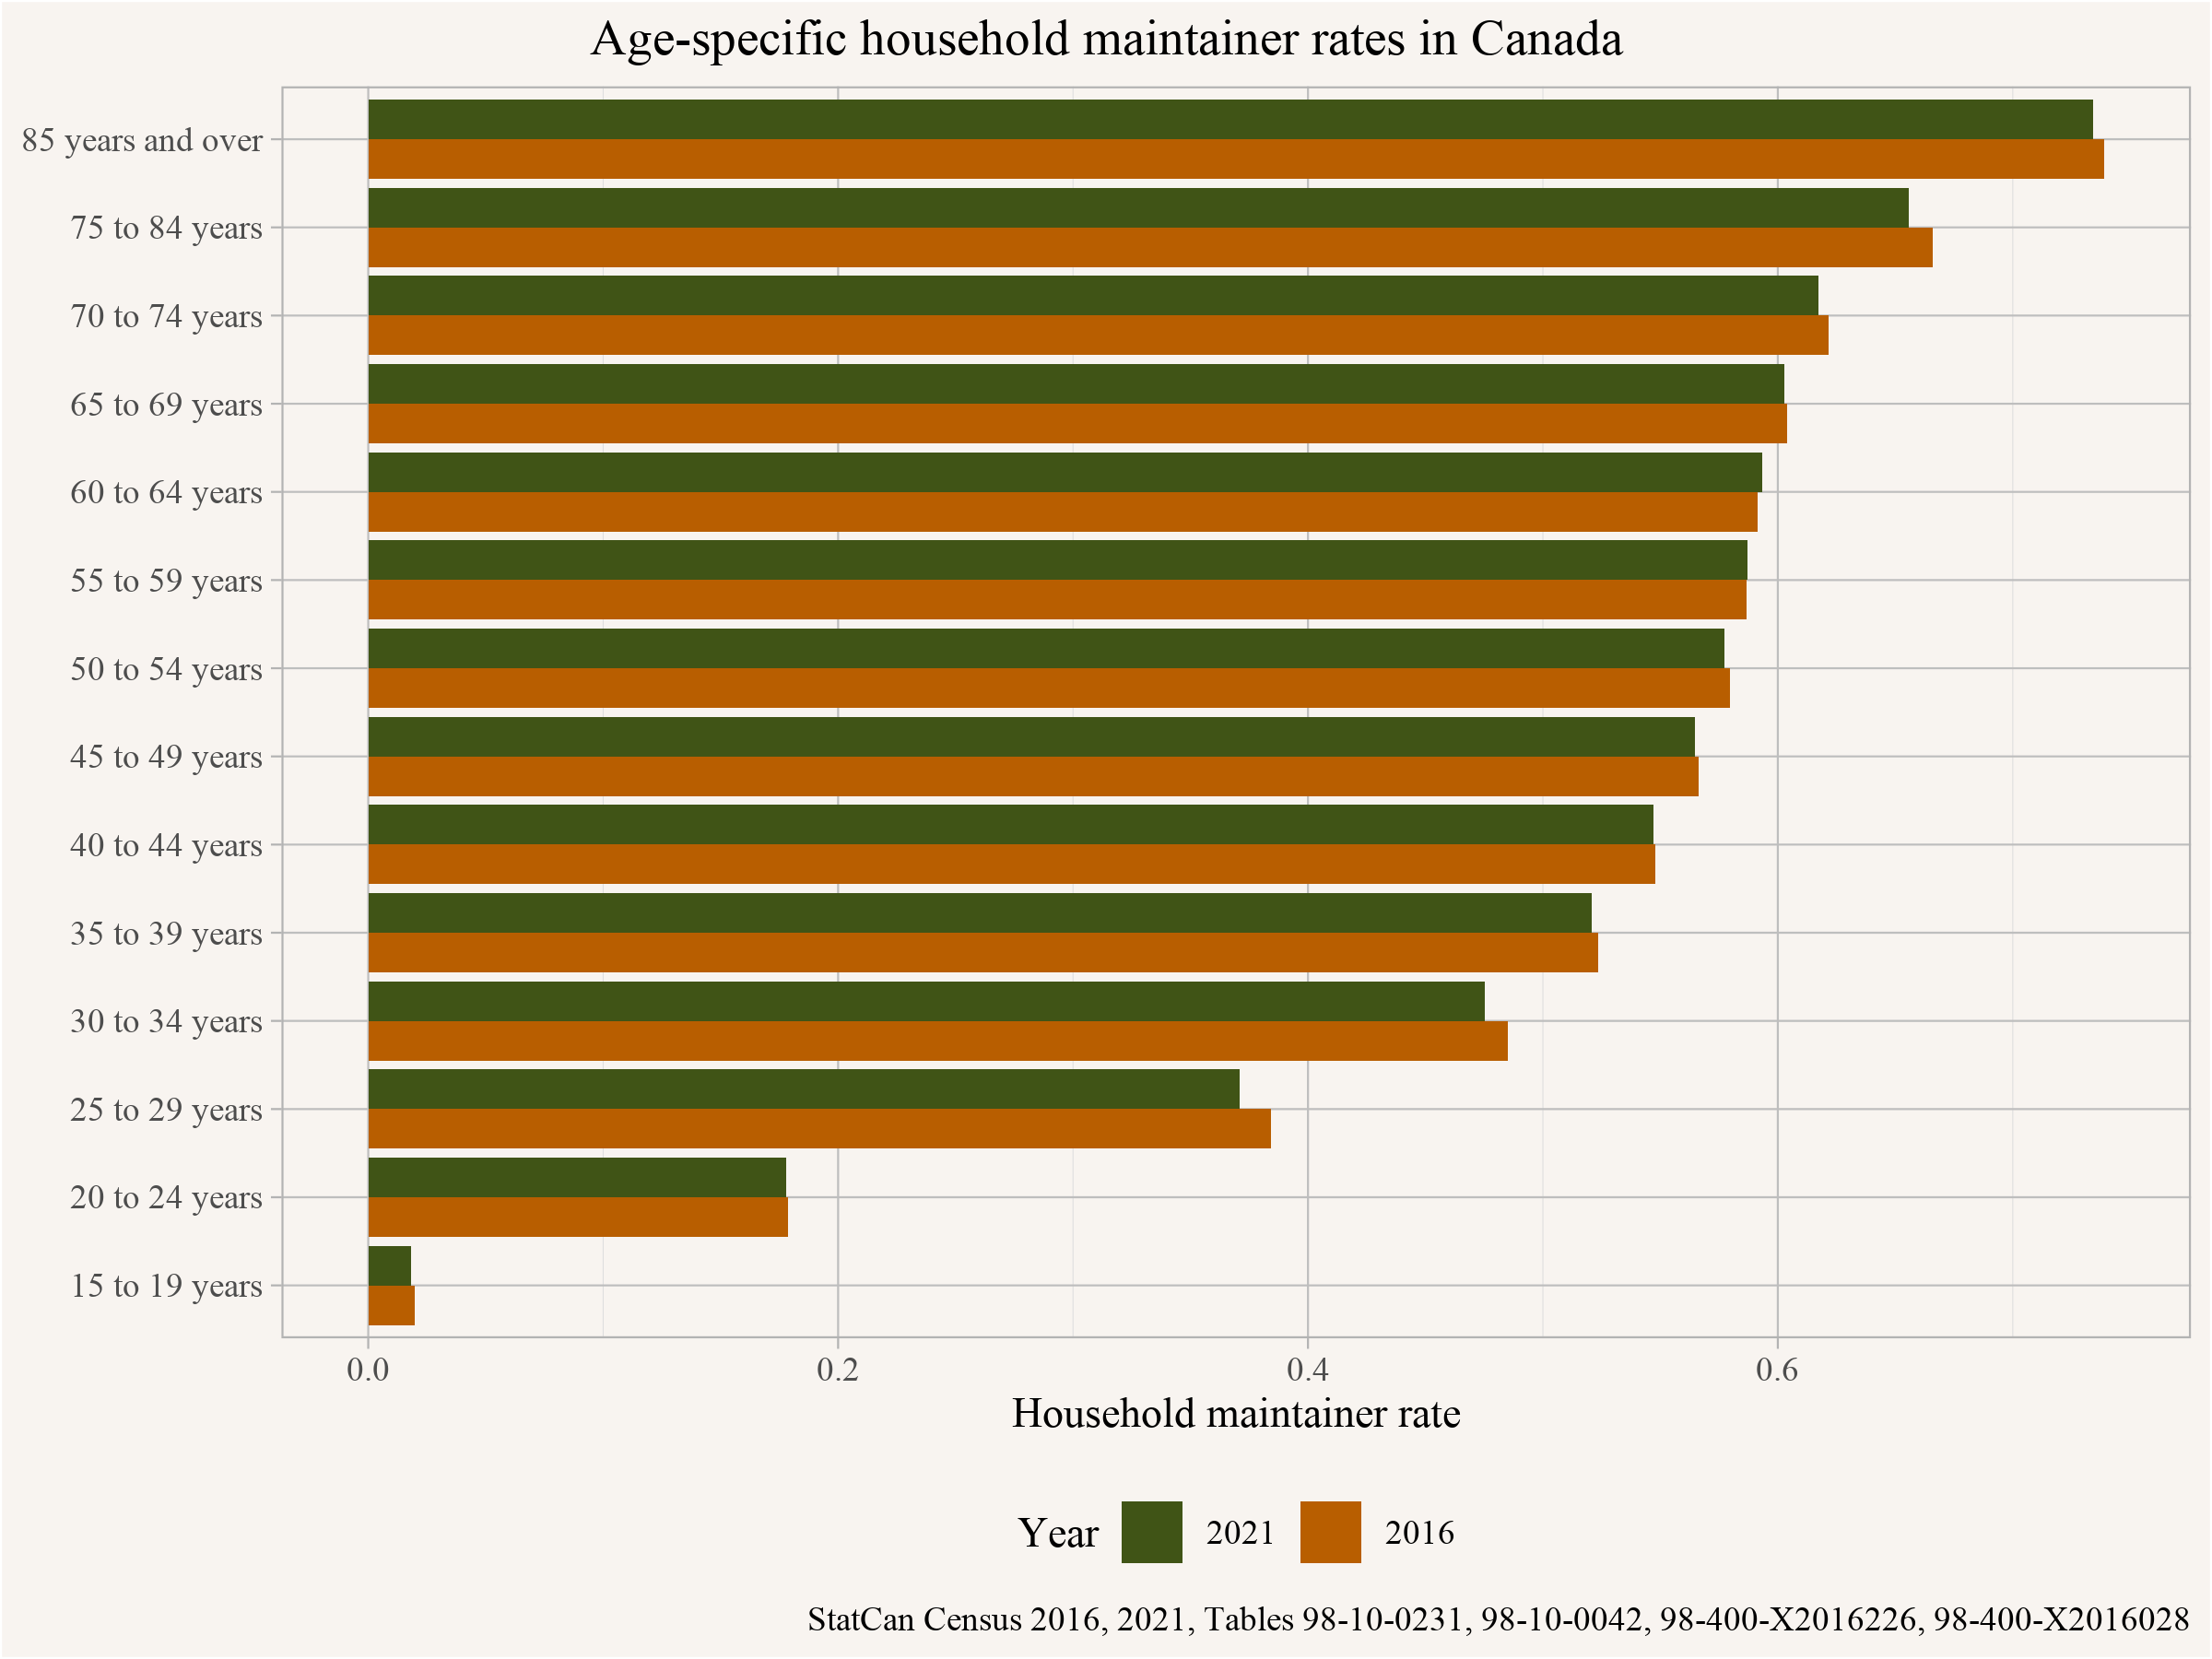
Reductions in maintaining an independent household are particularly pronounced in the 25 to 34 year old age groups, but we also see marked declines in the 70+ age range. Let’s break this out by metro area geography to pick up any differences.
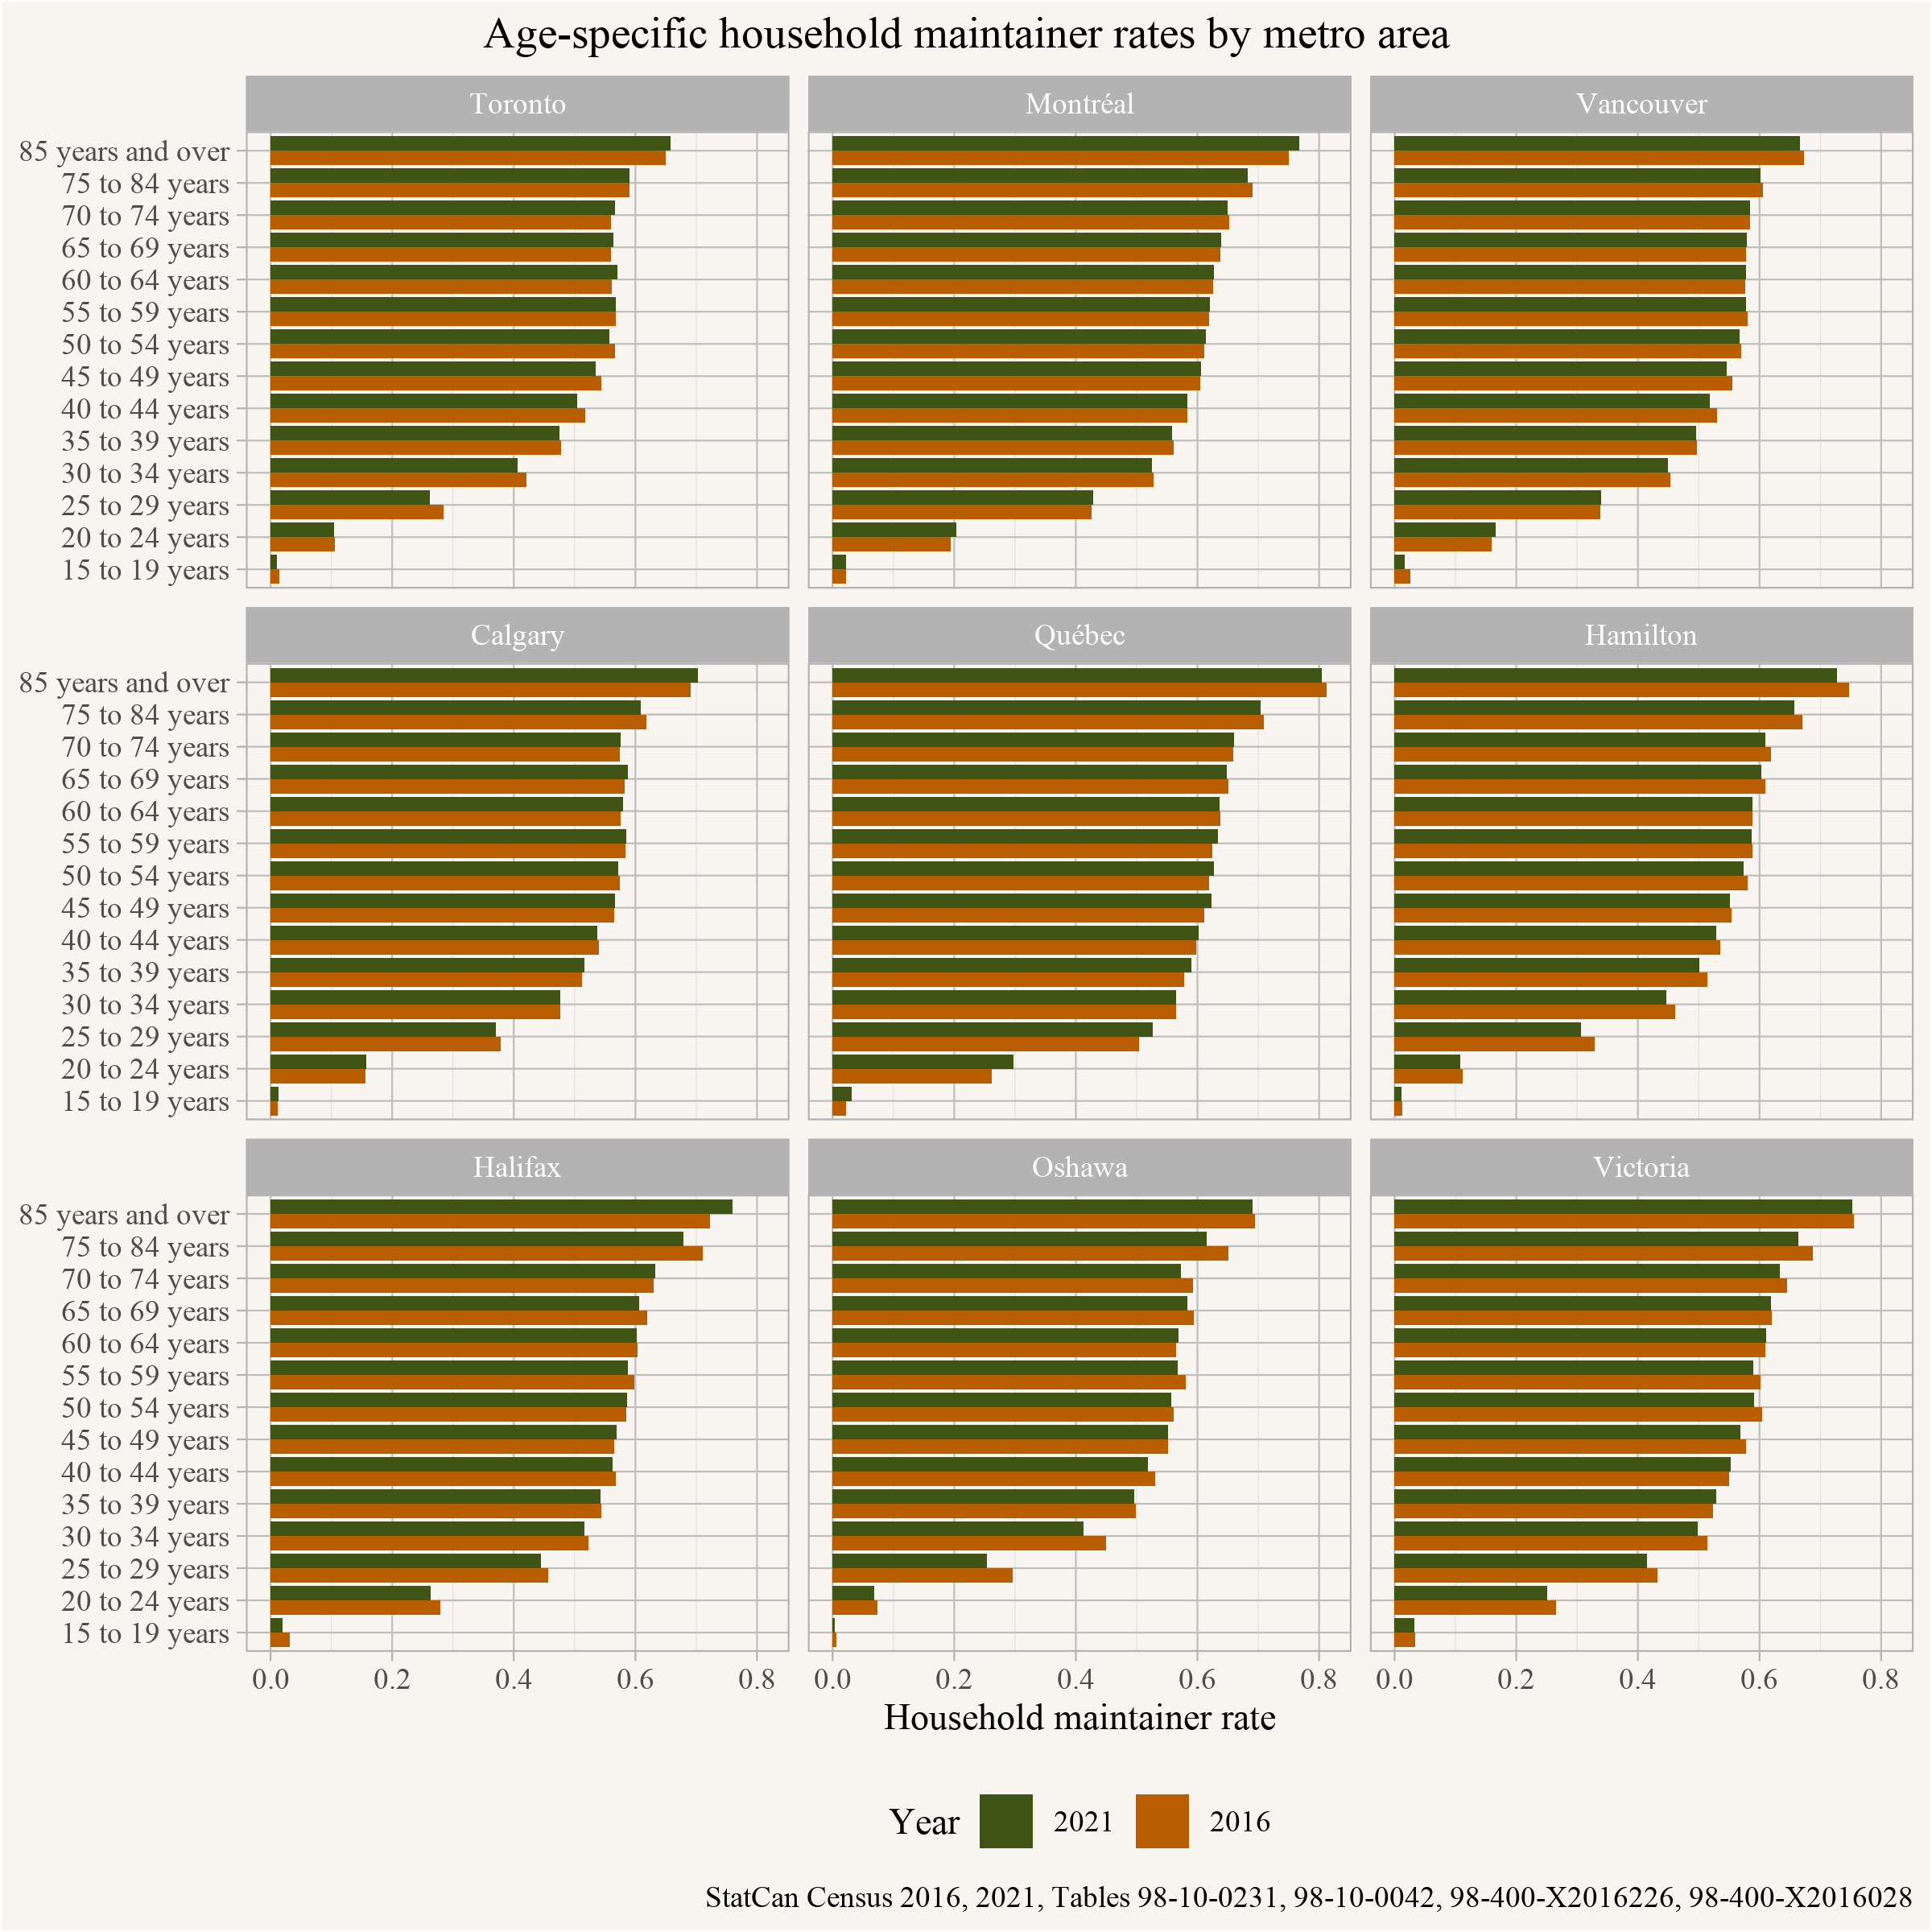
Metro variation is marked! Toronto shows decreasing household maintainer rates for ages below the late 50s, and increases above that. Québec shows increases in household maintainer rates generally across the board. Vancouver shows decreases for ages 35 through 50, whereas Hamilton, Oshawa, Victoria, and Halifax show decreases for almost all but the oldest age group. We also want to note the very different levels of age-specific household maintainer rates, with Québec and Montréal showing higher rates in all age groups than most of their peers, and Toronto having lower rates than most.
2021 caveats
It’s important to keep in mind that 2021 wasn’t a usual census year. People’s locations in May of 2021, in particular, were heavily impacted by the first year of the COVID-19 epidemic and its whiplash effects on things like local employment, on-campus university enrollments, and the movements of elders into long-term care. How all these trends might impact household maintainer rates still remains quite speculative. In some cases, trends might’ve even cancelled one another out. For example young adults moving back in with their parents during COVID might’ve reduced household maintainer rates even as young adults formerly living as roommates might’ve split up into separate apartments as part of social distancing efforts, boosting household maintainer rates within the same age range.
Deaths from COVID could also influence maintainer rates directly, particularly for the older adults most vulnerable to the virus. That said, some of the largest impacts were contained within long-term care homes, and thus outside of the population within private households we’re looking at here.
Timelines
Let’s pull out our three biggest Metro areas for longer timelines on age-specific household maintainer rates.
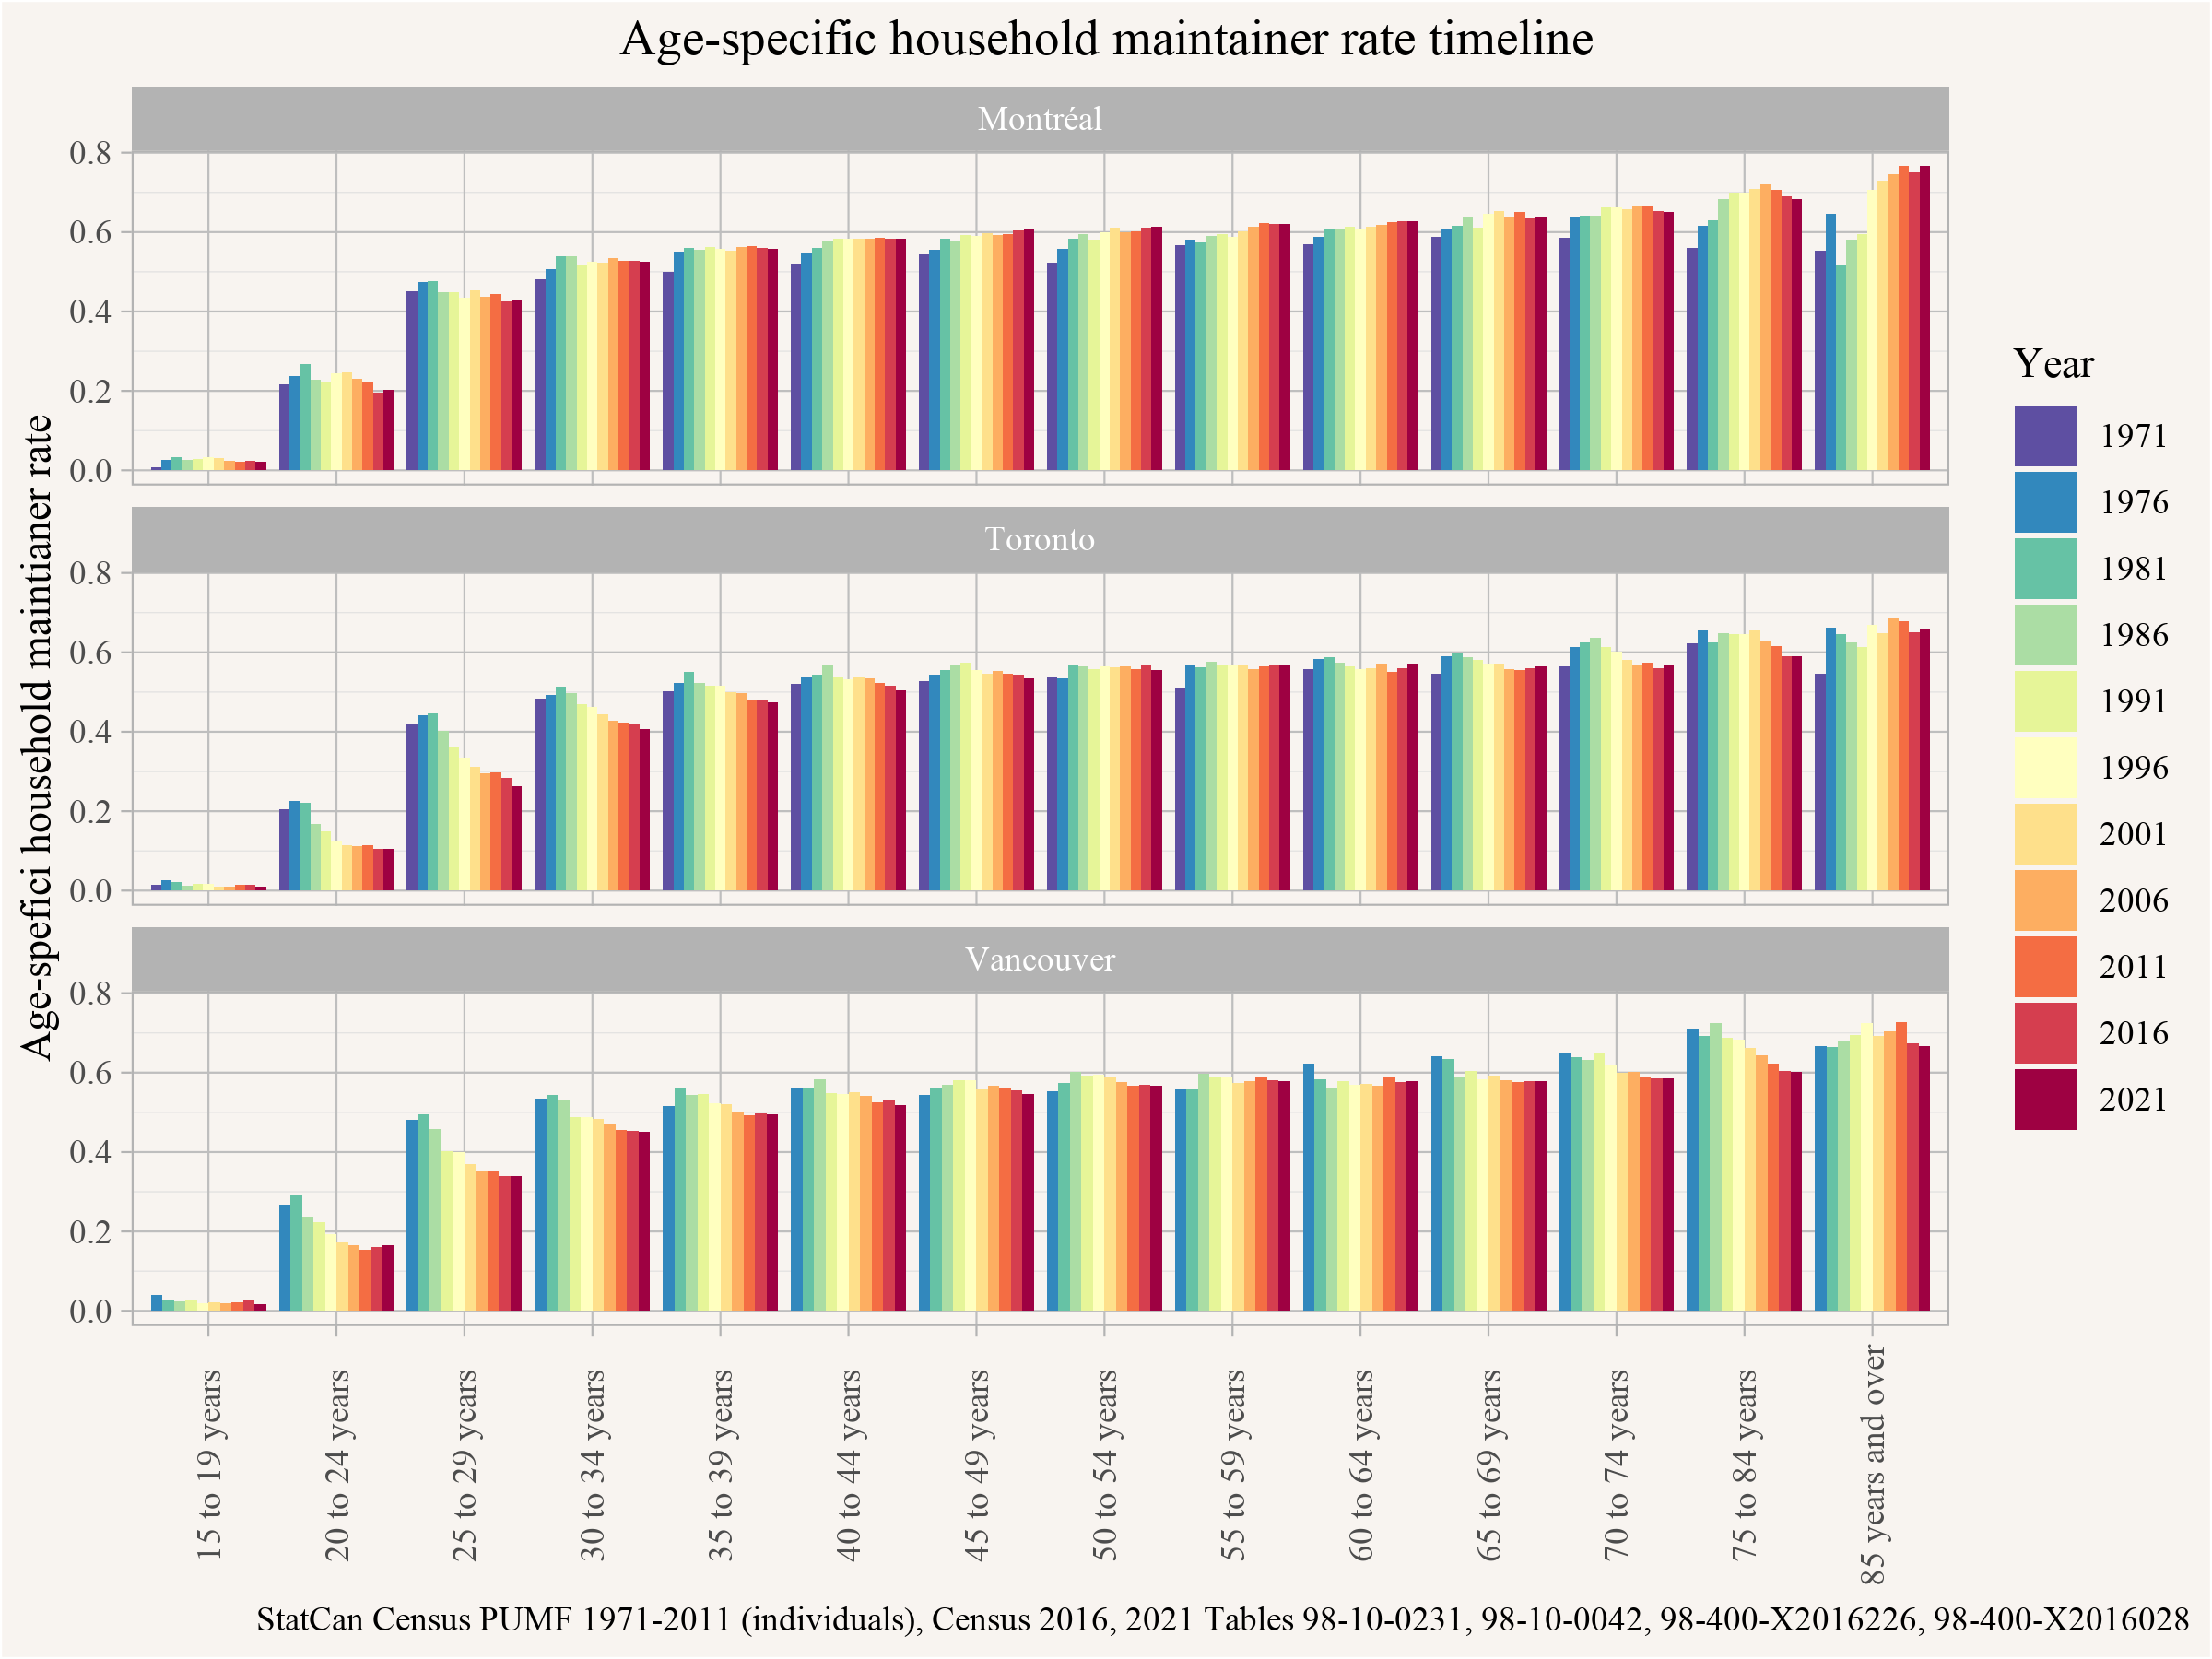
The strongest observable patterns, as we noted previously, concern the dramatic historical declines in household maintainership for young adults in Toronto and Vancouver. By contrast young adults saw much greater stability in Montréal, where declines in household maintainership only began to appear quite recently. Adding in the 2021 data indicates that Montréal’s household maintainer rates for young adults have recovered a little from these declines.
Was Montréal’s recovery in independence for young adults about the return of cheaper rents? To dig into this a little more we look at rent quartiles of purpose-built rental housing in Montreal, adjusted by CPI and a selection of income measures.
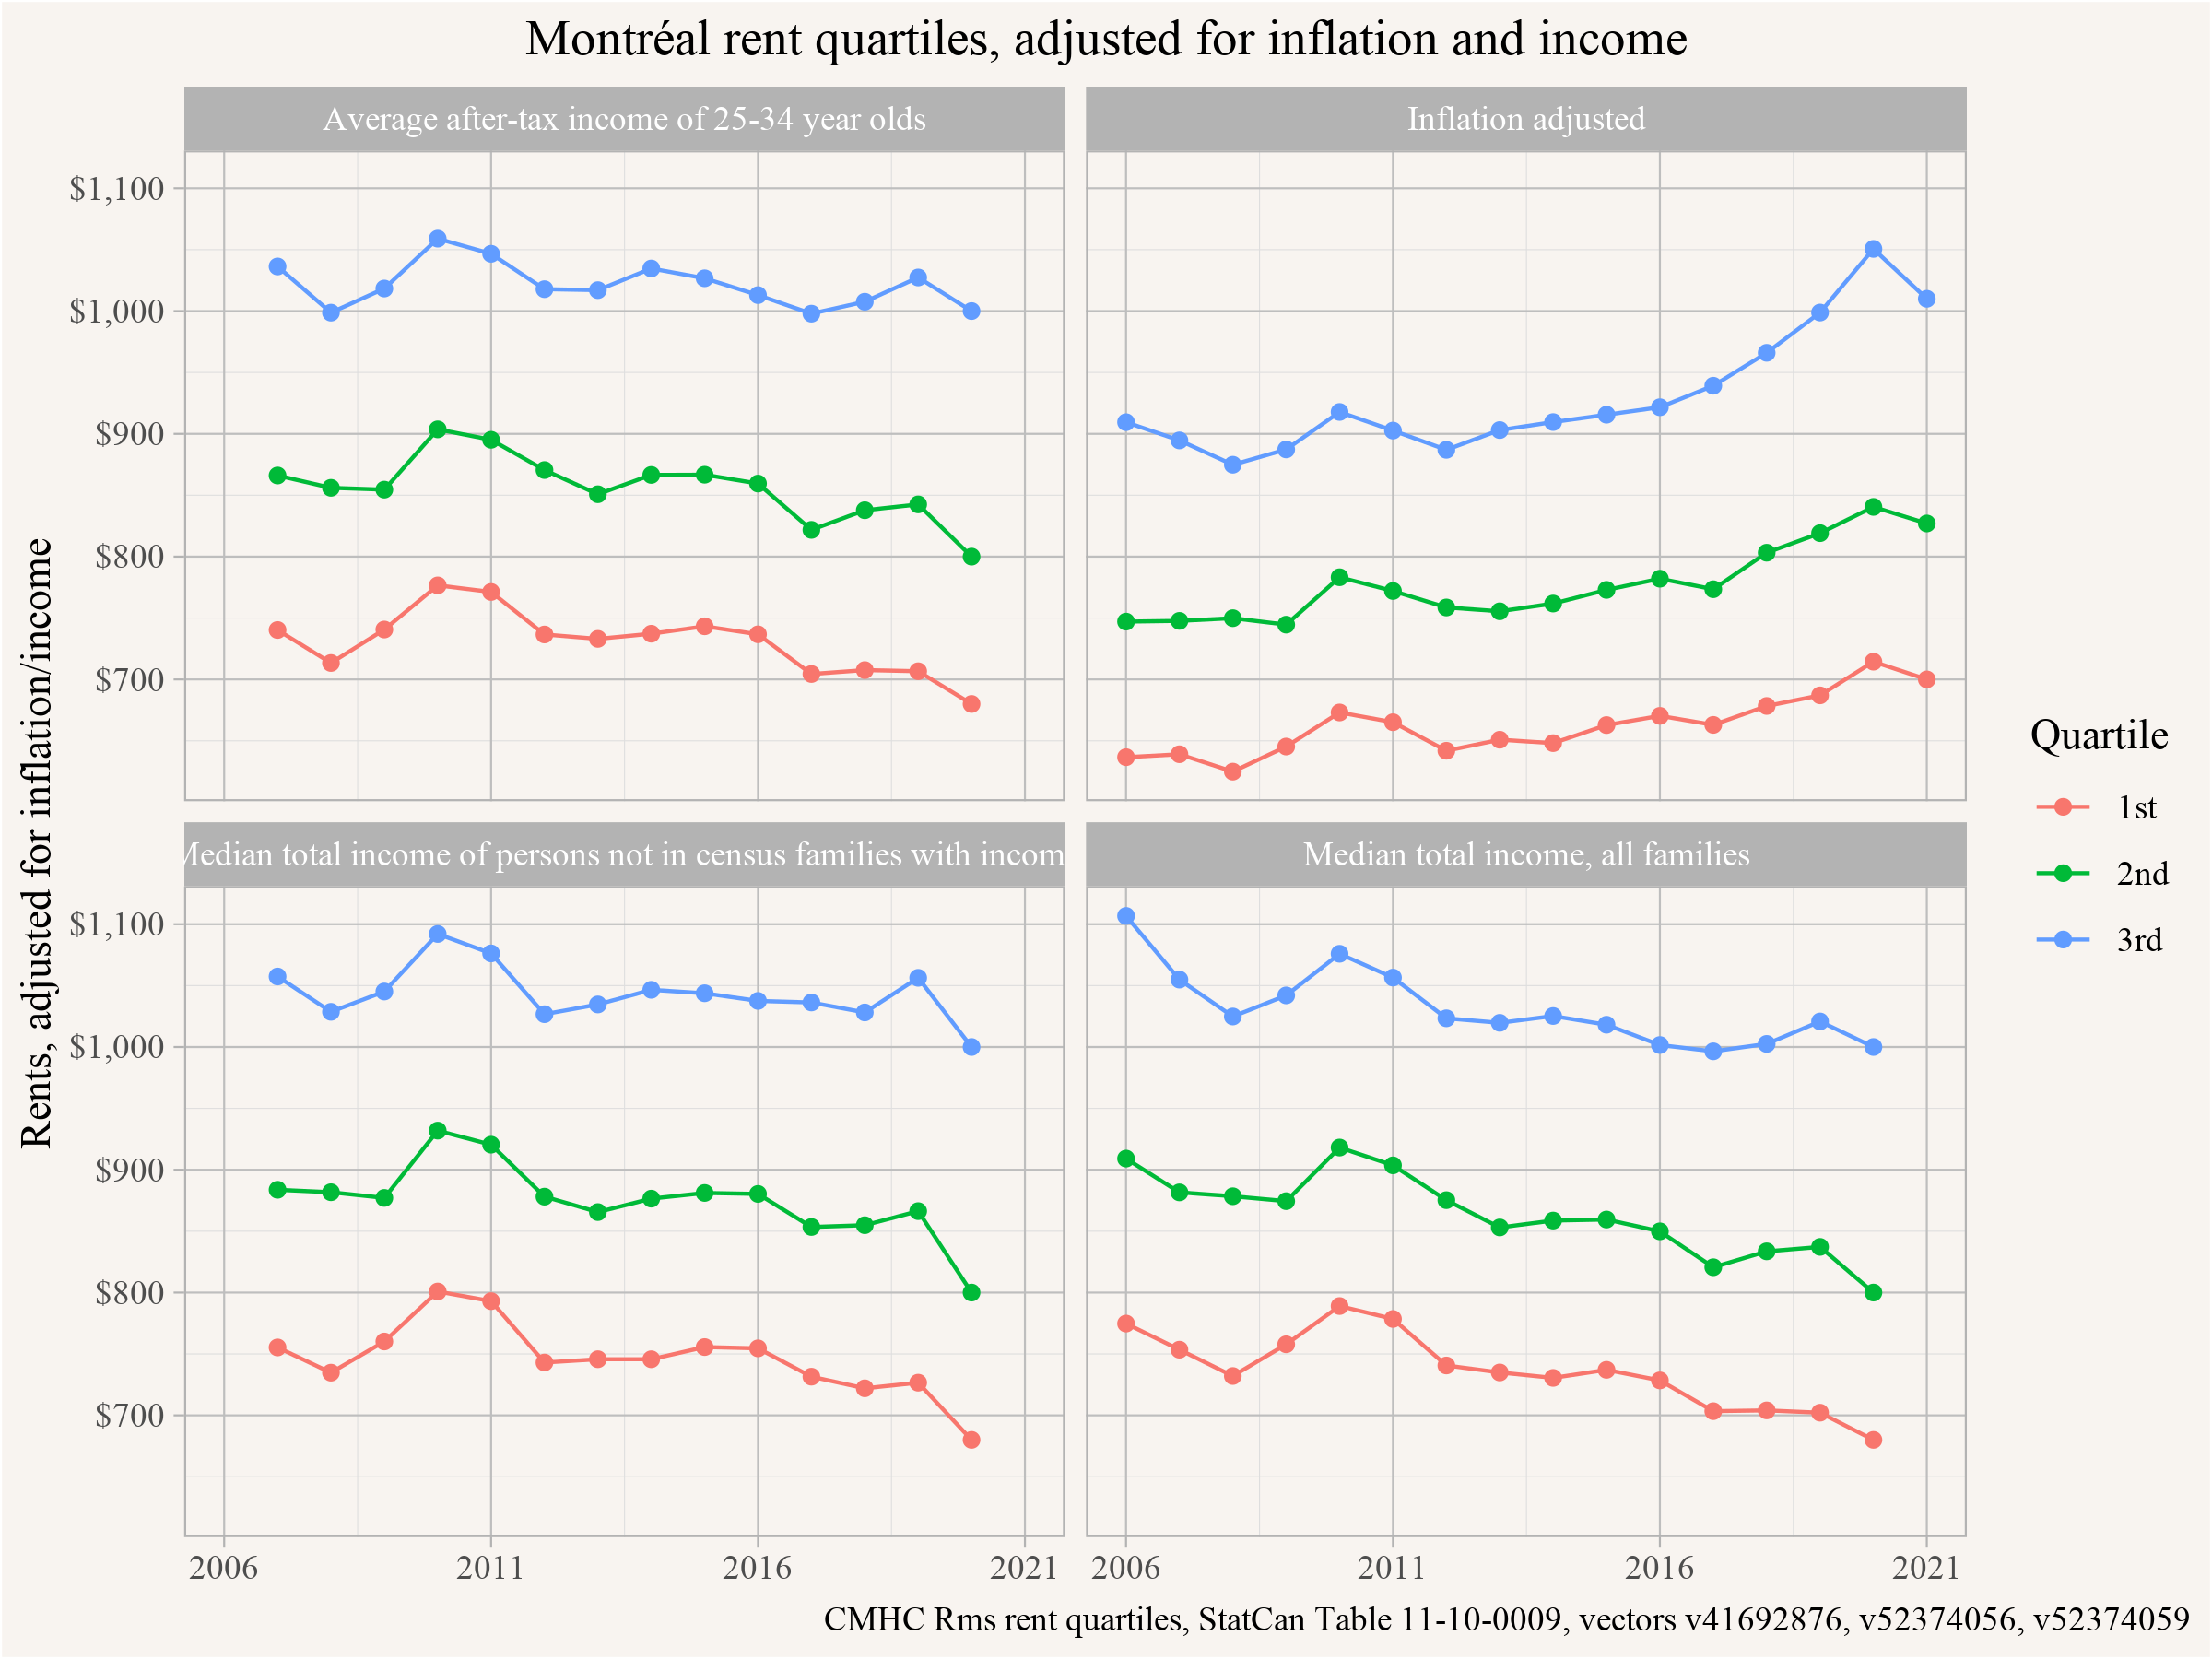
When adjusted for inflation or income, rents look like they were increasing or stable prior to the pandemic. But rents dropped across all measures by November of 2020, the last Rental Market Survey prior to the 2021 Census. Of note, income-adjusted estimates of rent for the 2020 data point should be viewed with caution due to impacts of COVID and related supports on incomes. Nevertheless, the data broadly supports the idea that lower rents by 2021 may have boosted household maintainer rates for young adults in Montréal.
To better directly compare metro areas for each age group, We can flip the age-specific household maintainer rate graph by colouring by metro area and faceting by year.
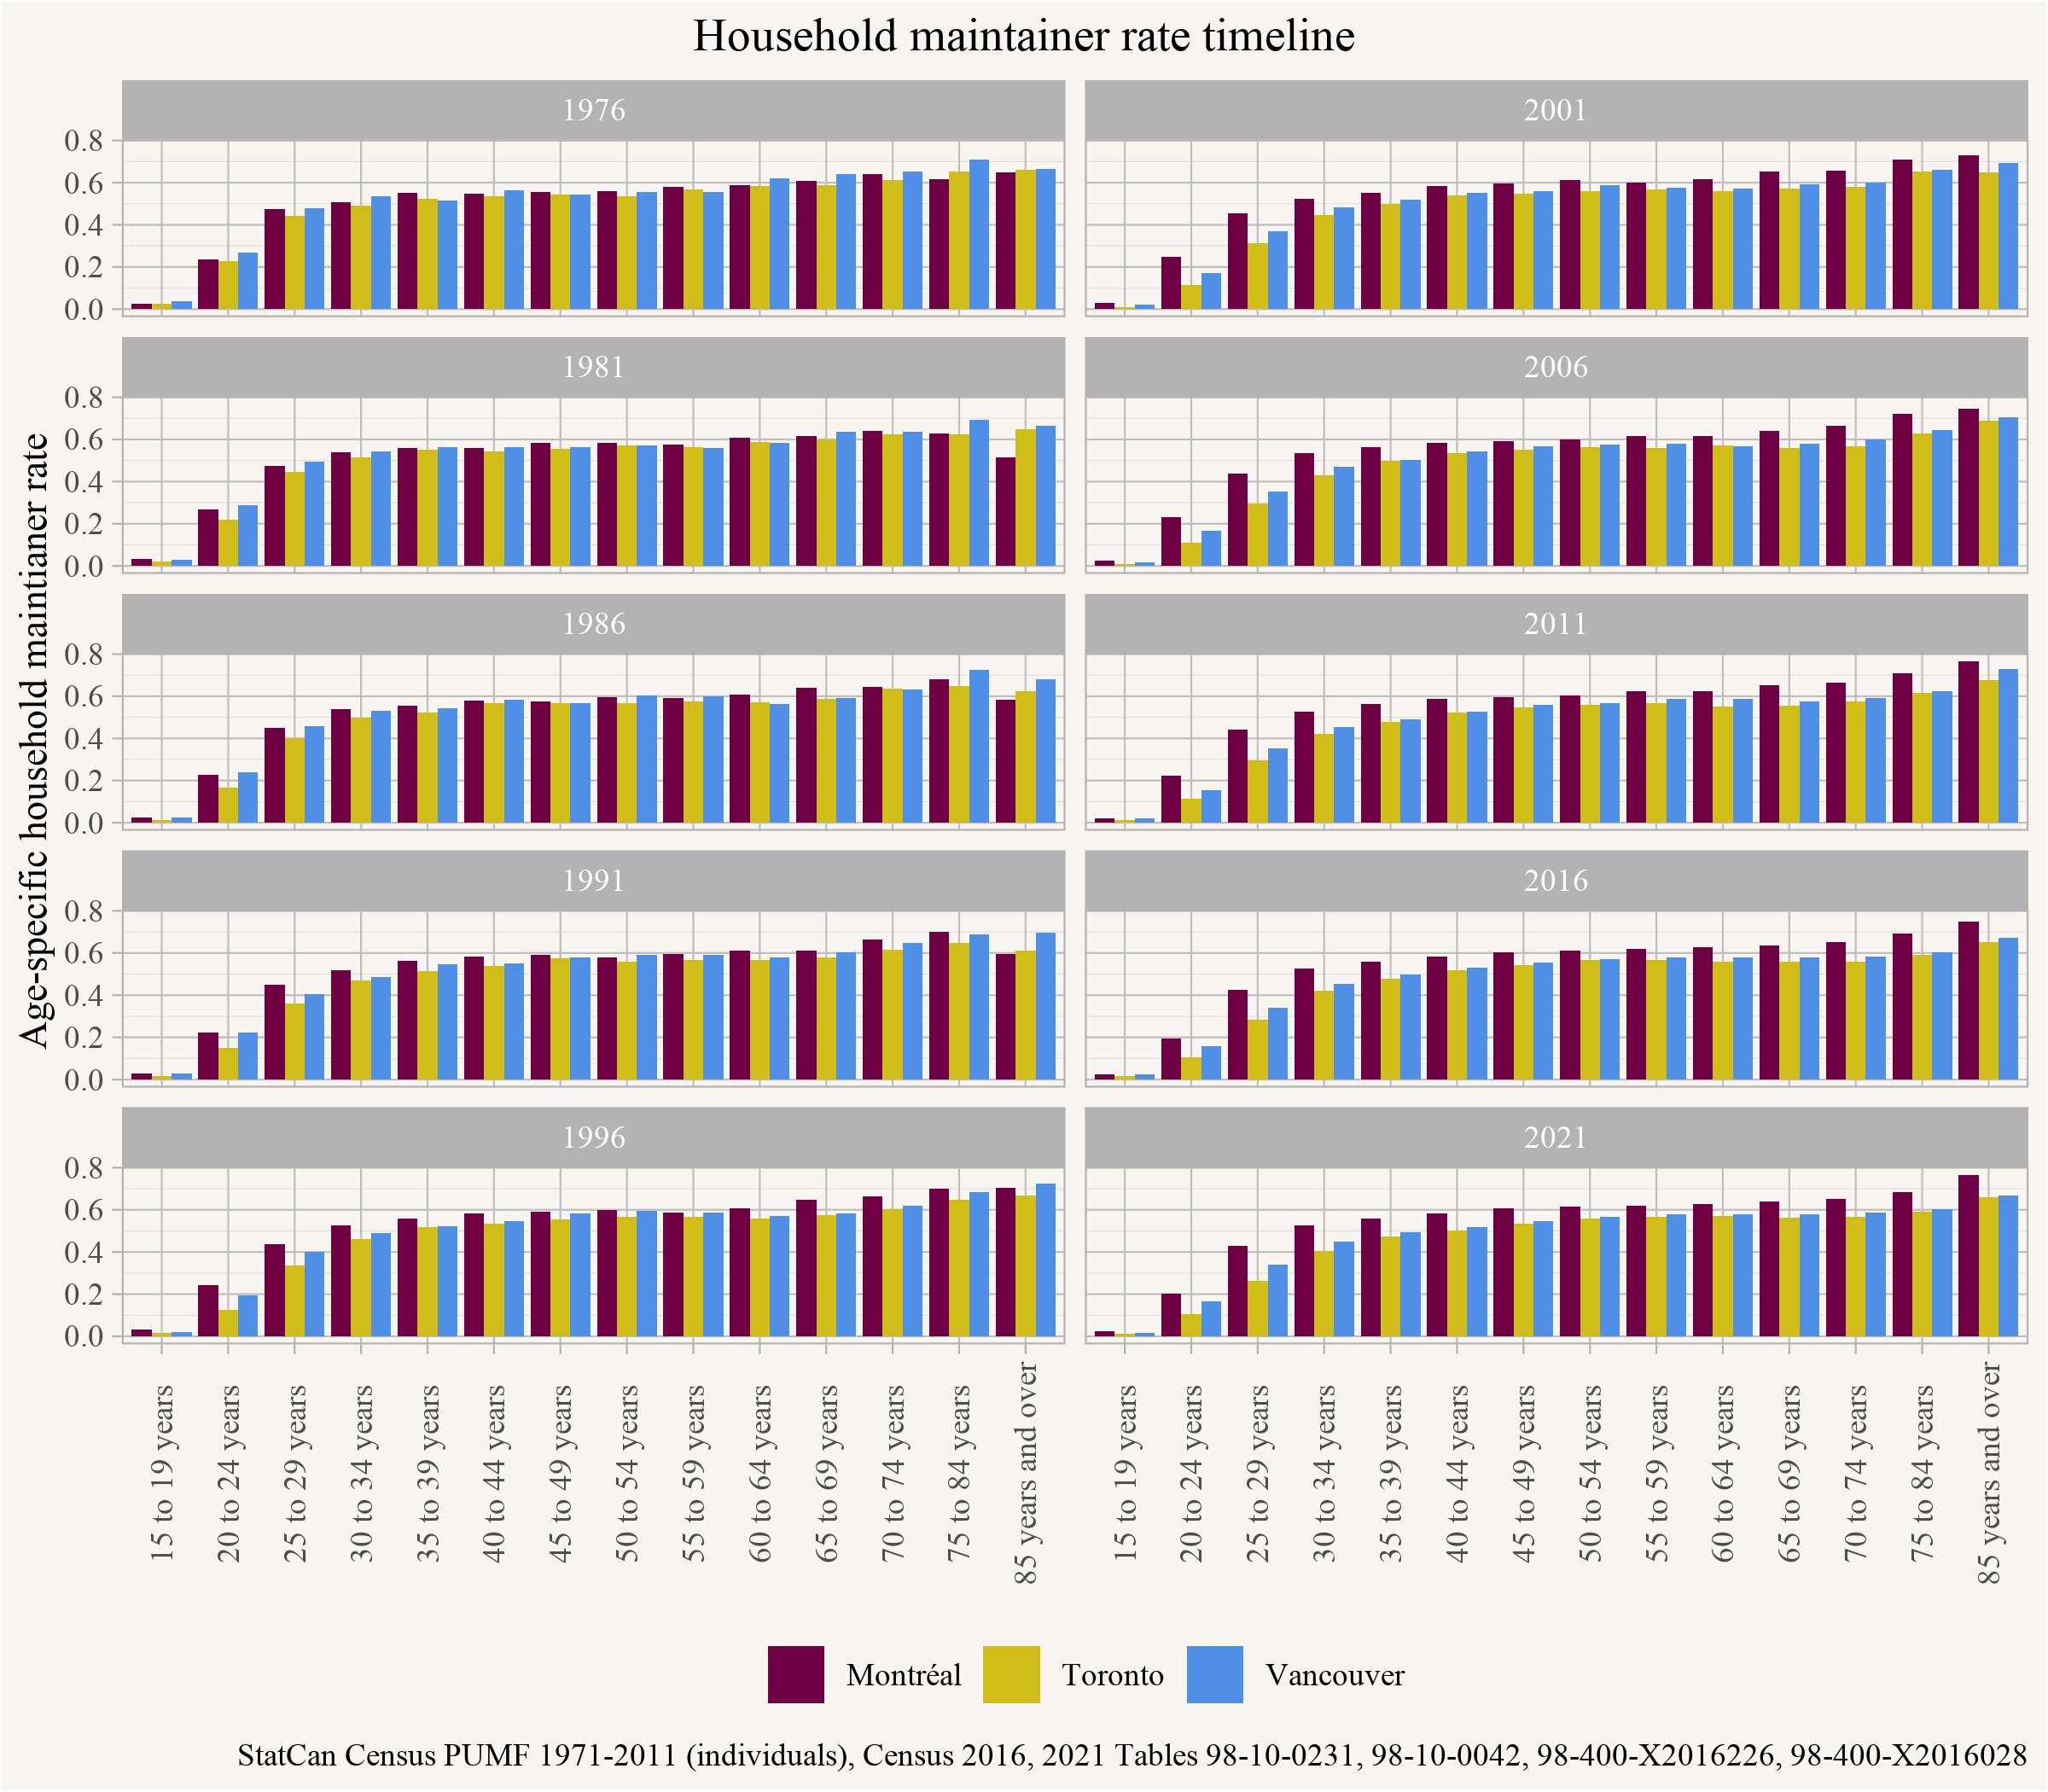
This highlights how over time Vancouver and especially Toronto, starting with younger age groups and then moving up the age ranks, have experienced dropping household maintainer rates relative to Montréal.
We’re especially interested in Montréal in part for its potential to serve as a counterfactual for what we might expect household formation to look like in an unconstrained housing market in Canada. But as discussed above, Montréal may not be a clean counter-factual for a non-squeezed housing market any more. Despite what looks like a recent recovery in household formation for young adults, household maintainership remains down relative to previous decades, with signs of dropping household formation in the younger age groups in the last several censuses prior to 2021. So here we add Québec City as a second counter-factual, just to give an alternative scenario for a place where households appear to form quite easily.
While Québec City provides us a second counterfactual to consider, there are factors other than age that might impact household formation, and our Model 3 of our previous post tries to get at that, loosely labelling this factor as “culture”. What generally gets captured under “culture” is confounded by other important factors, chiefly income. And there is a real danger of attributing lower household formation rates of certain groups to “culture” when in reality it’s just systemic barriers leading to lower incomes that are partially or chiefly responsible for historic differential household formation rates across “culture”. We can’t run our Model 3 yet given the limited data available for 2021, but we want to point out that Québec City is culturally very homogeneous which may skew the results to the extent that “culture” plays a role in household formation. Montréal is much more culturally diverse and similar to other large Canadian metro areas, and in that sense we view the Montréal scenario as a more robust counter-factual despite recent signs of slowing household formation in younger age groups. So view the Québec scenario with appropriate caution!
For our new estimates, We start out by asking by how many households each metro area would have to grow to achieve the same (age-specific) household maintainer rates as Montréal or Québec.
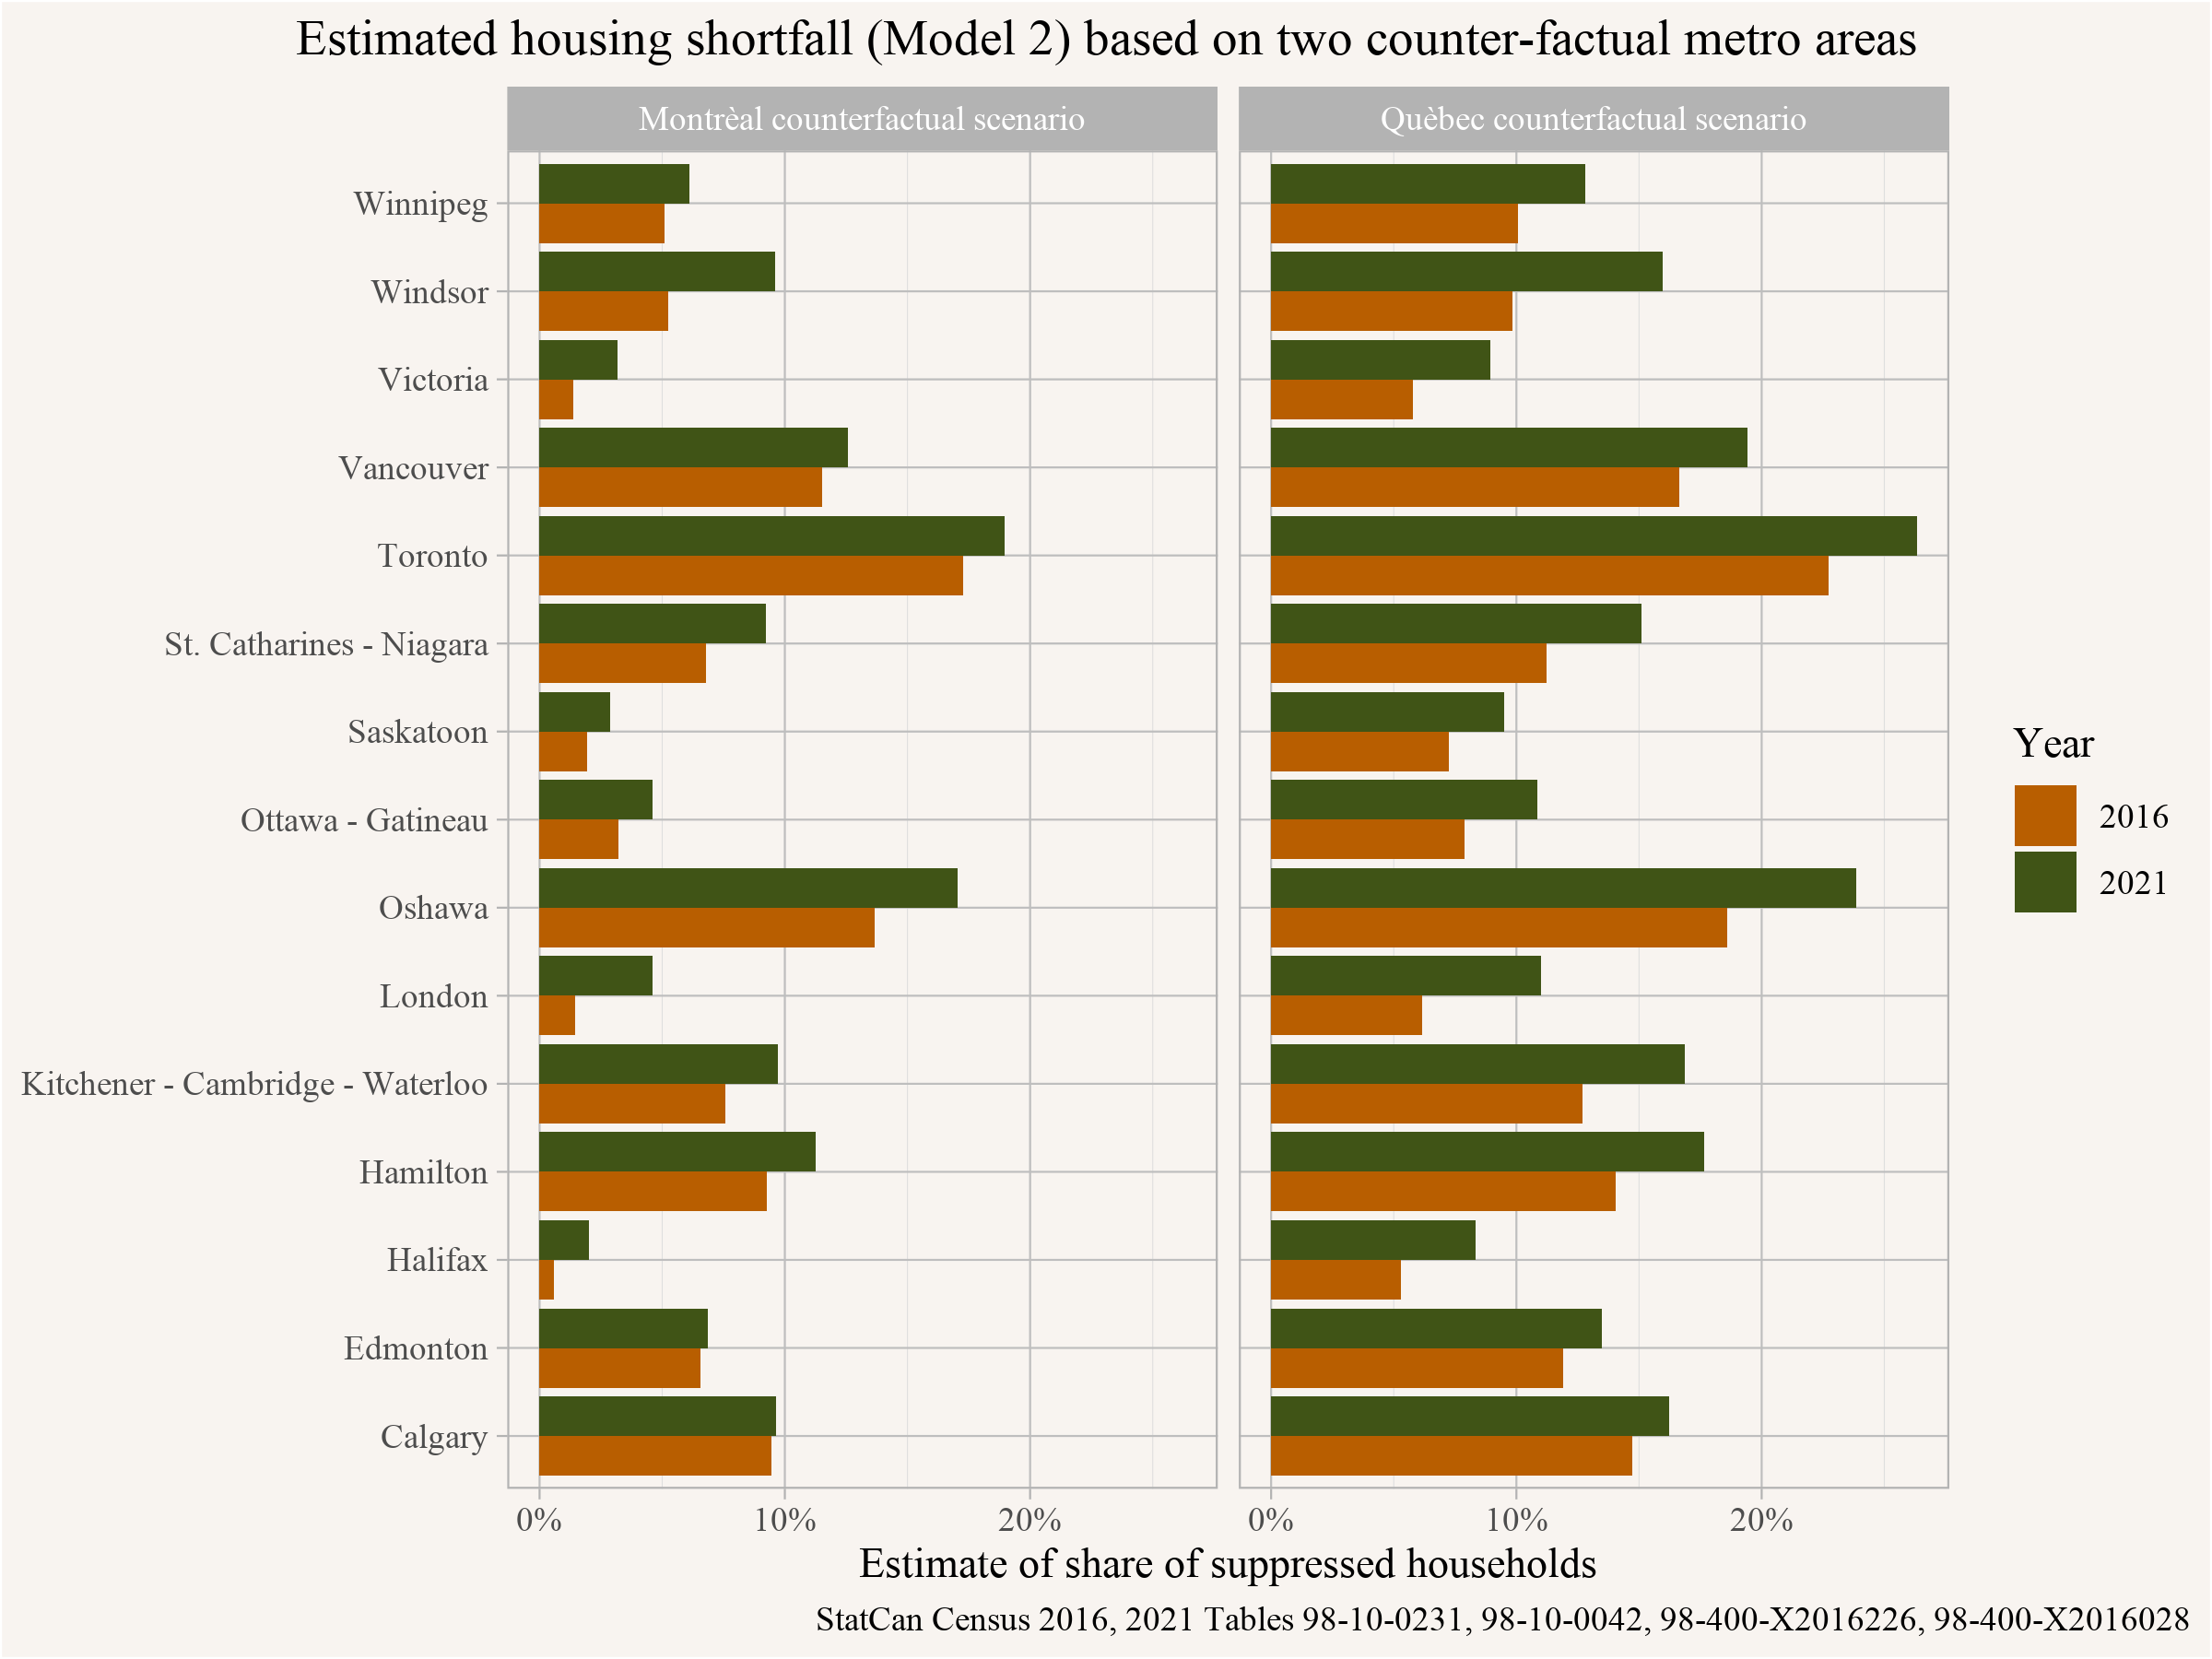
Using either Montréal or Québec as the standard, we see that our selected metro areas would all have to increase their dwelling stock dramatically to make space for households to be able to form in line with our counter-factual scenarios. The estimated shortage is particularly pronounced if we take Québec City as the counter-factual. Toronto tops the list with a housing shortfall of around 20% of it’s existing dwelling stock.
Importantly, this shortfall estimate doesn’t account for migration. For example, this shortfall only accounts for the population that already lives in Toronto. If Toronto were to add housing it would likely pull in people that have been pushed out of the metro area to neighbouring areas like Oshawa or Hamilton, easing pressures there but in turn dampening the effect of the added housing in Toronto on boosting household maintainership rates.
Lastly, we can translate this into hard numbers of how many concealed households we have in each metro area. Put slightly differently, we can ask how many more housing units we would need to allow the existing population to form households at the same rates as in our counter-factual metro areas of Montréal or Québec.
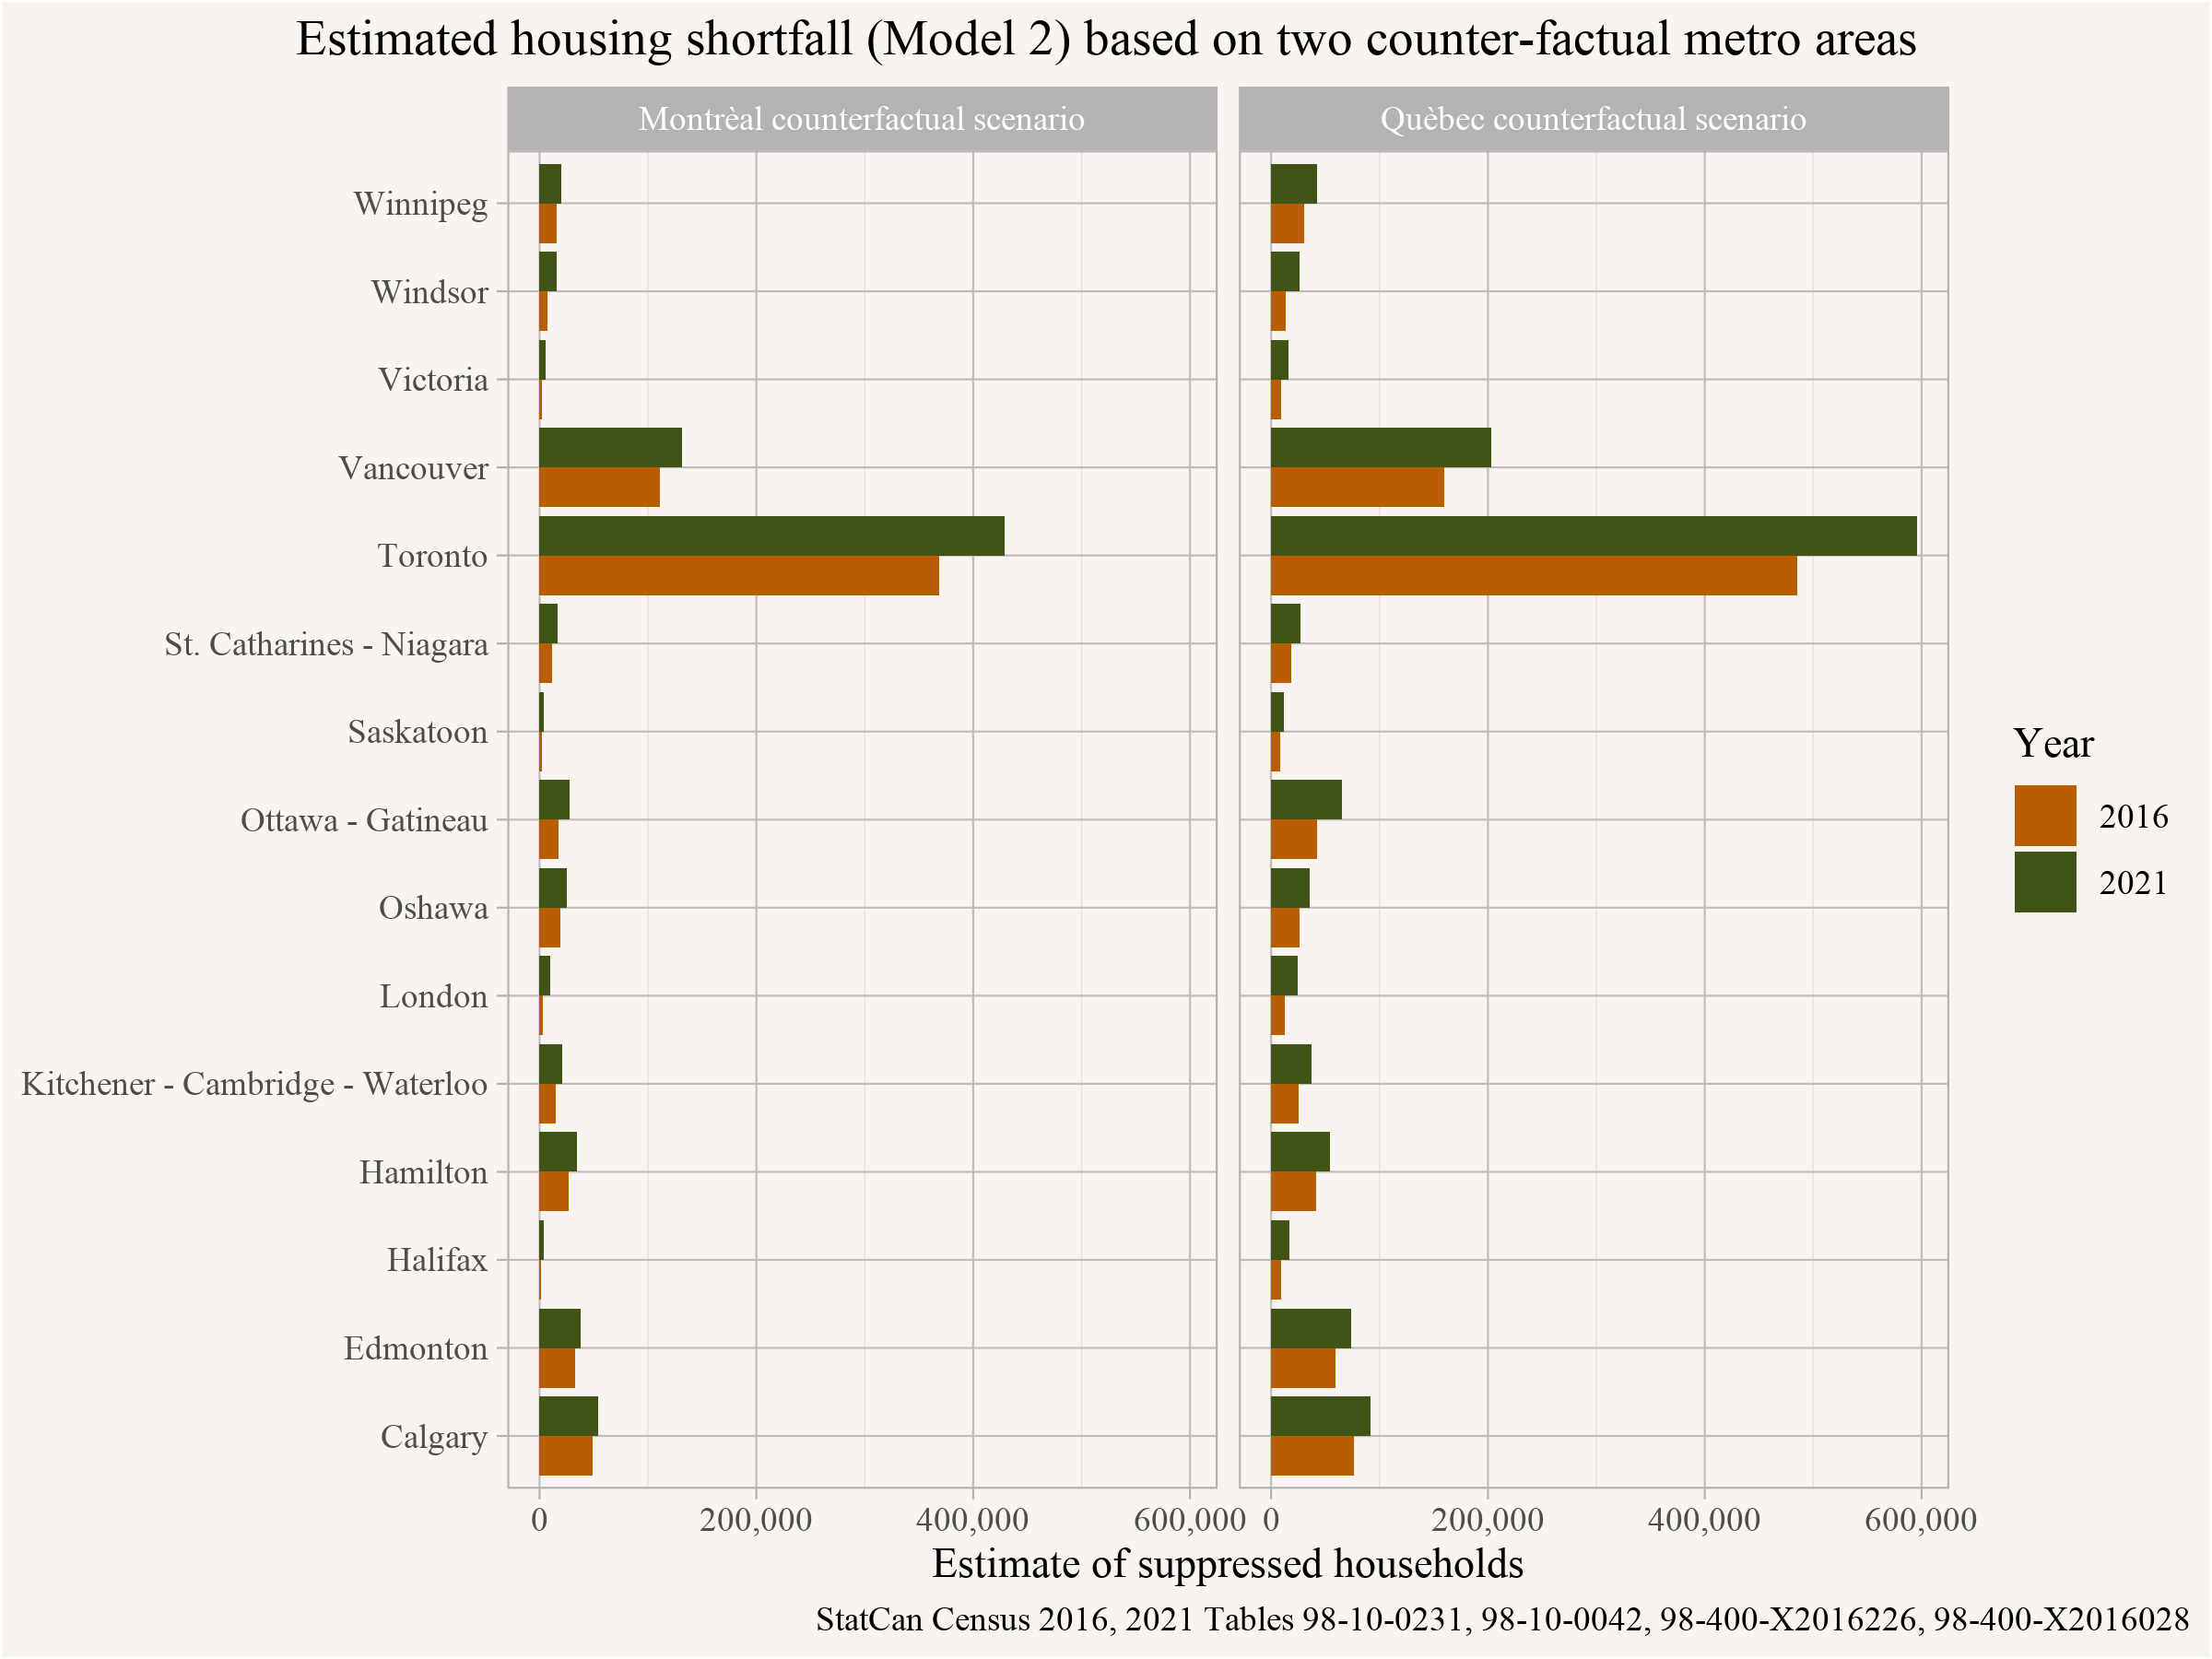
This puts a rough estimate on the number of suppressed households, or alternatively the number of additional dwellings needed to bring household formation rates up to counter-factual levels. The number for Metro Toronto is staggering. Between the 1970s, when Toronto had similar household maintainer rates as Montréal, and 2021, Metro Toronto has accumulated a shortage of over 400k homes, and that’s still not accounting for migration effects or moving vacancies.
For Metro Vancouver this pegs the number of suppressed households at somewhere between 130k and 200k, depending on the counter-factual scenario. Again, not accounting for migration or moving vacancies. That corresponds to between 6 and 10 years worth of recent completions, not accounting for demolitions, just to remove the current shortfall, while holding current population constant (narrator voice: it will not be held constant).
Comparison Numbers
The English Housing Survey measures ‘concealed households’ directly, something that would be great to have in Canada too as part of the Canadian Housing Survey. In England the share of ‘concealed households’ came out at 7% in their 2018-2019 survey. Our Model 2 comes out with between 7% and 13% of concealed households for Canada overall, depending on the counter-factual scenario. Having a direct measurement to benchmark these estimates against would be extremely helpful.
Another useful comparison is to see how these estimates stack up against CMHC supply shortfall estimates. The CMHC estimates were done very differently from our Montréal Method. CMHC relied on prices to fit a (modified) DiPasquale-Wheaton model to data from Canadian provinces and asked what it would take to get prices to specified levels. The CMHC report did not break out the “current” (2019) shortfall, but only the projected 2030 shortfall under a business-as-usual scenario. But the presentation on this work at this year’s CEA conference did break out the 2019 “current” shortfall, which can provide a useful benchmark for us.
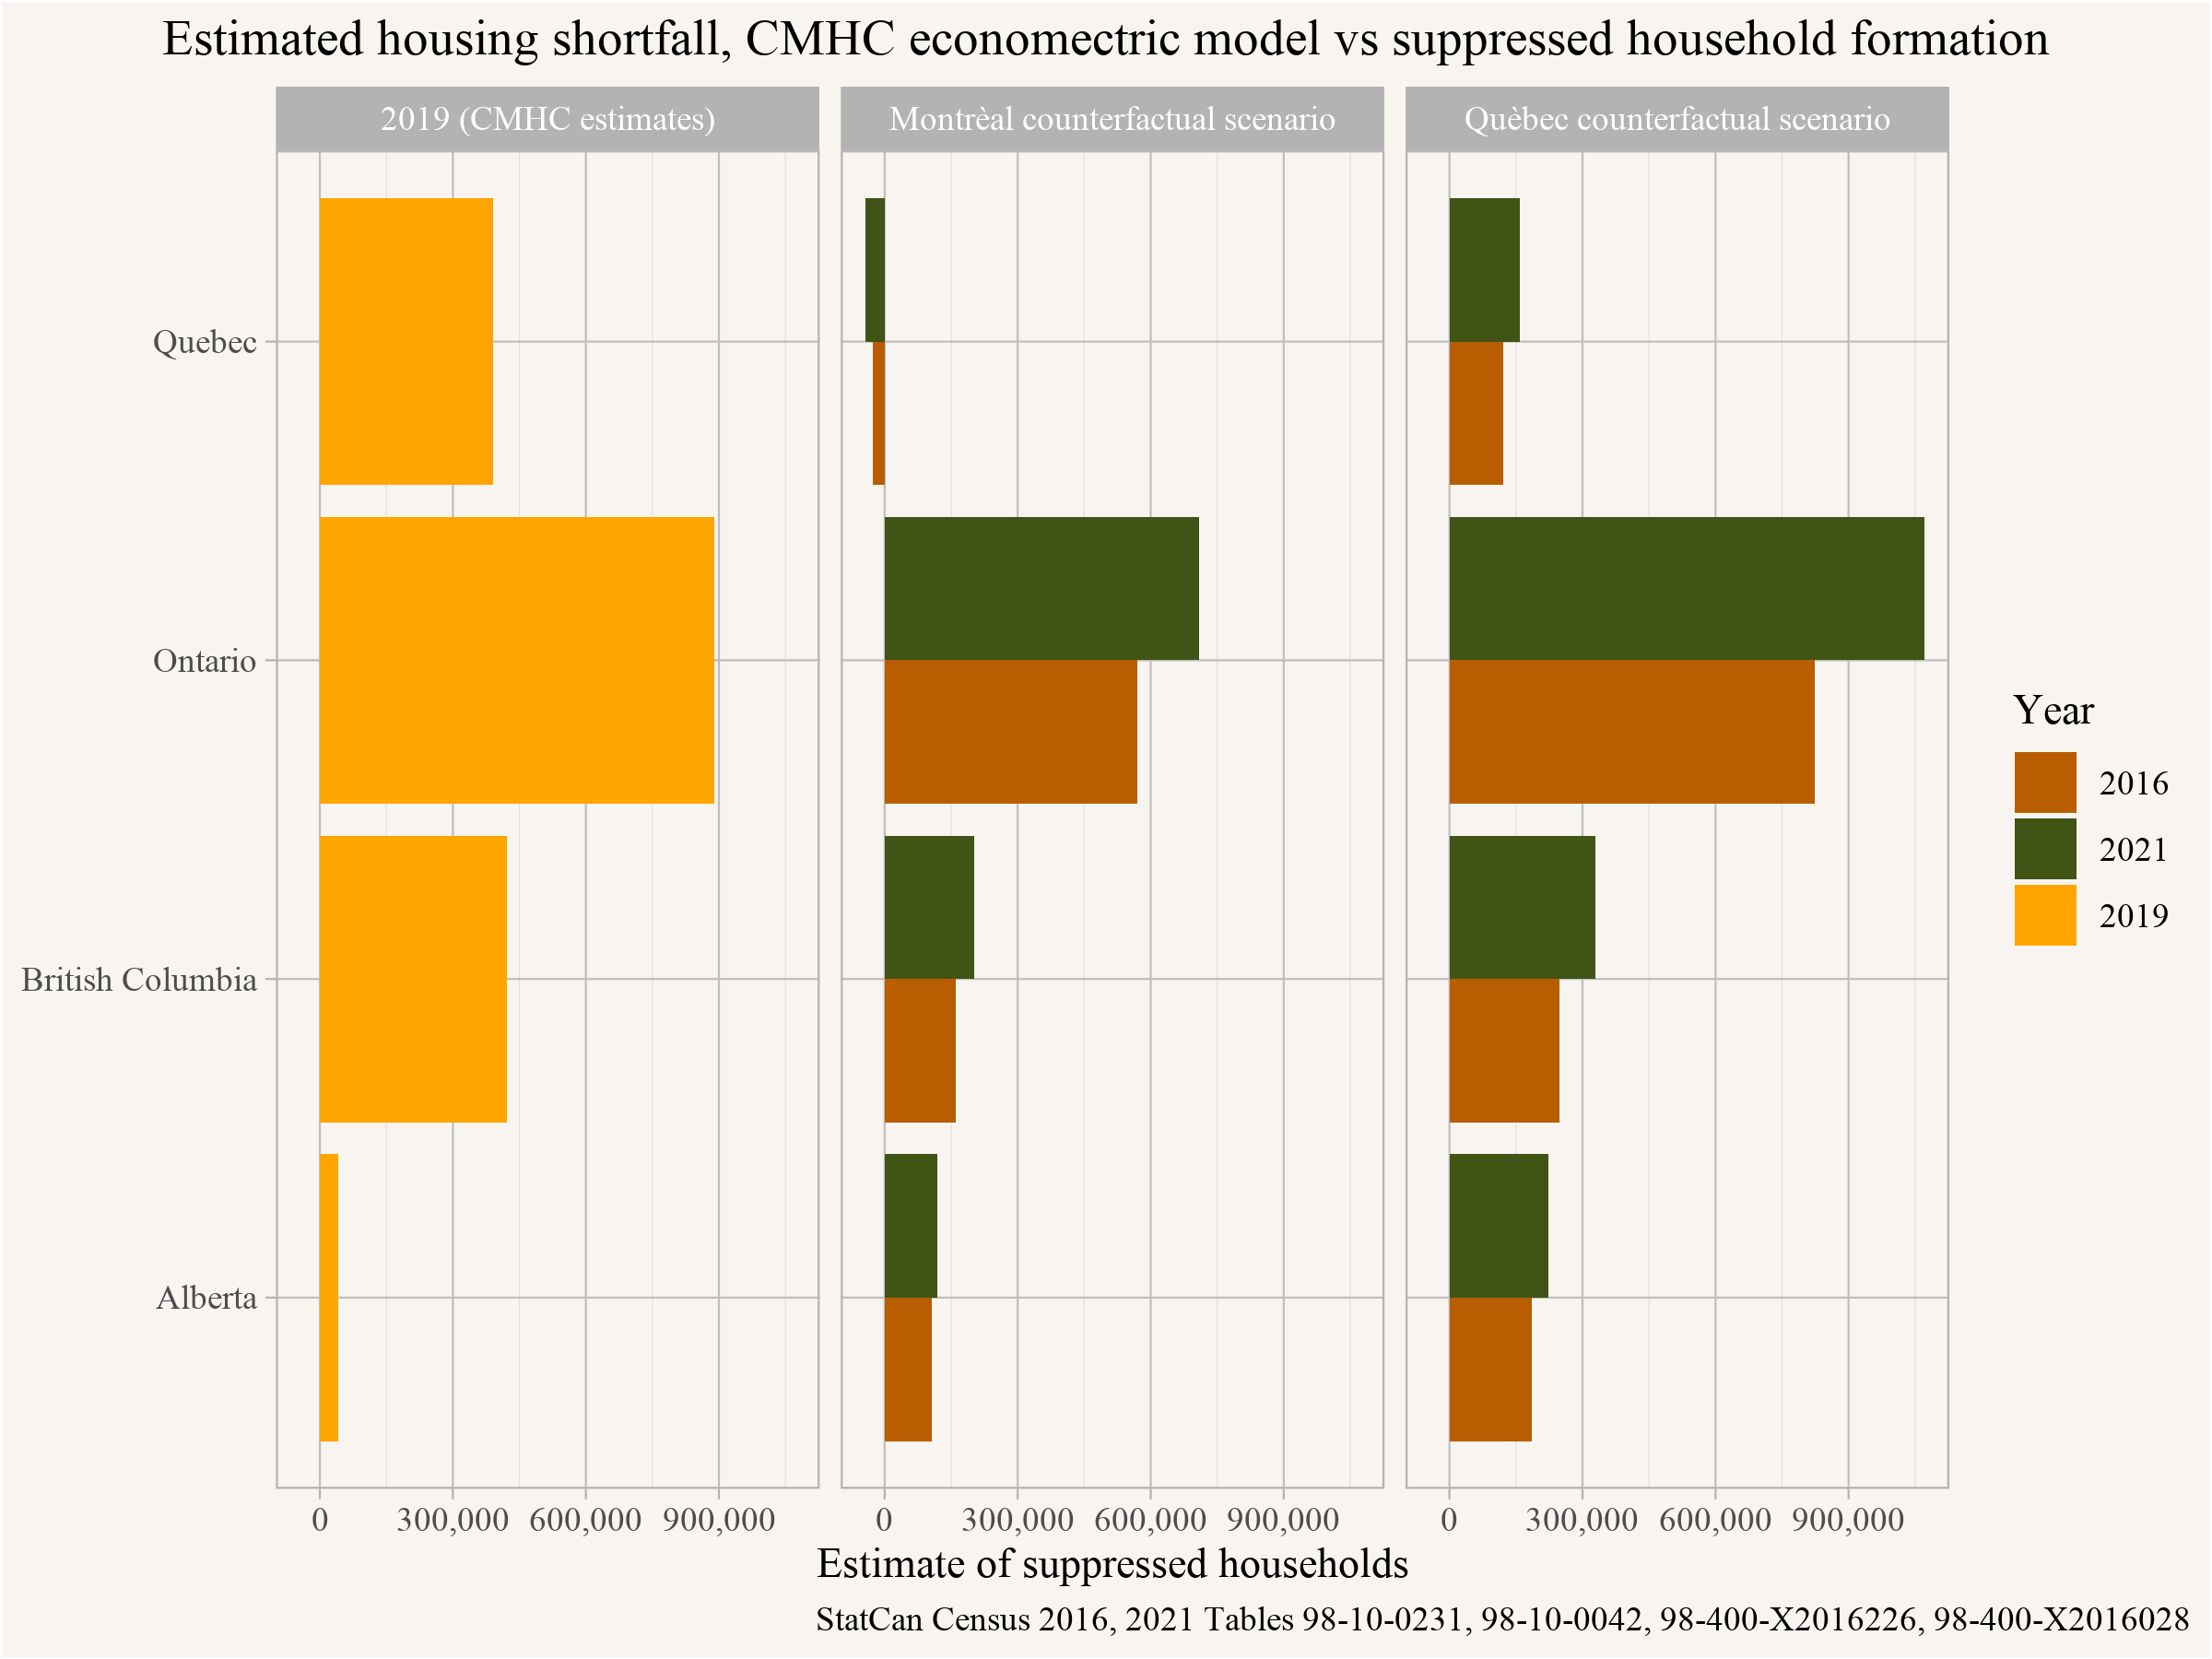
The CMHC housing shortfall estimates for Ontario are roughly consistent with our more aggressive Québec counter-factual scenario. But for the other provinces they differ significantly; they are lower for Alberta and higher in Quebec and British Columbia than our suppressed household estimates.
One reason for this discrepancy is migration, which, to first order, is implicitly included in the CMHC model but is completely missing from our demographics-based estimates. In particular, it is very plausible that in-migration into British Columbia from other parts of Canada would increase significantly if prices were lower. And a good portion of this increase might come from Alberta, easing the need for more housing there. On the other hand, single-region models like the one employed by CMHC might be double-counting demand when people get priced out of a region and buy or rent elsewhere. Some econometric models building on DiPasquale-Wheaton, like the models developed by Geoffry Meen, avoid this by modelling migration effects explicitly.
Apart from not accounting for migration pressures, our household suppressing estimates only look at households and not at how many dwelling units are needed. The number of dwelling units would always have to be larger than the number of households to account for moving vacancies, as well as increase the rental vacancy rate to a healthy level to allow freer household formation that is not constrained by landlord bargaining power.
Takeaway
Housing discussions often get caught up in overly simplistic mental models of how housing works. Here we start to explore just one process involving how housing works for distributing people into households. Thinking through the process enables us to estimate household suppression. This formulates one aspect of the consequences of housing scarcity in terms of demographics, and how it interferes with life trajectories.
Often calls for building more housing are justified or discredited by pointing to past population growth and population growth projections. But this misses the central endogeneity problem. The number of dwelling units constitute a hard cap on the number of households that can form. When housing is scarce, both population growth and household formation slow down. A housing provision model that ignores suppressed household formation and migration becomes a self-fulfilling prophecy, and systematically enshrines housing scarcity.
While prices and rents are the best indicator of housing scarcity, there are those who doubt that prices and rents are related to scarcity, despite ample evidence to the contrary. This points toward the value of exhibiting the effects of housing scarcity directly on demographics and people’s life trajectories, without making any reference to prices. Moreover, many people seem to have higher sympathy for the welfare of existing residents as opposed to newcomers, and might be more willing to understand the detrimental effects of housing scarcity when phrased in terms of the existing population, rather than more abstractly thought prices and rents, or migration pressures. We have made a similar attempt to highlight the people leaving the region instead of looking at net population flows.
At the individual level, the decisions of individuals to form or not form households, or to move into or out of a region, are generally driven by prices and rents. And the ability and willingness to pay determines the outcome. When added up, these individual decisions set the market price and rent of housing. Prices are information aggregators, and the shortcut to all of this is to simply look at prices and rents as the main indicator of housing scarcity, which is what econometric models like the ones in the recent CMHC report on Canada’s Housing Supply Shortage do. So maybe, with this additional demographic context, we can pay more attention to those econometric models and build more housing. We can do this both for the population that’s already here so young people can form households and families, and also to make room for the people that left or that did not come, and for those intending to come in the future, those not wanting to leave in the future, and those wanting and needing to form new households in the future.
As usual, the code for this post is available on GitHub.
Reproducibility receipt
## [1] "2022-10-03 15:42:31 PDT"## Local: master /Users/jens/Documents/R/mountaindoodles
## Remote: master @ origin (https://github.com/mountainMath/doodles.git)
## Head: [47fc9cc] 2022-10-01: fix author/title mixup## R version 4.2.1 (2022-06-23)
## Platform: aarch64-apple-darwin20 (64-bit)
## Running under: macOS Monterey 12.6
##
## Matrix products: default
## BLAS: /Library/Frameworks/R.framework/Versions/4.2-arm64/Resources/lib/libRblas.0.dylib
## LAPACK: /Library/Frameworks/R.framework/Versions/4.2-arm64/Resources/lib/libRlapack.dylib
##
## locale:
## [1] en_CA.UTF-8/en_CA.UTF-8/en_CA.UTF-8/C/en_CA.UTF-8/en_CA.UTF-8
##
## attached base packages:
## [1] stats graphics grDevices utils datasets methods base
##
## other attached packages:
## [1] mountainmathHelpers_0.1.4 statcanXtabs_0.1.2
## [3] forcats_0.5.1 stringr_1.4.1
## [5] dplyr_1.0.9 purrr_0.3.4
## [7] readr_2.1.2 tidyr_1.2.0
## [9] tibble_3.1.8 ggplot2_3.3.6
## [11] tidyverse_1.3.2 cancensus_0.5.3
## [13] cansim_0.3.12
##
## loaded via a namespace (and not attached):
## [1] lubridate_1.8.0 assertthat_0.2.1 digest_0.6.29
## [4] utf8_1.2.2 R6_2.5.1 cellranger_1.1.0
## [7] backports_1.4.1 reprex_2.0.1 evaluate_0.15
## [10] httr_1.4.4 blogdown_1.10 pillar_1.8.1
## [13] rlang_1.0.5 googlesheets4_1.0.0 readxl_1.4.0
## [16] rstudioapi_0.14 jquerylib_0.1.4 sanzo_0.1.0
## [19] rmarkdown_2.14 googledrive_2.0.0 munsell_0.5.0
## [22] broom_1.0.0 compiler_4.2.1 modelr_0.1.8
## [25] xfun_0.33 pkgconfig_2.0.3 htmltools_0.5.3
## [28] tidyselect_1.1.2 bookdown_0.27 fansi_1.0.3
## [31] crayon_1.5.1 tzdb_0.3.0 dbplyr_2.2.1
## [34] withr_2.5.0 grid_4.2.1 jsonlite_1.8.0
## [37] gtable_0.3.1 lifecycle_1.0.2 DBI_1.1.3
## [40] git2r_0.30.1 magrittr_2.0.3 scales_1.2.1
## [43] cli_3.4.0 stringi_1.7.8 cachem_1.0.6
## [46] fs_1.5.2 xml2_1.3.3 bslib_0.4.0
## [49] ellipsis_0.3.2 generics_0.1.3 vctrs_0.4.1
## [52] tools_4.2.1 glue_1.6.2 hms_1.1.2
## [55] fastmap_1.1.0 yaml_2.3.5 colorspace_2.0-3
## [58] gargle_1.2.0 rvest_1.0.3 knitr_1.39
## [61] haven_2.5.0 sass_0.4.2Reuse
Citation
@misc{still-short-suppressed-households-in-2021.2022,
  author = {{von Bergmann}, Jens and Lauster, Nathan},
  title = {Still {Short:} {Suppressed} {Households} in 2021},
  date = {2022-10-03},
  url = {https://doodles.mountainmath.ca/posts/2022-10-03-still-short-suppressed-households-in-2021/},
  langid = {en}
}
