(Joint with Nathan Lauster and cross-posted at HomeFreeSociology)
So we recently had an election in the City of Vancouver. Citizens elected a new mayor, ten council members, park board and school board, giving a majority to the centre-right leaning new ABC (A Better City) Party candidates for each (full results posted by the City). There are a variety of narratives out there about how it all went down. Here we’re interested in examining a couple of them in further detail using the recently released individual ballot data (all ballots remain anonymous, of course). Of note, the mayoral vote is straight-forward, each voter got to vote for one mayoral candidate. The council votes are more interesting. There voters could choose up to 10 candidates. For this post we will focus on council votes, but we’ll return to examining how they relate to mayoral votes.
In terms of relevant narratives about the election, two stand out as worth examining with ballot data: the election came down to organizing and/or the election came down to positioning.
First, let’s talk organizing. Here we can start with it’s relative absence in binding together the diverse parties occupying the centre-left. Left-leaning parties, including Forward Vancouver, OneCity, COPE, and the Greens, arguably competed at least as much with each other as they did with the centre-right. No single party has dominated since the collapse of the centre-left Vision party in 2018. That collapse, though largely driven by internal dynamics, was hastened by the Vancouver District Labour Council (VDLC) eschewing Vision in favour of attempting to organize a slate from the other three centre-left parties. In effect the VDLC brokered the number of candidates from each party they would support, and most parties kept to the bargain. The slate was somewhat successful in 2018, electing three Greens, one OneCity, and one COPE councillor together with the VDLC’s chosen independent mayoral candidate. The VDLC attempted the trick again this year, but only OneCity limited themselves to the number of candidates chosen for them, and new parties entered the field altogether running entirely too many candidates.
Meanwhile, the historical centre-right party, the Non-Partisan Association (NPA), also seemed on the verge of collapse after 2018. And collapse it did, after a takeover by far-right party activists drove out four out of its five sitting councillors. One started a new party (TEAM), largely devoted to opposing development and SkyTrain expansion, and ran as its mayoral candidate. The other three joined up with the NPA’s former mayoral candidate, who very narrowly lost in 2018, to start an entirely new party, staking a strong claim - with a lot of money behind it - to a generally pro-development and socially liberal centre-right. So there’s a rough re-cap. But just how did this give ABC an organizational advantage?
First off, ABC faced no constraints placed upon the size of their slate. So they were able to run with seven candidates: enough to hold a majority on council, without so many that votes were likely to be diluted. Arguably, seven candidates was the perfect size for “[vote plumping](https://www.langleyadvancetimes.com/opinion/editorial-to-plump-or-not-to-plump-your-vote/#” within a council of ten. True party supporters could vote for all of their candidates and no one else’s, avoiding lending support to any other parties and correspondingly boosting the weight of their favoured party. Not coincidentally, this was also the number of candidates Vision generally ran with during the height of its power.
Did voters really follow this strategy? To start out we take a look at the distribution of the number of votes cast on council ballots.
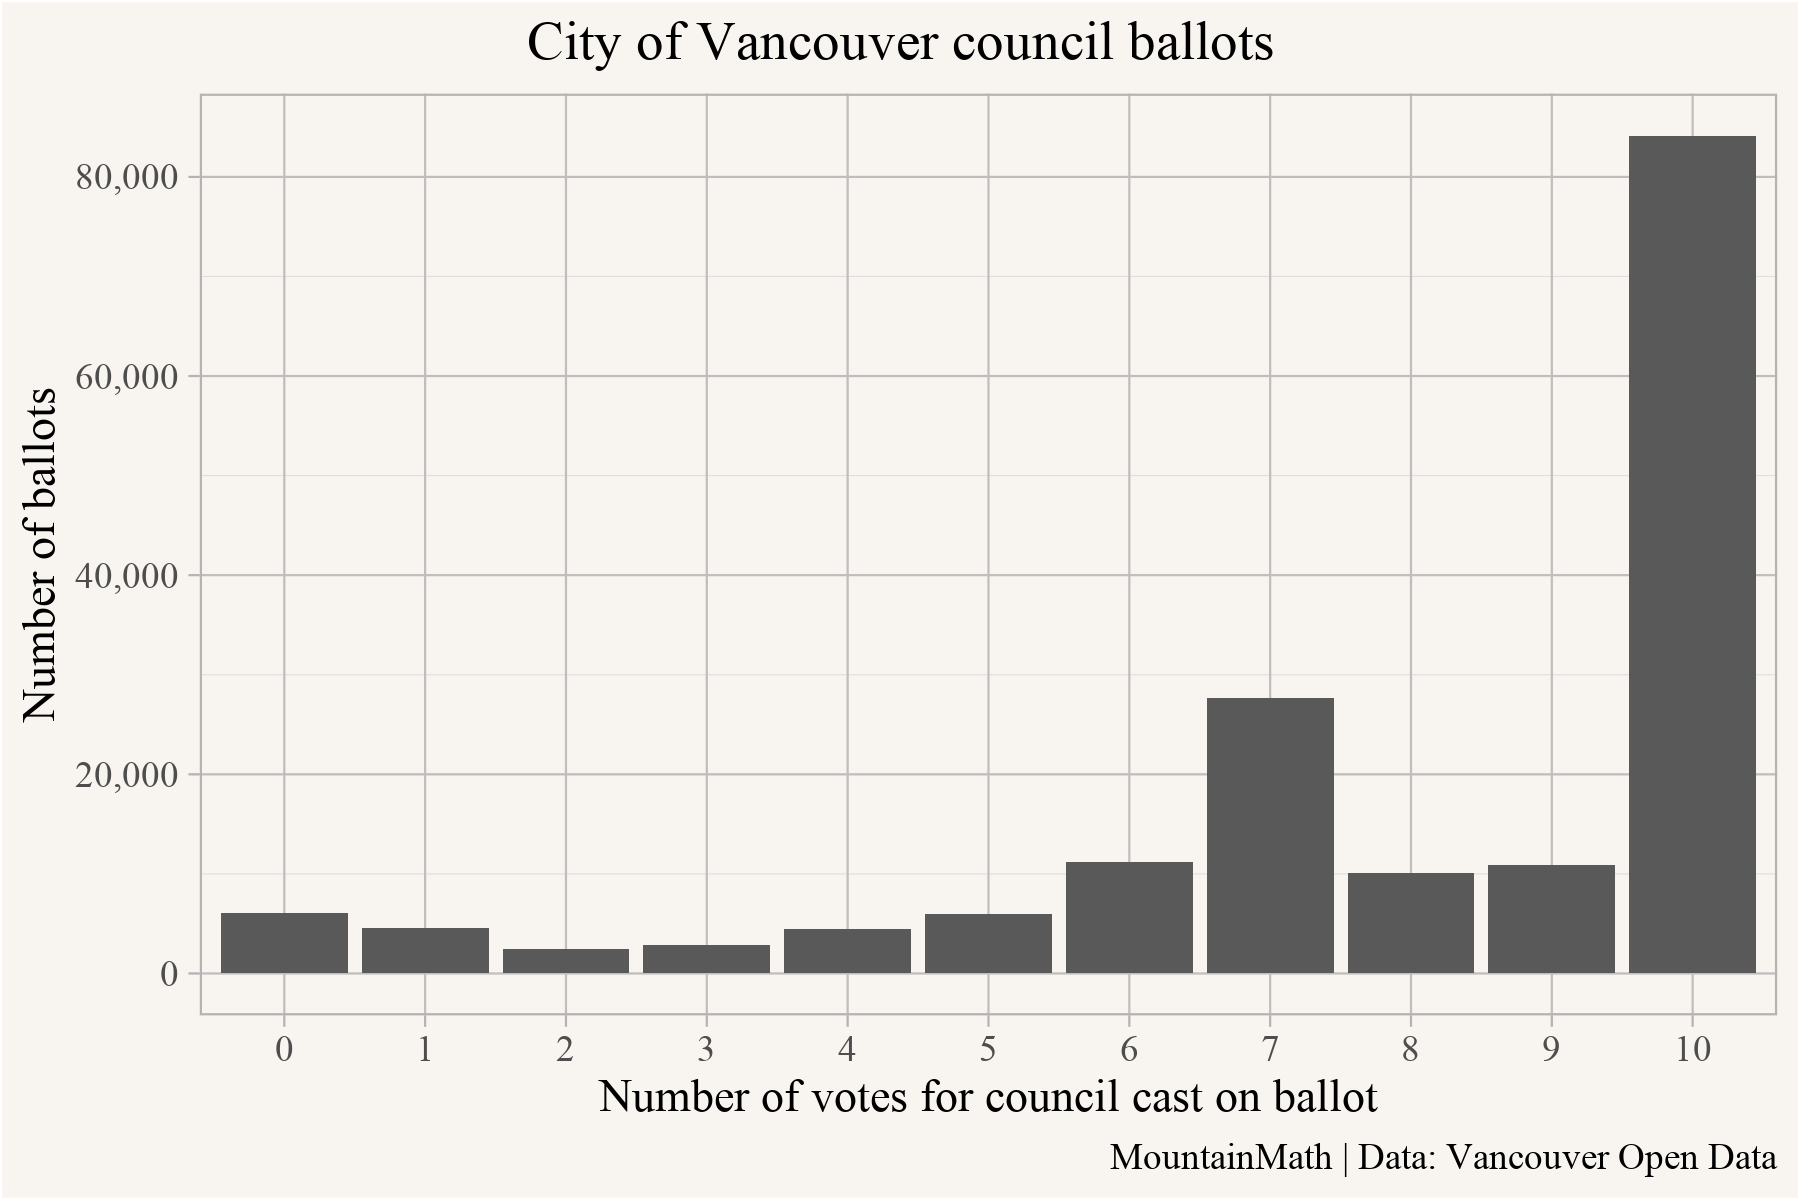
As one would expect, the most popular choice was to vote for 10 candidates, but just over half of the voters voted for fewer than 10 candidates. What’s curious is that the second most popular option was people voting for 7 candidates.
Interesting! Let’s follow-up by checking how many ballots were straight-party tickets with nobody else on the ballot? So these are ballots with fewer than the maximum of 10 votes where some votes were intentionally wasted, “plumping” up the relative power of the votes that remained.
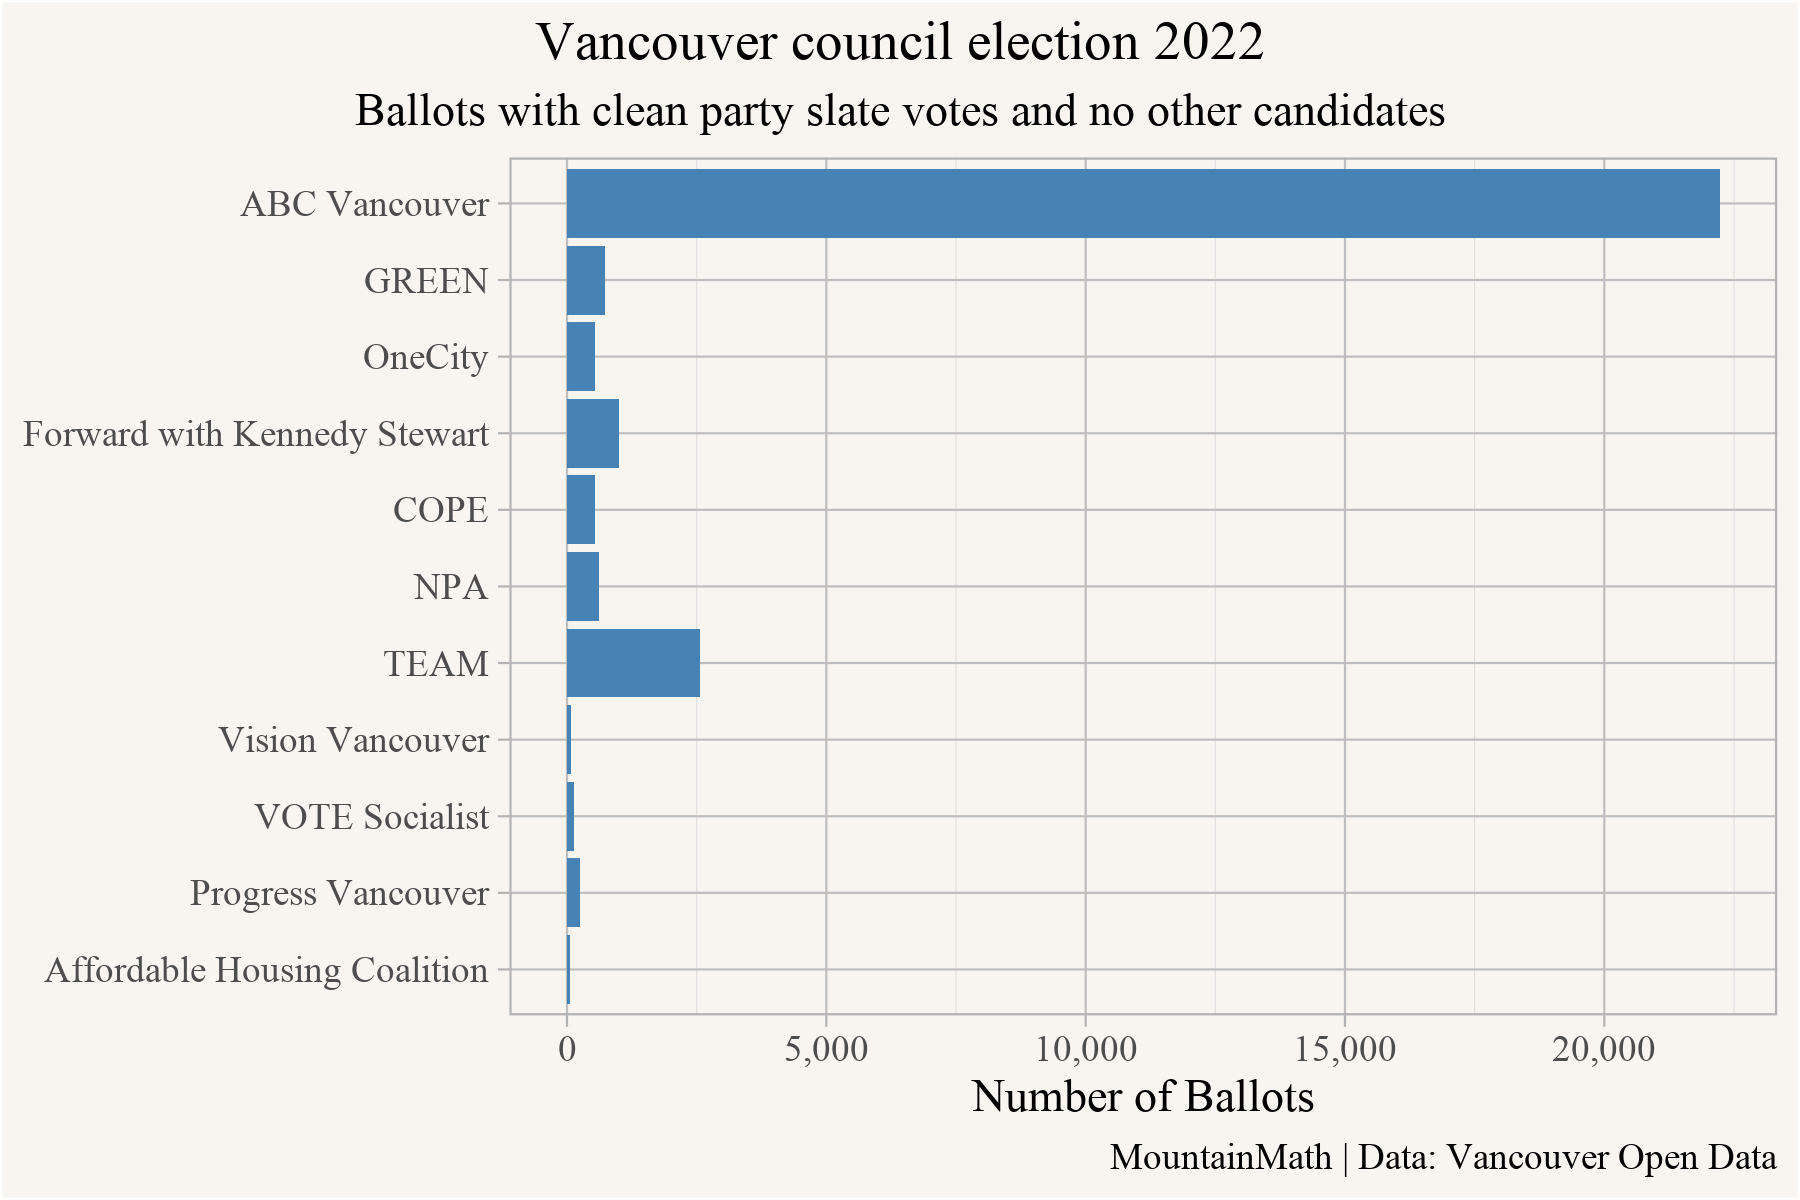
We see that in particular ABC voters made use of this strategy, relating back to the top where we saw a high number of people casting exactly seven votes. The majority of these were pure ABC slate ballots. TEAM voters, looking at a similarly sized slate, also made use of this strategy, there just weren’t nearly enough of them to matter. TEAM’s poor showing emphasizes a lesson worth teaching over and over again: despite what we see at public hearings on rezoning applications, anti-housing politics might be well-organized, but they really aren’t very popular.
Now let’s shift our analysis slightly. Let’s look at ballots where a full party slate got voted in, but also contains some other votes. These are full party-line ballots, but not plumped by strategic avoidance of voting for anyone outside the party.
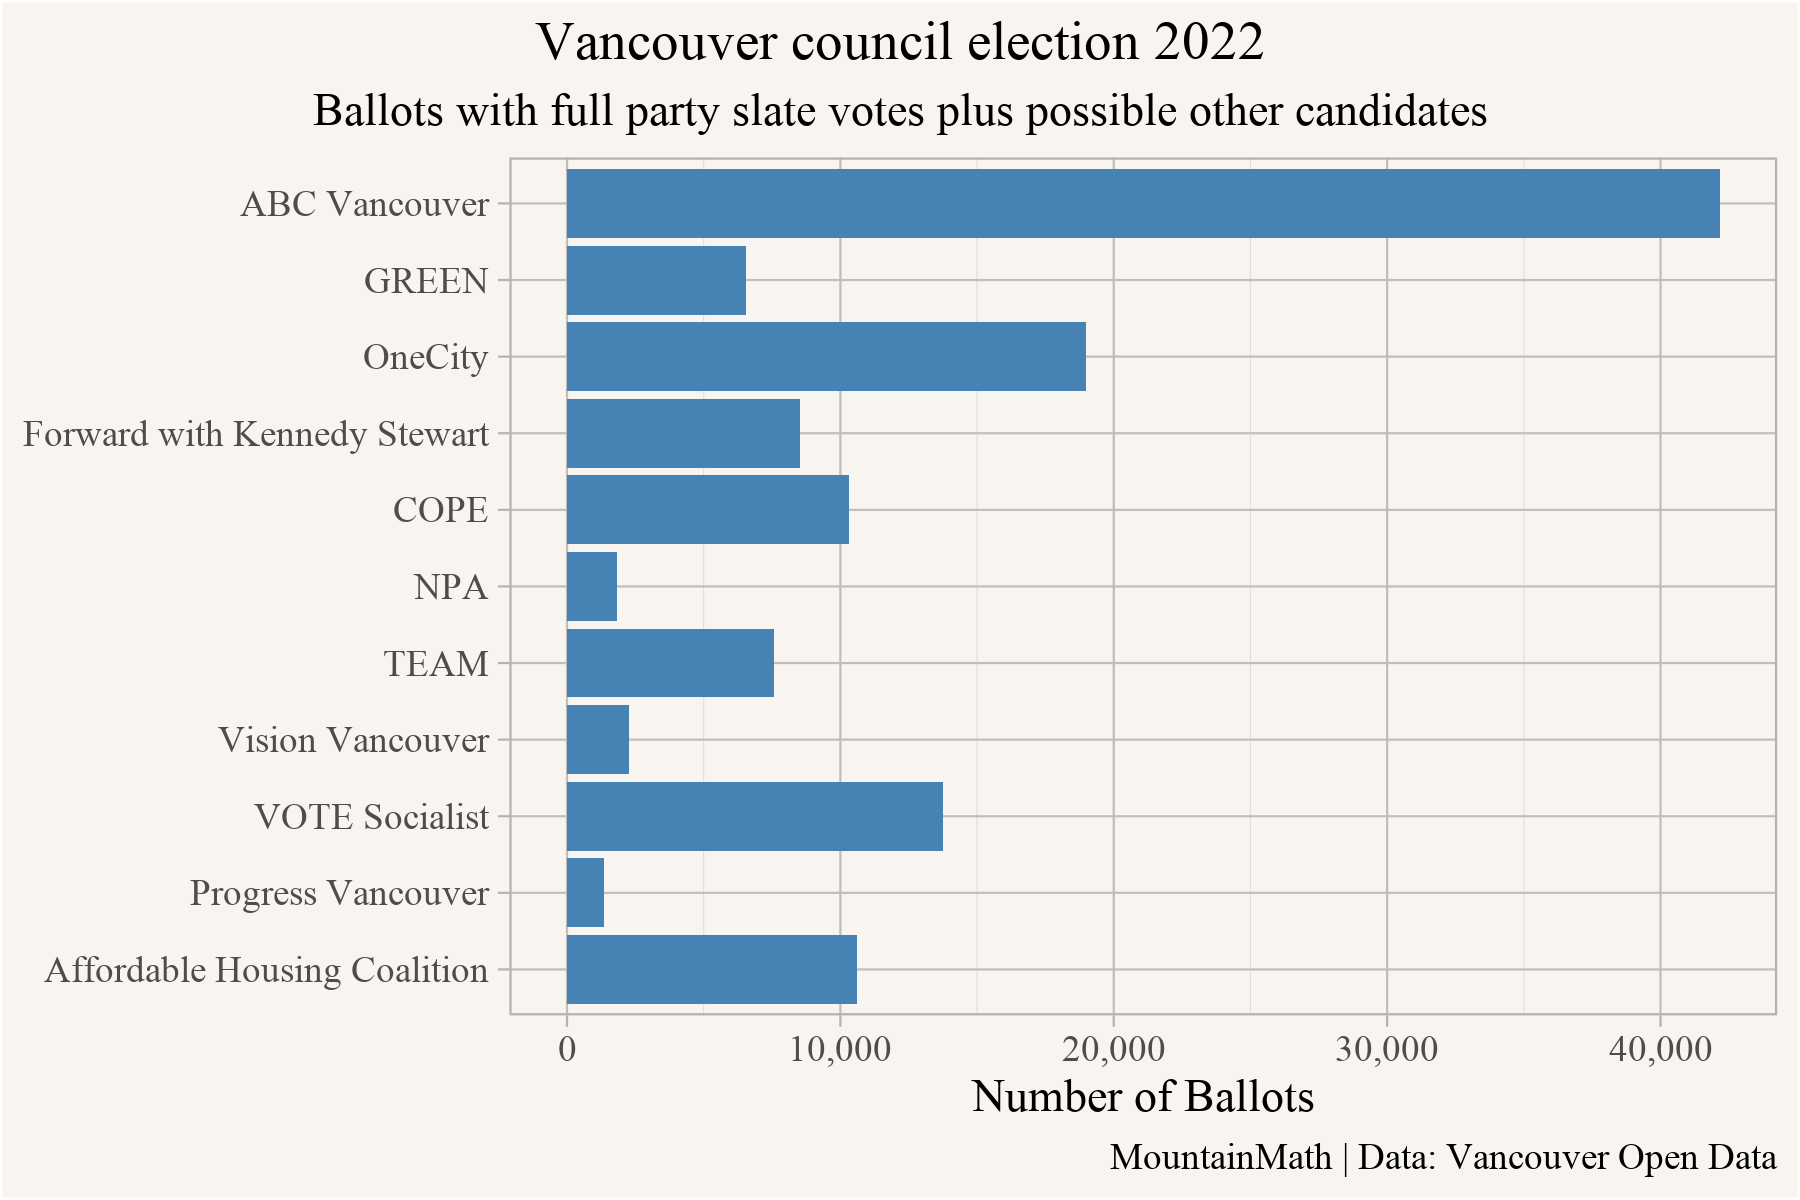
ABC still shows strongly with 25% of voters voting for all seven ABC council candidates. Given that the lowest vote share of all elected councillors was lower at 18%, just these party slate ballots were enough to guarantee all seven ABC got elected. But we also see some of the smaller Left of Centre parties emerging. In particular, OneCity partisans really, really liked all four of the OneCity candidates. They just also voted for a bunch of other candidates to fill out their rosters, perhaps inadvertently reducing the overall effect of their support. (Vote Socialist also had a strong showing, but they only had a single candidate running for Council).
Of note, this graph also counts some ballots twice. For example it is possible to vote the entire Forward and OneCity slates on a single ballot, voting for all six Forward and all four OneCity candidates. This is one way to add up a full slate. Looking at the ballots, 2,269 people did exactly this, demonstrating some affinity between these parties.
Let’s look at some other ways to demonstrate affinities. Now we’re shifting from sheer organizational advantages as determinants of election outcomes to thinking more about how issues and positioning might’ve tied different parties together or left them competing with one another.
Correlation and voting blocks
A simple way to try and understand voting patterns on council votes is to look at how votes for different candidates on each ballot correlated.
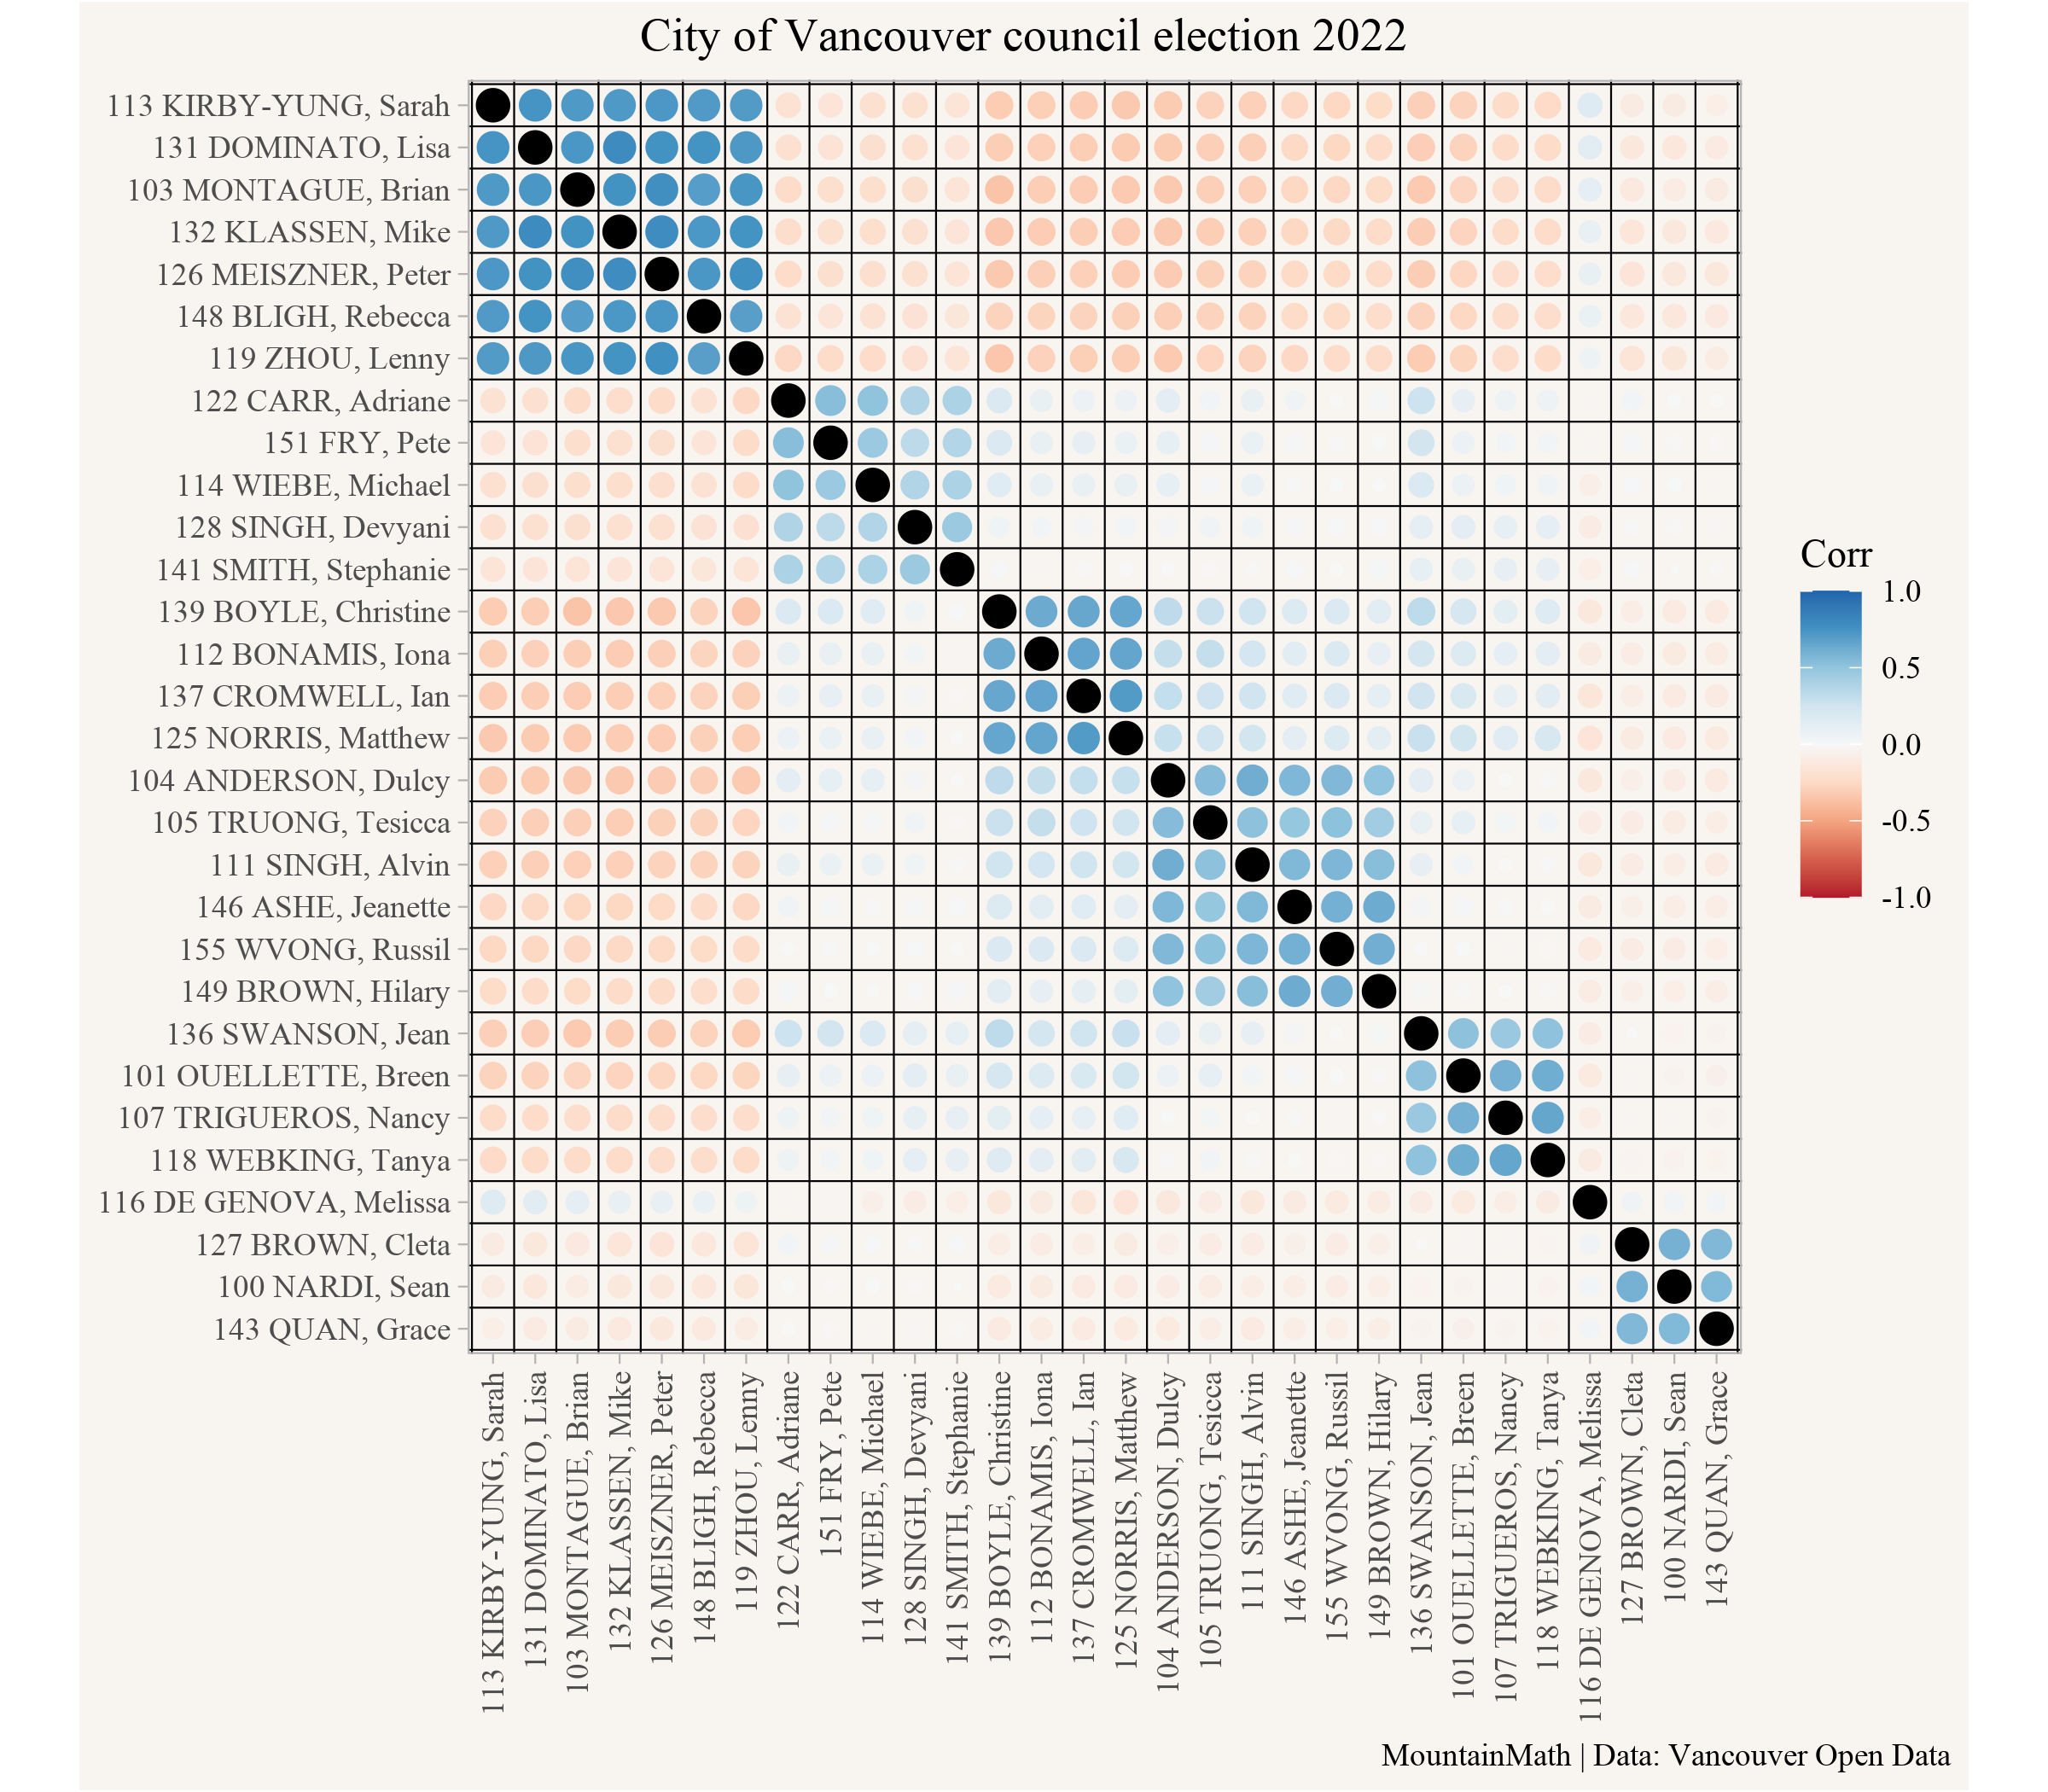
To keep things manageable we weaned down the list of 59 council candidates to the top 30 vote-getters, ordered by party and number of votes the candidates got. In the correlation plot we can immediately identify major parties, visible as blocks with high cross-correlation around the diagonal. Parties really work as organizers for voters in Vancouver’s at-large council elections (as opposed to the ward systems common across other big Canadian cities).
The first block, picking up ABC support, shows the strongest cross-correlation with fairly strong negative correlation with all other candidates except the lone NPA candidate that made the top 30 (and remember that ABC split off from the increasing dysfunction of the NPA). This indicates high party discipline for ABC voters, despite some residual brand loyalty to the NPA, and possibly some bleed over for the noted police affiliations of both parties.
The next four party blocks cover the GREENs, OneCity, Forward, and COPE, with weakly positive or neutral correlations to each other. The strongest connections can be found between OneCity and Forward, OneCity and COPE (OneCity first split from COPE in the 2014 election), and GREEN and COPE, suggesting some lingering divisions over the notable urbanism axis in left-wing Vancouver politics.
The next block is the single remaining incumbent NPA candidate, and the only one to make it into the top 30, showing weak but positive correlations with ABC.
Last in our top 30 candidates comes the TEAM block, who attempted to split off from the NPA by gathering all its NIMBY-est voters together with a who’s who of Vancouver’s assorted Neighbourhood Defenders. They exhibit neutral or weak anticorrelation with everyone else.
Clusters
Taking a slightly different tack to tracking how voters related parties to one another, we can run a cluster analysis on the individual ballot data. To keep things manageable we are only showing the results for the top 30 candidates. Given the ballot data, 5 clusters seems like a good choice that captures most of the variation in votes.
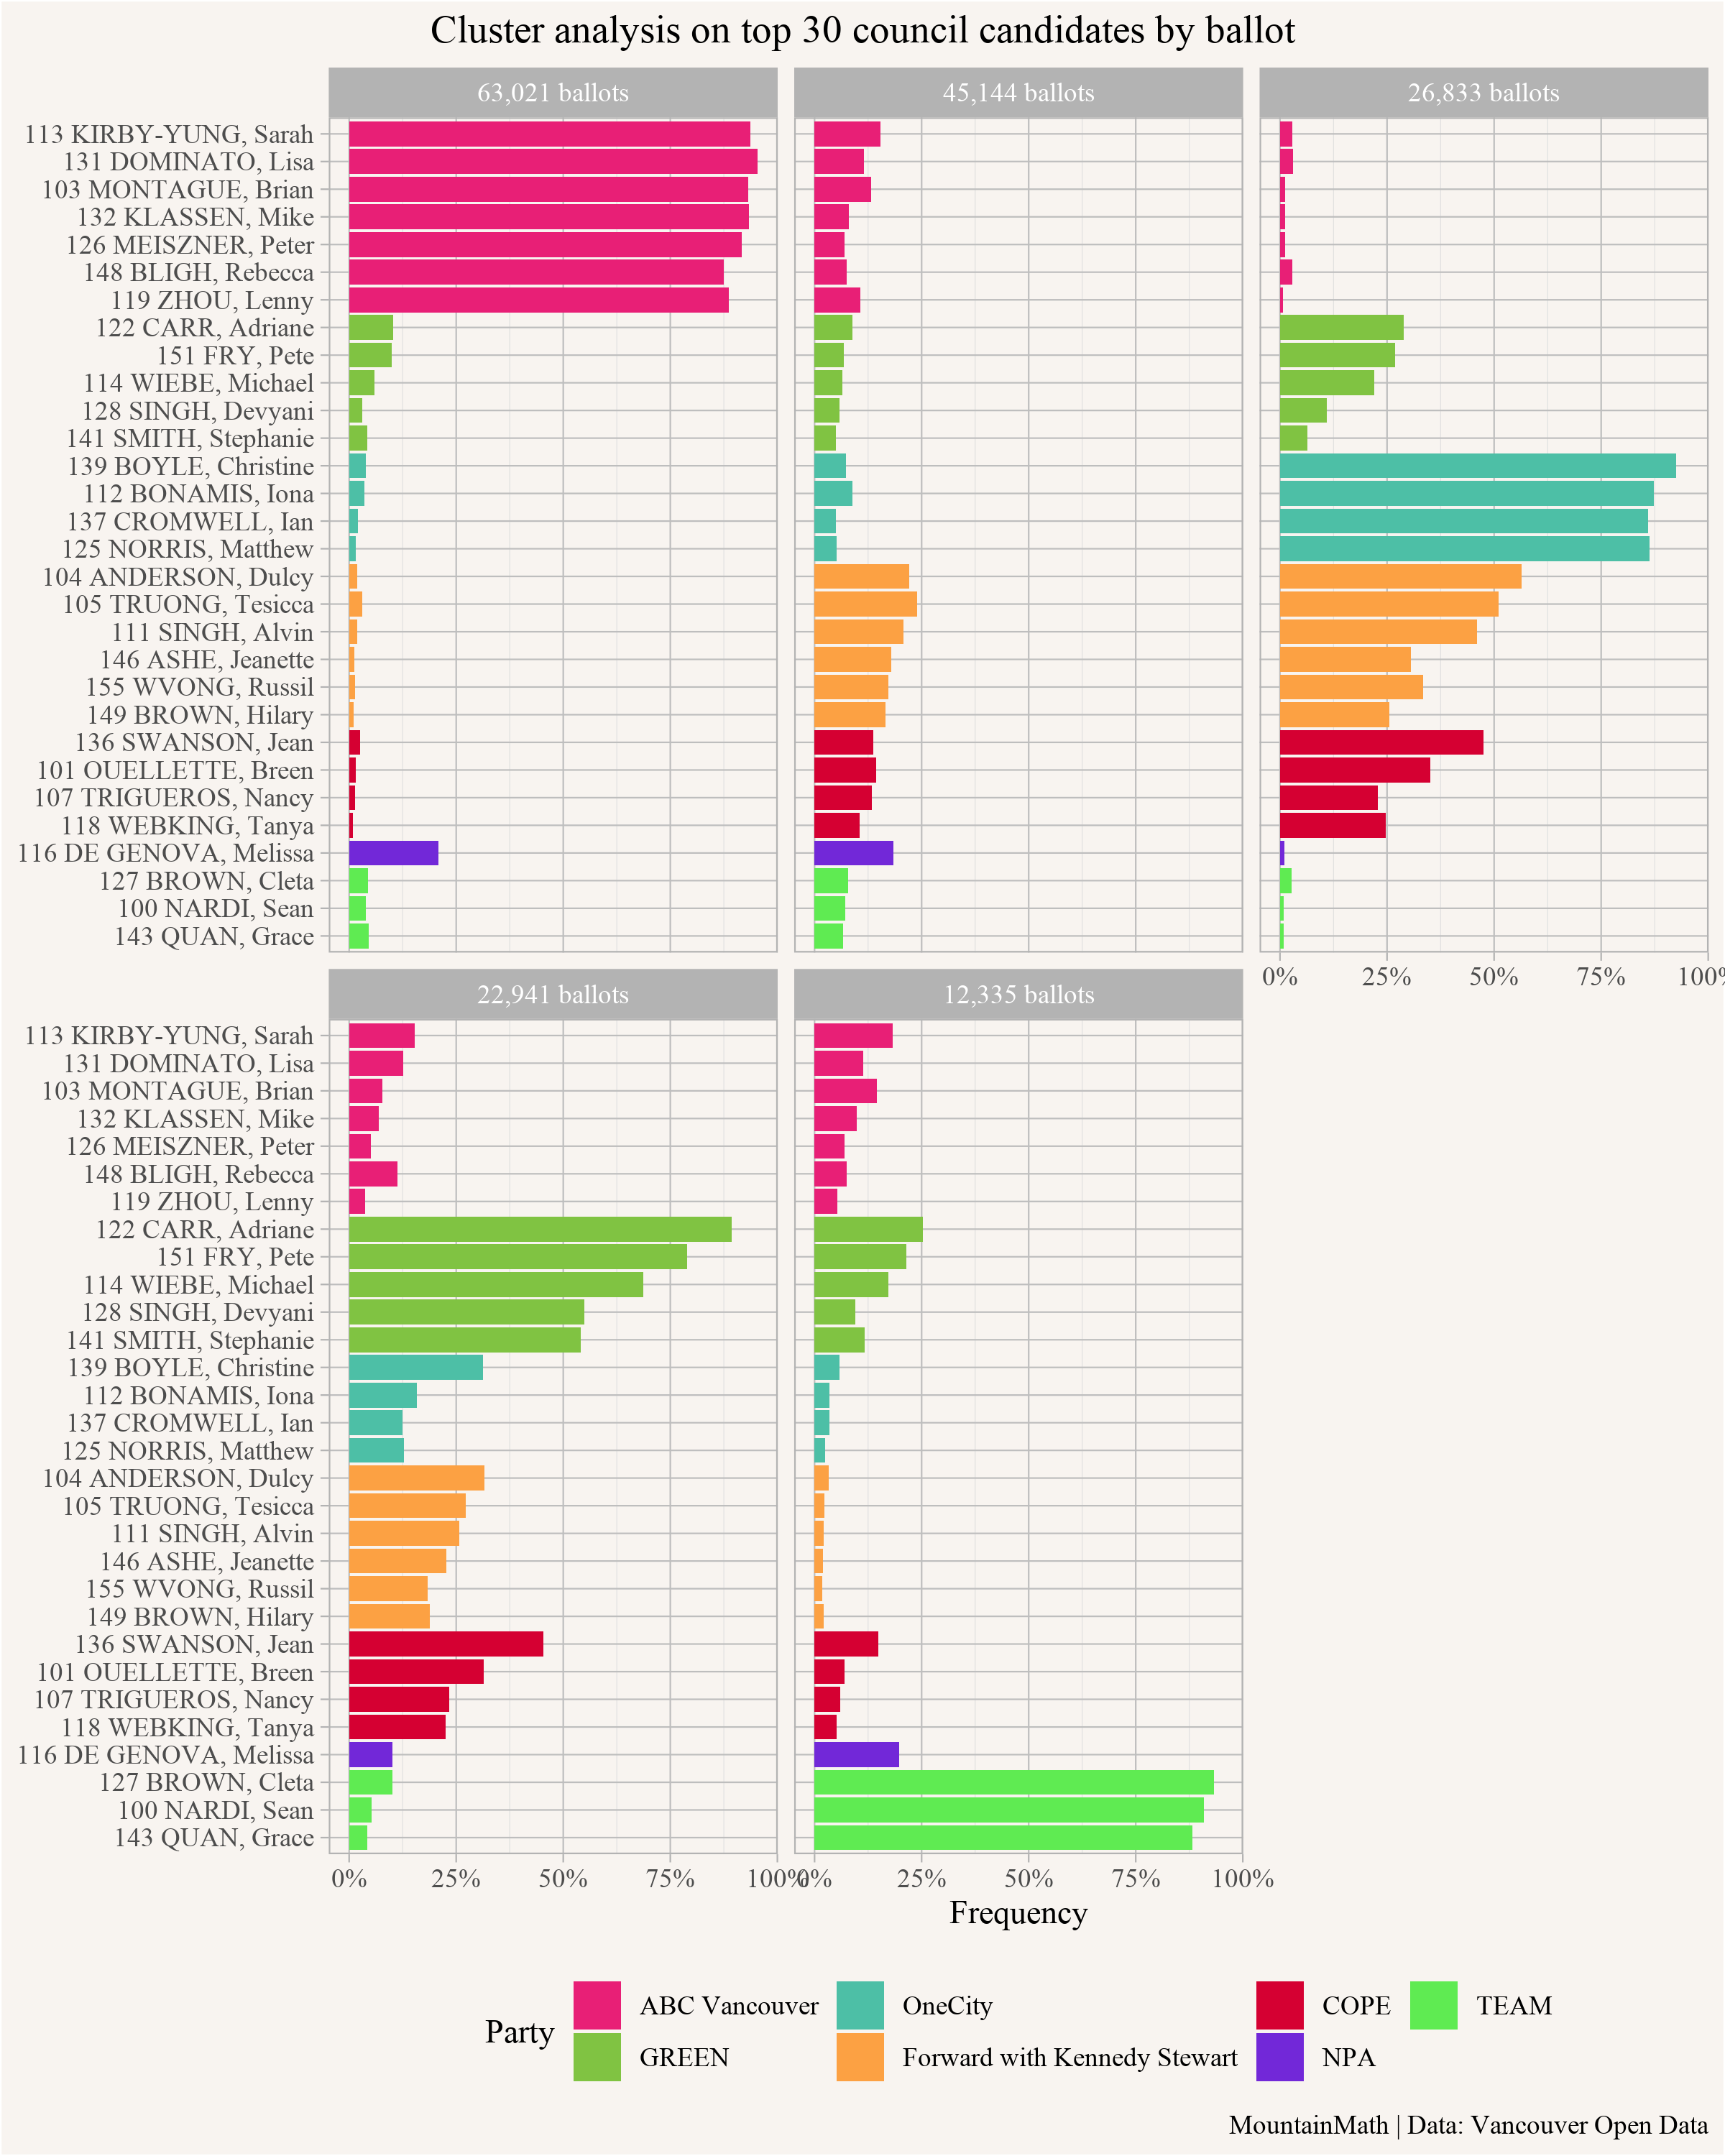
The results give a way to sumamrize voting behaviour. The first cluster, ordered by number of ballots in that cluster, is the ABC cluster. We see very high voting discipline, with some additional votes for Melissa De Genova, suggesting that there was a strong voter movement from the NPA.
The second cluster is quite scattered in their voting, demonstrating little in the way of party discipline. Many of these votes might simply reflect incumbency, with the strong showing by Forward Vancouver (a new party) gauging support for the mayor. But while Forward received the highest frequency of votes in this cluster, it’s definitely not JUST or even PRIMARILY a “Forward” cluster. Indeed, other clusters have higher frequency of votes for Forward candidates, but in those Forward appears to be a second or third choice, rather than the first. While Forward arguably ran with the right number of candidates (six), the data demonstrate the difficulty of organizing a party at the last possible minute. We see little evidence of anything approaching Forward party discipline, and the party ultimately failed to get any councillors elected (though they came very close to getting Dulcy Anderson over the line!)
The third cluster stands out as the most strongly left-of-centre cluster, and it’s clearly led by the party discipline of OneCity. But with only four candidates, OneCity voters spread their remaining six votes out across a real mix of Forward, COPE, and the GREENs. It wasn’t quite enough to see most OneCity’s new candidates elected, though they returned their incumbent, Christine Boyle, in part on the strength of her support in the next cluser, led by the GREENs.
The fourth candidate is the GREEN cluster. What can you say? The GREENs still have a viable party, but their supporters (and to some extent their councillors) remain all over the map. They liked Jean Swanson’s populist antics on council, but it wasn’t enough to return her to chambers, and the same went for the Forward slate, which had relatively broad low-level support from GREEN voters, but not enough. By contrast, GREEN voters also liked Christine Boyle from OneCity well enough for her to comfortably return. And GREEN voters also voted in a striking number of ABC councillors, and even a few TEAMsters. As a result, it’s still not quite clear what GREEN voters want, unless you count the vaguely positive connotations of colour branding.
The last cluster is the TEAM cluster, with high voting discipline and a little bit of pull on ABC and GREEN candidates. But TEAM had a very weak showing in the other clusters. As a result, even a strong showing in the cluster with the lowest number of ballots was nowhere near enough to get candidates elected. Running against new housing and SkyTrain expansion is just not popular. Who knew? (Who indeed?)
Let’s return to the influence of the VDLC. How did the Vancouver District Labout Council election endorsements matter? They endorsed 10 candidates in 2022, three of whom got elected. Only 1,321 voters chose the full VDLC slate on their ballots. But let’s take a broader look at their impact on voters. What share of voters voted for any number of VDLC endorsed candidates?
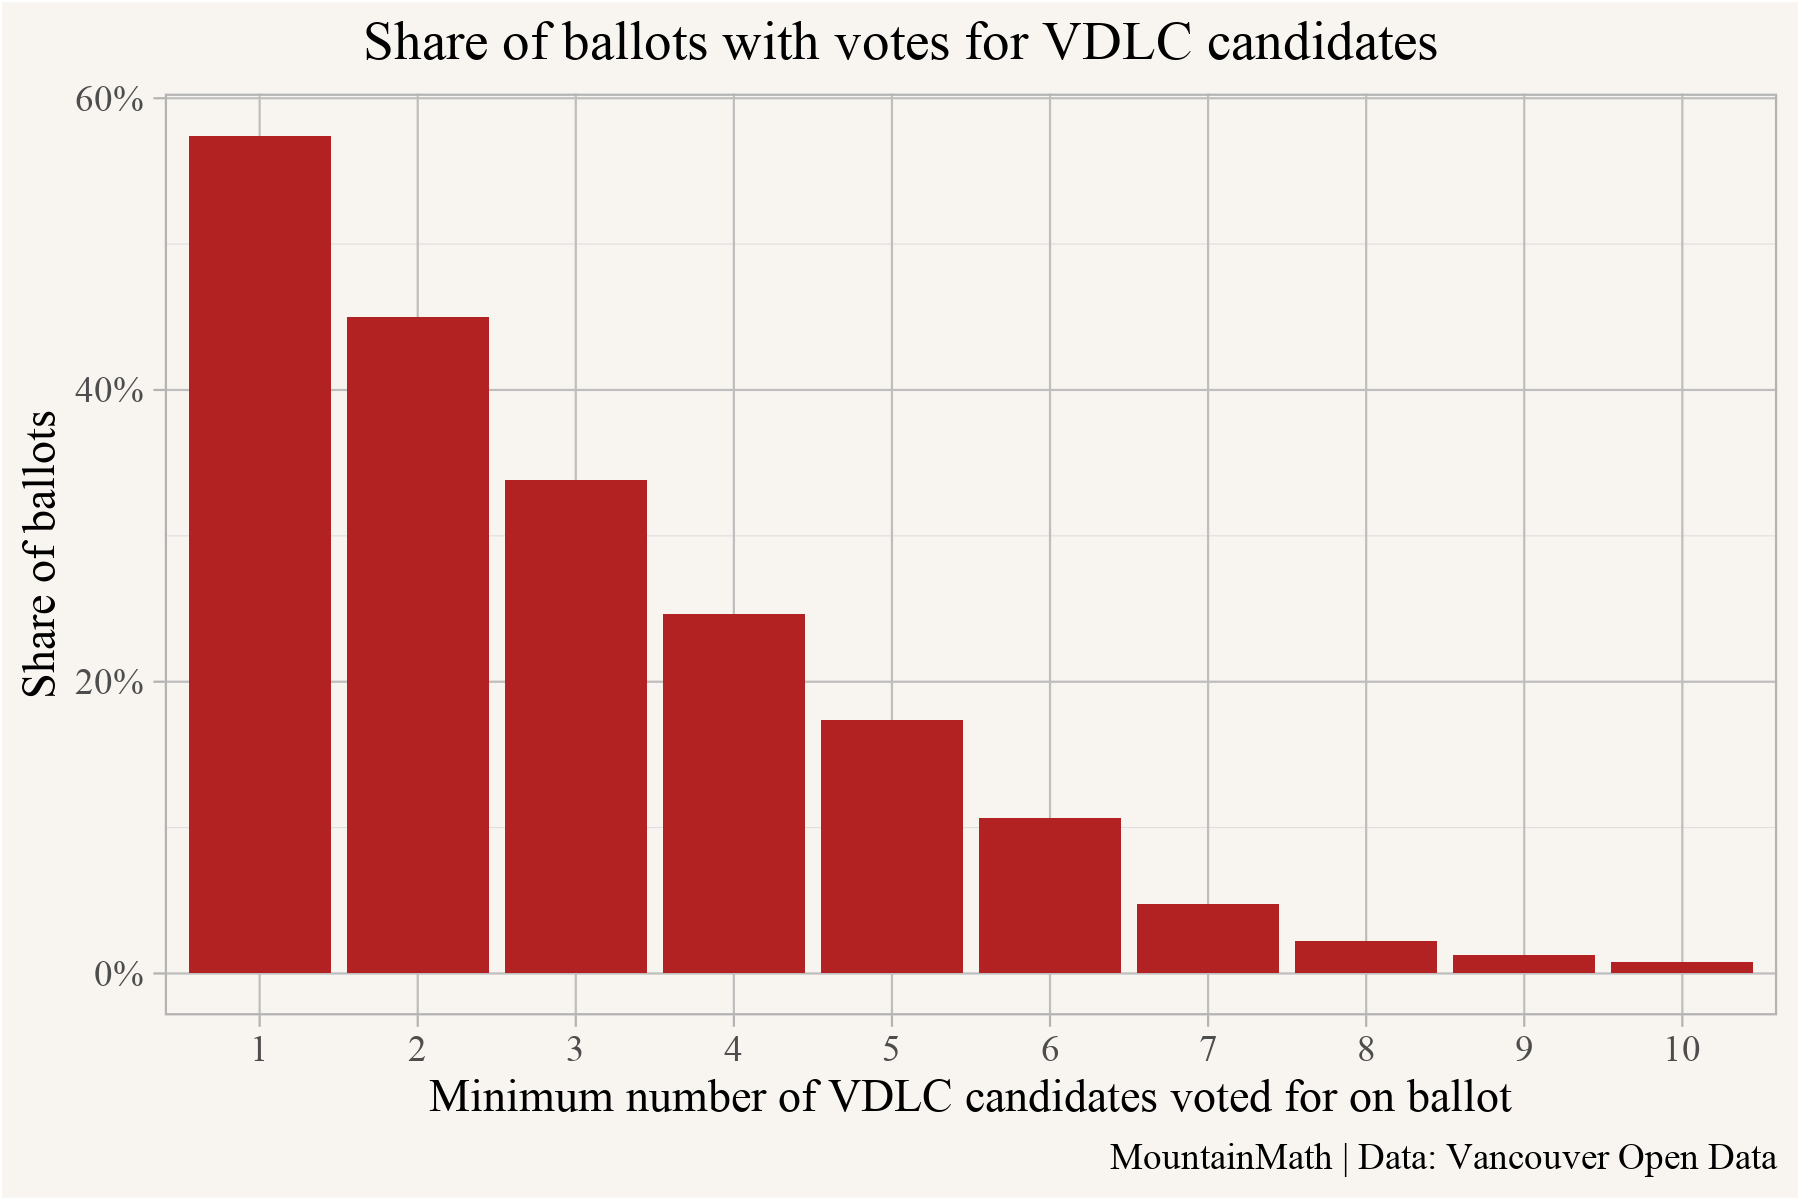
While a little over half of all voters voted for at least one VDLC candidate, the minimum number of votes VDLC candidates got on each ballot drops off fast as we approach the full slate. We can visualize voter discipline by looking just at the correlation plot of VDLC candidates.
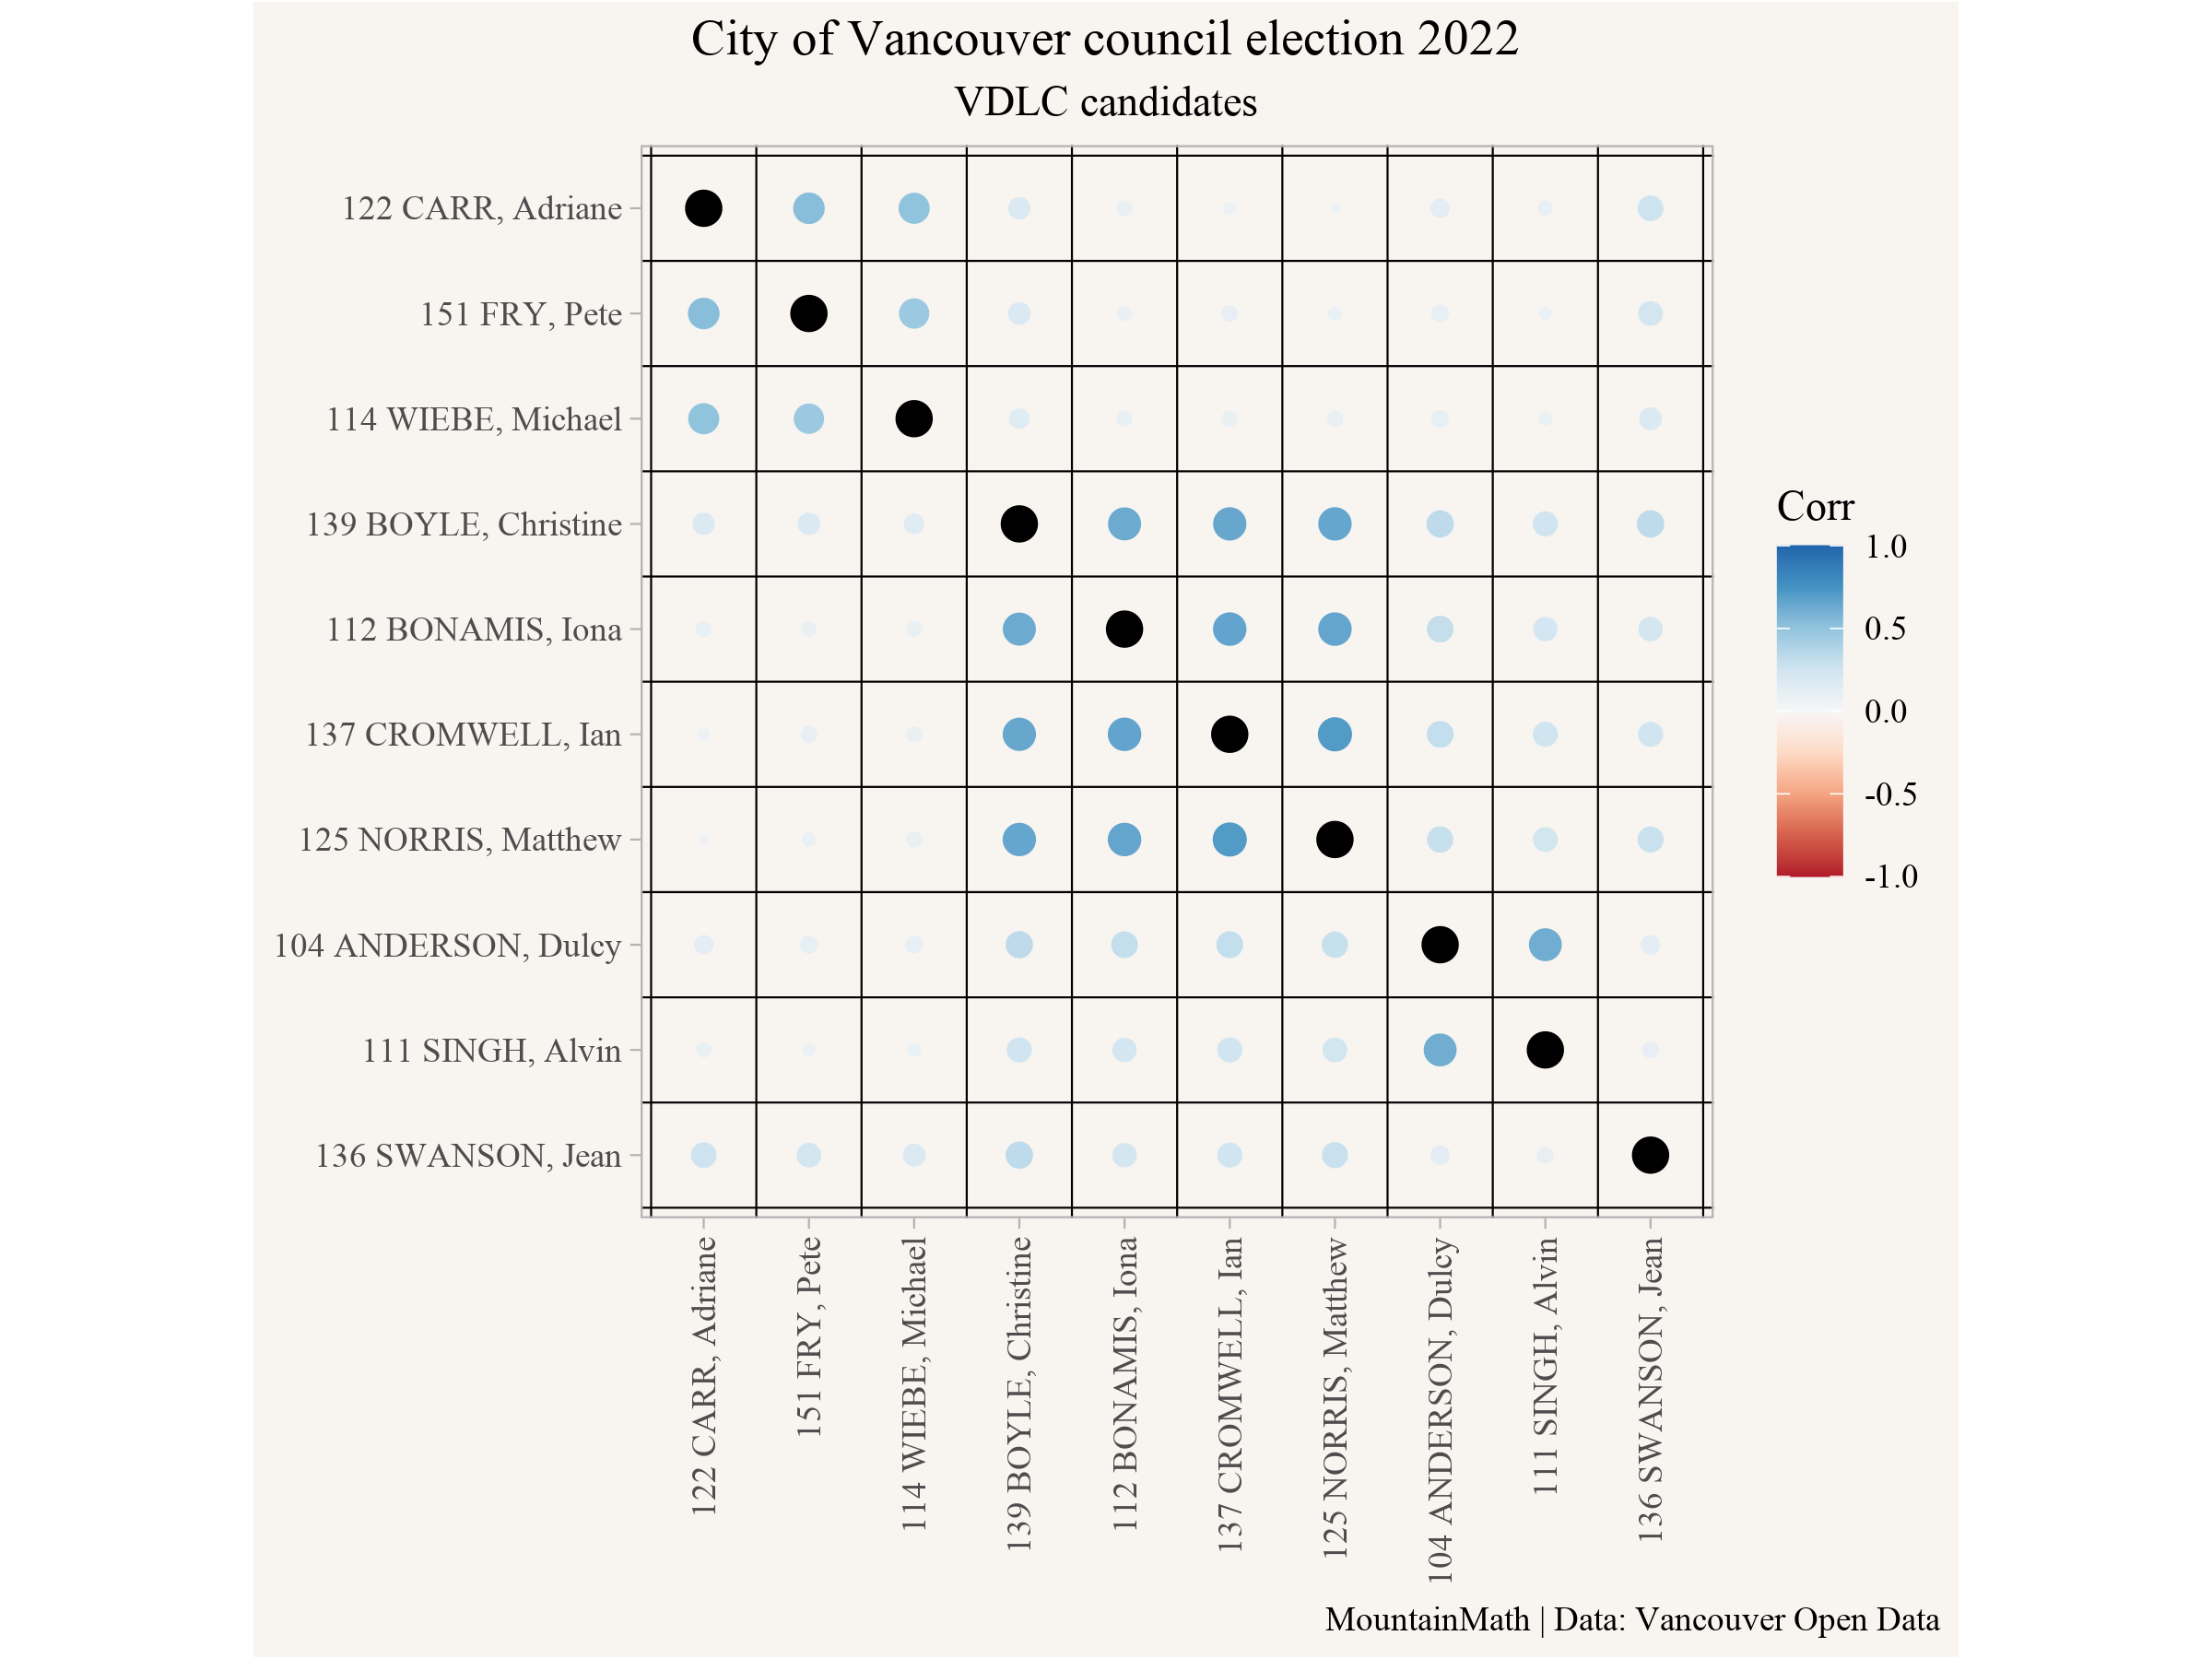
As can be expected this shows that party affiliation had much stronger cohesion than VDLC, but what’s concerning is how little cross-correlation there is between VDLC candidates across party lines. The strongest correlation is between OneCity and Forward candidates, but as we observed before, this correlation was not restricted to VDLC candidates and it is difficult to argue that VDLC strengthened it much. Jean Swanson stands out as having positive correlations to everyone else, with the weakest correlation to Forward candidates.
Mayoral pull
One question we haven’t addressed yet is what kind of pull, if any, mayoral candidates had on the council ticket. First, let’s add up the mayoral votes corresponding to each council candidate’s support.
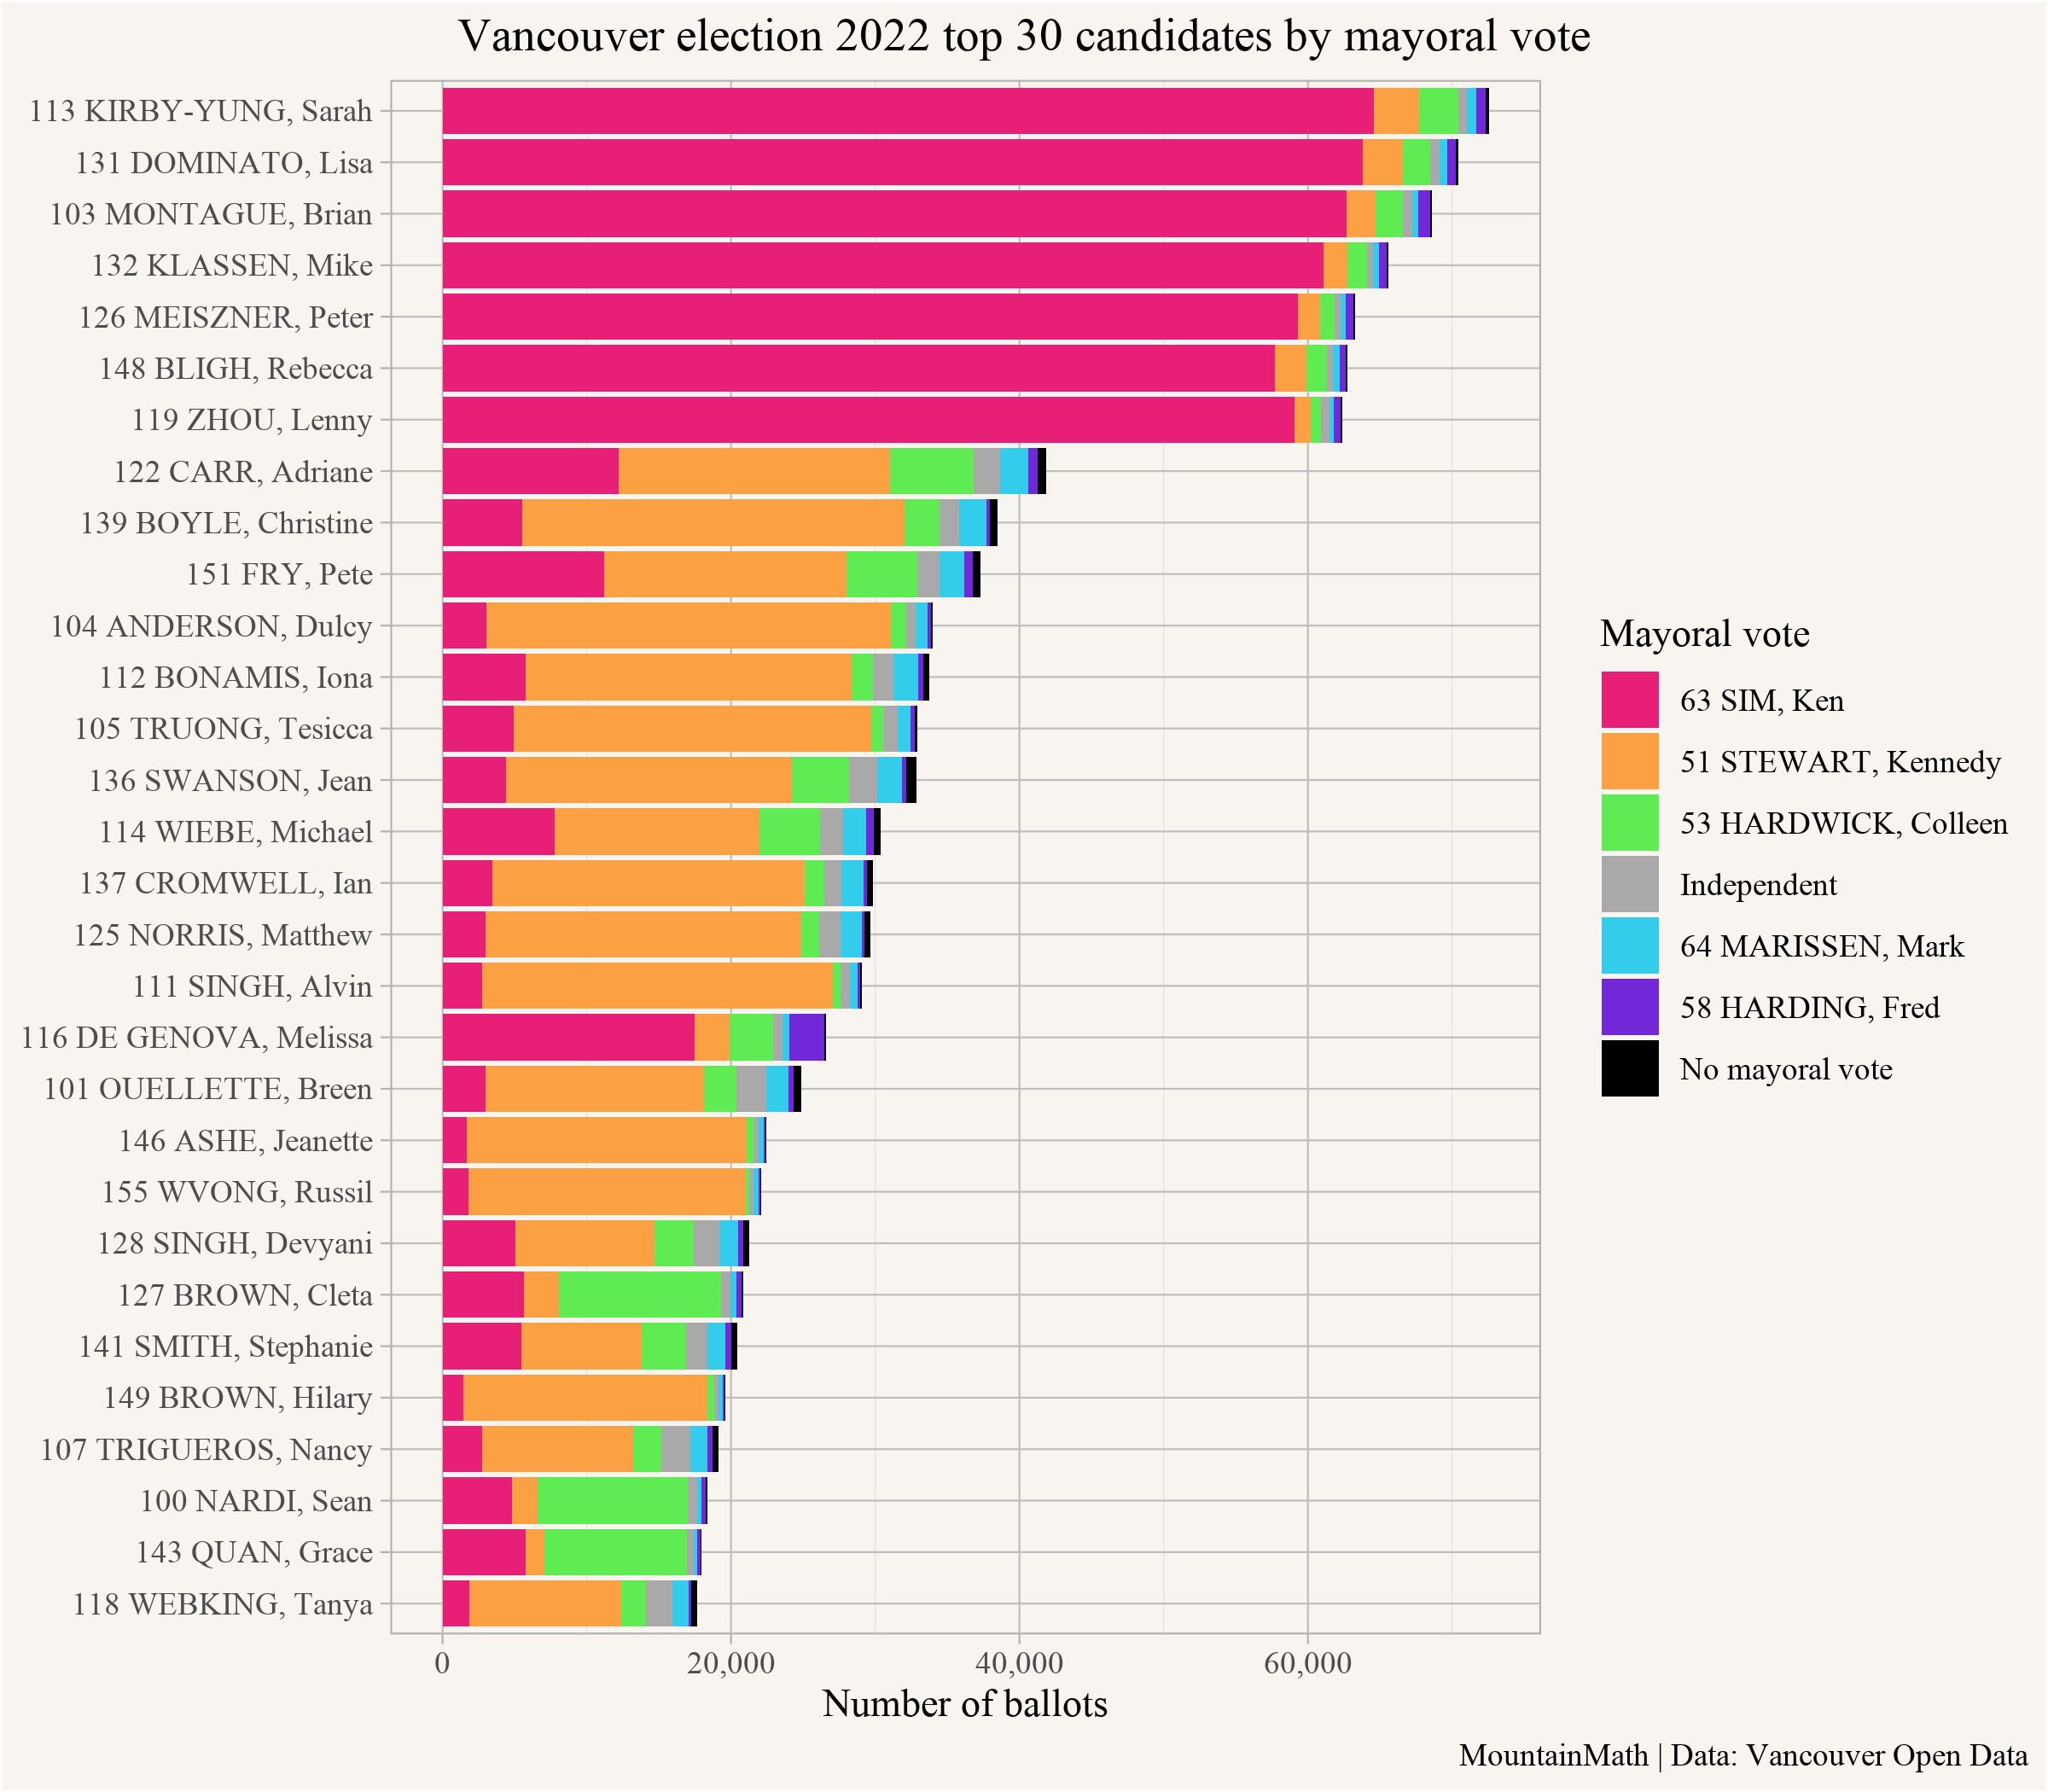
Once again we see how ABC really stuck together, with the vast majority of ABC council support accompanied by votes for new ABC mayor, Ken Sim, at the top of the ticket. Interestingly people voting for the NPA candidate Melissa de Genova also mostly voted for Ken Sim instead of the hapless NPA mayoral candidate, Fred Harding.
A similar but weaker pattern holds with Forward and TEAM candidates. When voters chose council candidates of one party, they also tended to choose the mayoral candidate of that party if one was available. Yet this was only narrowly the case for TEAM, with Colleen Hardwick often less popular than her council candidates. Interestingly, Stewart was the mayoral choice for nearly as many OneCity council voters as he was for those voting for his Forward Vancouver candidates. But GREEN party council voters wandered quite a bit more in terms of their preferred mayoral candidates.
Let’s reverse this figure and look at the spread of council votes by mayoral ballot.
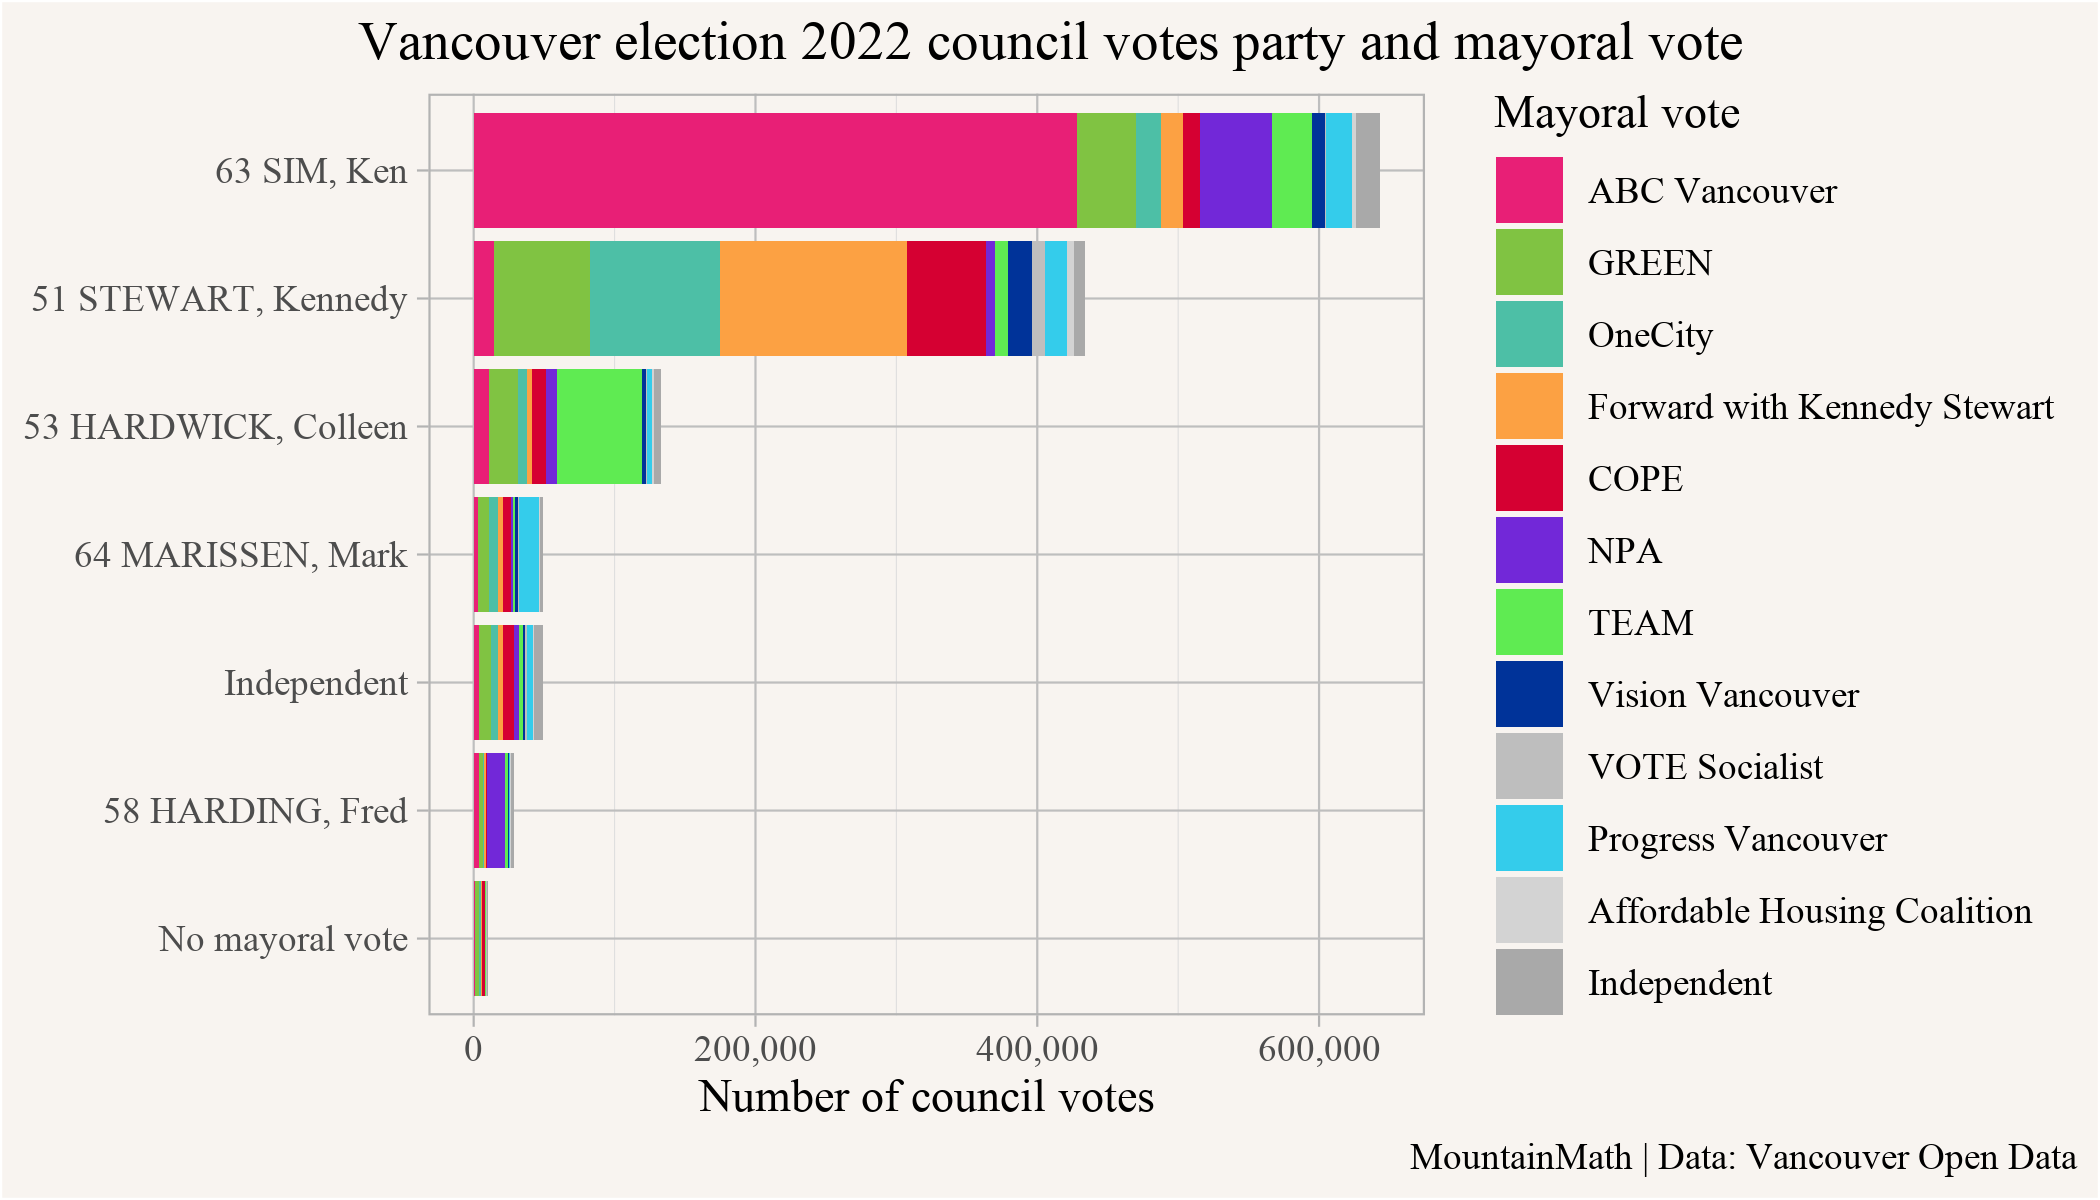
Once again, here we see that Ken Sim had a strong pull on the council ballot, with voters for Ken Sim overwhelmingly voting for ABC candidates, and often only ABC candidates. By contrast, Kennedy Stewart support was built up from supporters of a diverse array of left-of-centre parties, but especially Forward, OneCity, and COPE, with the GREENs most likely to spread their love around.
Finally, let’s take a look at how mayors did at carrying along their slates. While Ken Sim ran with a slate of seven, Kennedy Stewart eventually pulled together a slate of six for Forward Vancouver, and TEAM (Hardwick) and Progress (Marissen) ran at the same size. How many candidates from mayoral party slates got left off the ballot when voters chose a mayor? Let’s take a look.
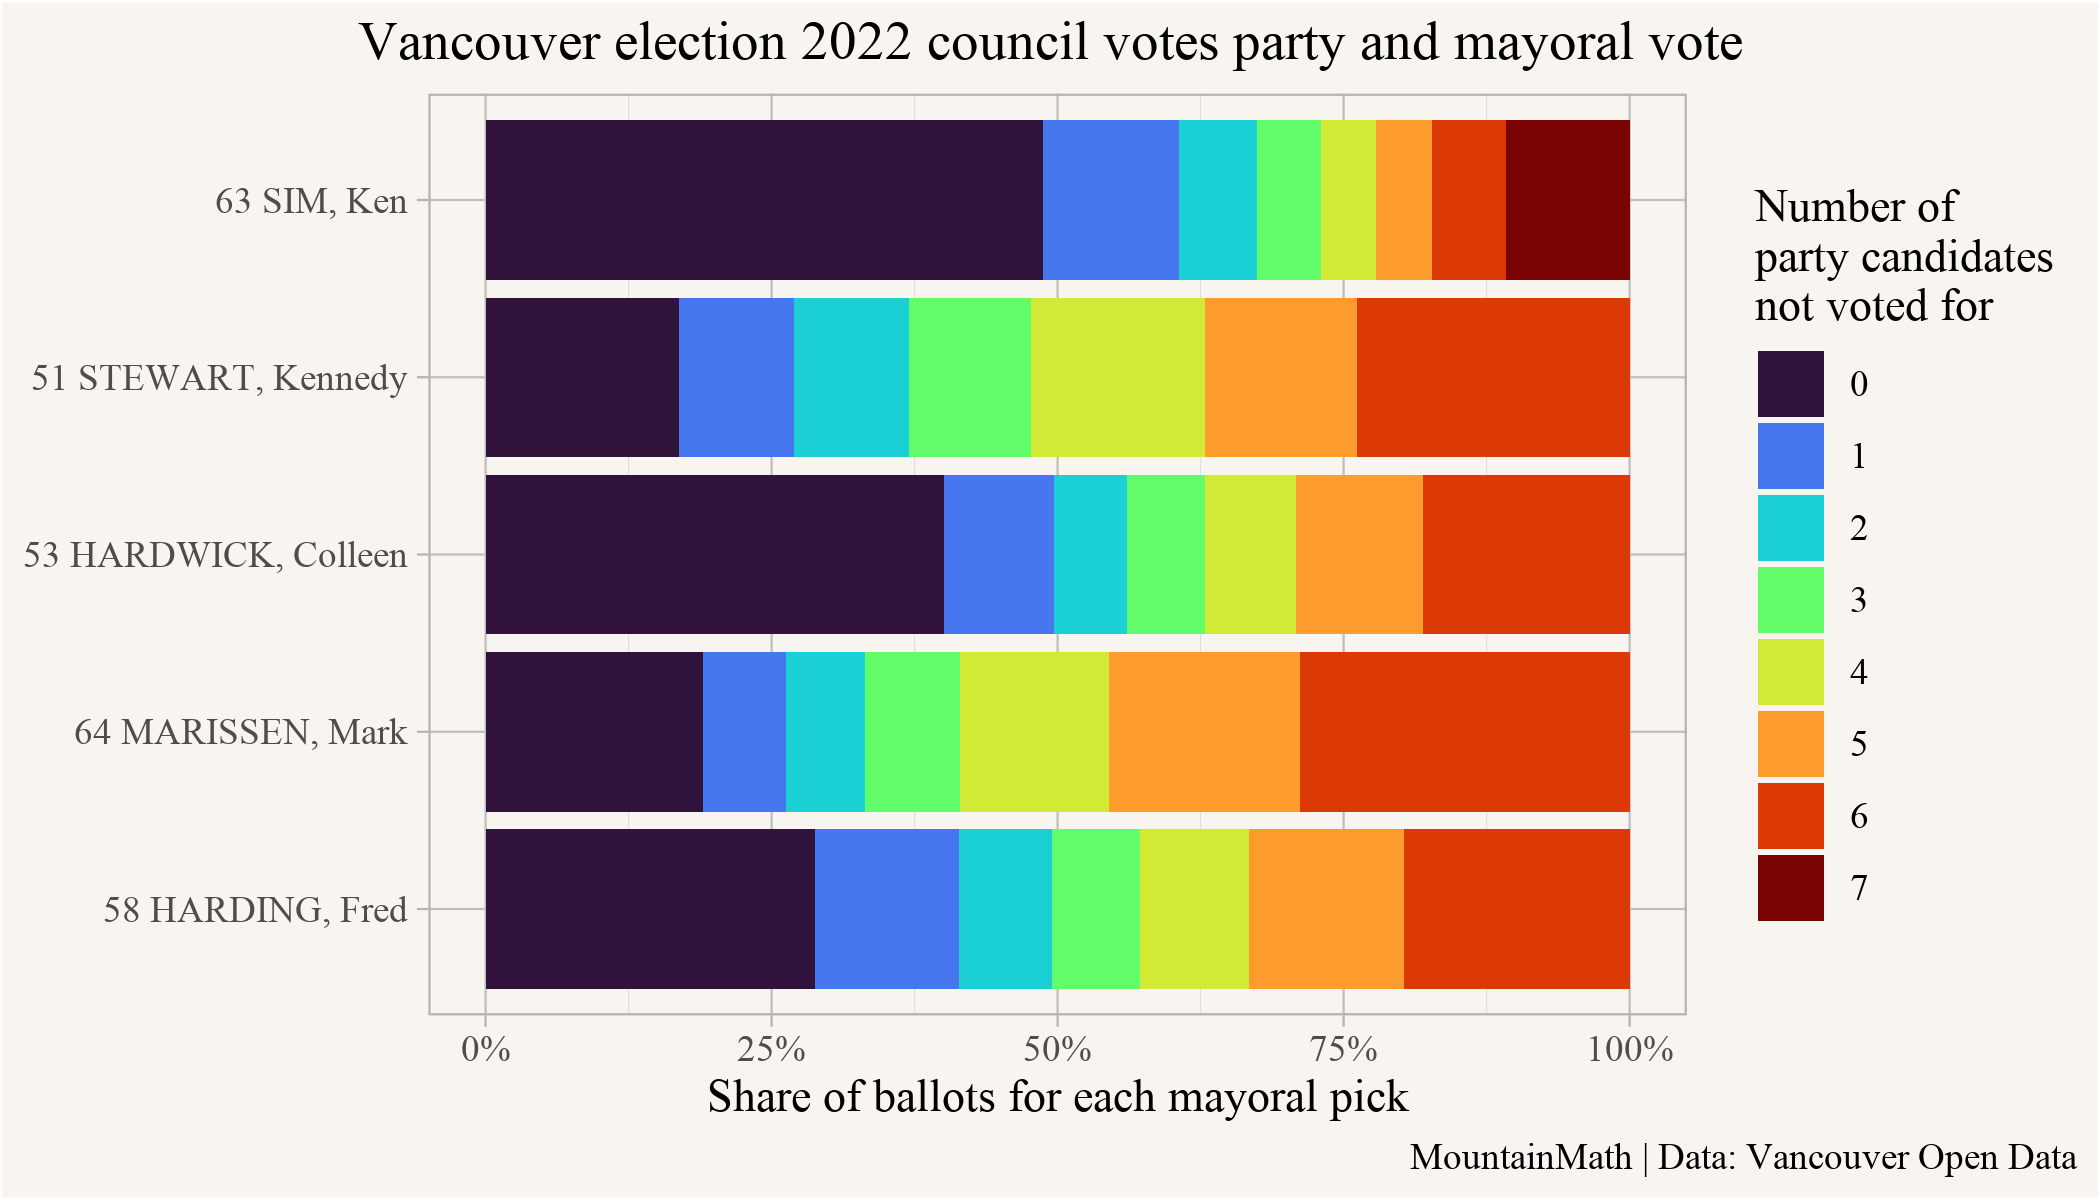
Again, we see that almost half of the people voting for Ken Sim for mayor also voted for the full slate of ABC party candidates. In this case, we further evidence of disciplined party voters. Colleen Hardwick’s voters look similarly disciplined, though it’s worth noting once again that she frequently underperformed her council candidates. Kennedy Stewart performed worst by this metric of party discipline, but he also had the most hastily assembled set of council candidates. On the flip side, urbanist Mark Marissen had the highest share of ballots that picked him for mayor but voted for absolutely none of his party candidates.
Takeaways
Narratives will continue to spin concerning the outcome of the 2022 election in Vancouver and we can’t put them all to rest. But a few clear takeaways emerge from our examination of the ballots.
- ABC had the most disciplined voters lined up for the most organized roster of candidates.
- voters on the Centre-Left remained mostly undisciplined with no clear central organizing roster
- OneCity voters and roster appeared the most disciplined & organized within the centre-left
- GREEN voters still look kind of flaky
- TEAM voters were relatively disciplined, but they’re just not very popular
As usual, the code for this post is available on GitHub for anyone to reproduce or adapt.
Reuse
Citation
@misc{analyzing-ballot-composition-in-vancouver.2022,
  author = {{von Bergmann}, Jens and Lauster, Nathan},
  title = {Analyzing {Ballot} {Composition} in {Vancouver}},
  date = {2022-12-17},
  url = {https://doodles.mountainmath.ca/posts/2022-12-17-analyzing-ballot-composition-in-vancouver/},
  langid = {en}
}
