(Joint with Nathan Lauster and cross-posted at HomeFreeSociology)
Municipalities in BC are required to submit Housing Needs reports, and integrate these into Official Community Plans and Regional Growth Strategies in something resembling housing targets. The BC Housing Supply Act now sharpens this process and adds some teeth, effectively enabling the province to define housing targets, accompanied by new provincial enforcement mechanisms, where the province selects municipalities not meeting housing need. Left unstated are the details of precisely how we should go about calculating housing needs or housing targets.
It’s most useful to think of this question in two parts:
- how much overall housing is needed, and
- how much non-market housing (or cash supplements) is needed to ensure everyone has access to housing.
Setting housing targets for municipalities in BC is chiefly about the first. Non-market housing and housing supplements are generally the responsibility of higher levels of government. But overall targets and non-market housing are connected as part of a broader housing system, and ideally work together. Building more housing of all sorts reduces pressures and need for specifically non-market housing, and building non-market housing counts toward overall housing needed as well as having a stronger impact on affordability at the lower end of the market than building market housing alone.
In this post we focus on setting overall housing targets for municipalities, but we’ll revisit non-market need.
Why do we need overall housing targets?
Municipalities have generally adopted very restrictive policies when it comes to new housing that to a large degree remove key market mechanisms from the process of housing provision. Supply is not enabled to rise in response to rising demand, but rather must first go through a complicated, uncertain, expensive, and lengthy municipal approvals process. What’s more, evidence suggests the process tends to grow increasingly complicated, uncertain, expensive, and lengthy over time. Strong targets work against this tendency, providing a mechanism that tells municipalities how much housing they “need” to approve and see built within specific time windows. Ideally strong targets push municipalities toward simpler, more certain, cheaper, and faster approval processes.
We take it for granted that overall housing targets should be put in place to solve the problems created by municipalities restricting housing. This sets up a relatively simple conceptual approach for how to establish targets. Where would we be if municipalities weren’t restricting housing?
We can break this counterfactual question down into three interrelated parts: How much extra housing could have been built in the past had we not held it back? How many more people would have arrived or stayed if we had built that extra housing? How much cheaper would housing be if we had built that extra housing?
Unfortunately, we can’t easily answer these questions about a past that never was. But we can lay out a procedure for building up answers to related questions in the present, and look at possibilities for extending them into the future. And that’s how we should be constructing housing targets.
How should we construct targets?
How much extra housing could be built now if municipalities weren’t holding it back? This is our most relevant measure of housing shortfall. To provide a rough answer, we can look at how the costs of constructing housing currently relate to the price new housing can fetch on the market. The difference between the two (price - costs) constitutes a “wedge” providing an indicator of how much extra housing could profitably be built. As more housing gets built, it should drive up supply and drive down price. As prices decline toward costs, the wedge approaches zero. At the point where the wedge equals zero, we can be pretty sure municipal approval processes aren’t holding back new housing, because developers wouldn’t find it profitable to build anyway (elsewhere in the literature, the point where the wedge equals zero is also known as the Minimum Profitable Production Cost).
But how fast new supply drives down price depends upon how much demand it meets. We need estimates of demand elasticity. Measurements of demand elasticity provide a way to estimate at least partial answers to our second and third questions. How many more people would stay or come to Vancouver if we had a bunch of extra housing? And how much cheaper would housing be if we had a bunch of extra housing? These questions are interrelated: we can’t really answer one without the other.
Of note, all of our answers for questions about the present will also relate to our historical counterfactual questions, but the questions aren’t quite the same. After all, building standards have tightened and it’s now more expensive to build housing. We can consider the rise in building standards as accompanying, and perhaps even part of the rise complicated, uncertain, expensive, and lengthy municipal approval processes. But to the extent newer standards result in better quality, more accessible, and more sustainable housing, we don’t want to get rid of them. Also, building out more gradually over time would have allowed buildings to depreciate, resulting in a more balanced price distribution throughout the housing spectrum. This can’t be fixed retroactively, the best time to build housing was yesterday, but the second best time is now.
Estimating current housing shortfall
To estimate current housing shortfall we focus on the type of housing that we can expect to be most effective in adding housing: multifamily apartment buildings. These also happen to be the type of housing most restricted by municipalities. While we could (and should) add single family homes by subdividing existing single family lots or stratifying them into row/townhouses, the main contribution of growth in housing will have to come from apartments. And while we are generally more concerned about rental than ownership housing, our data on rental is simply not good enough to use for this kind of analysis. Here we focus on prices, with the understanding that people trade off owning vs renting and ownership, and rental affordability moves in tandem in the medium to long term.
We estimate housing shortfall in three steps that together address our questions above, providing a relatively simple conceptual approach.
- Estimate the wedge between the price new housing fetches and what it costs to build, including land but assuming no or little restrictions on density or location.
- Estimate the demand elasticity to price, that is the shape of the demand curve.
- Estimate the housing shortfall, that is the amount of housing needed until the wedge is competed away.
When the rubber hits the road it will get a little more complicated, but let’s take a look how this could be done for some Metro Vancouver municipalities.
Estimating the wedge
CMHC analysts have estimated the wedge for overall CMAs and municipalities within them based on 2018 prices. In their analysis the cost includes developer profit, but no land component. Glaeser suggests that around 20% of the sale price should be land cost in an unregulated market, so we apply this ratio to the wedge estimates from the report to obtain the “excess price” of housing. The idea here is that the optimum density is such that when everything is said and done the purchase price of the land makes up 20% of the sale price of the new housing built on top.
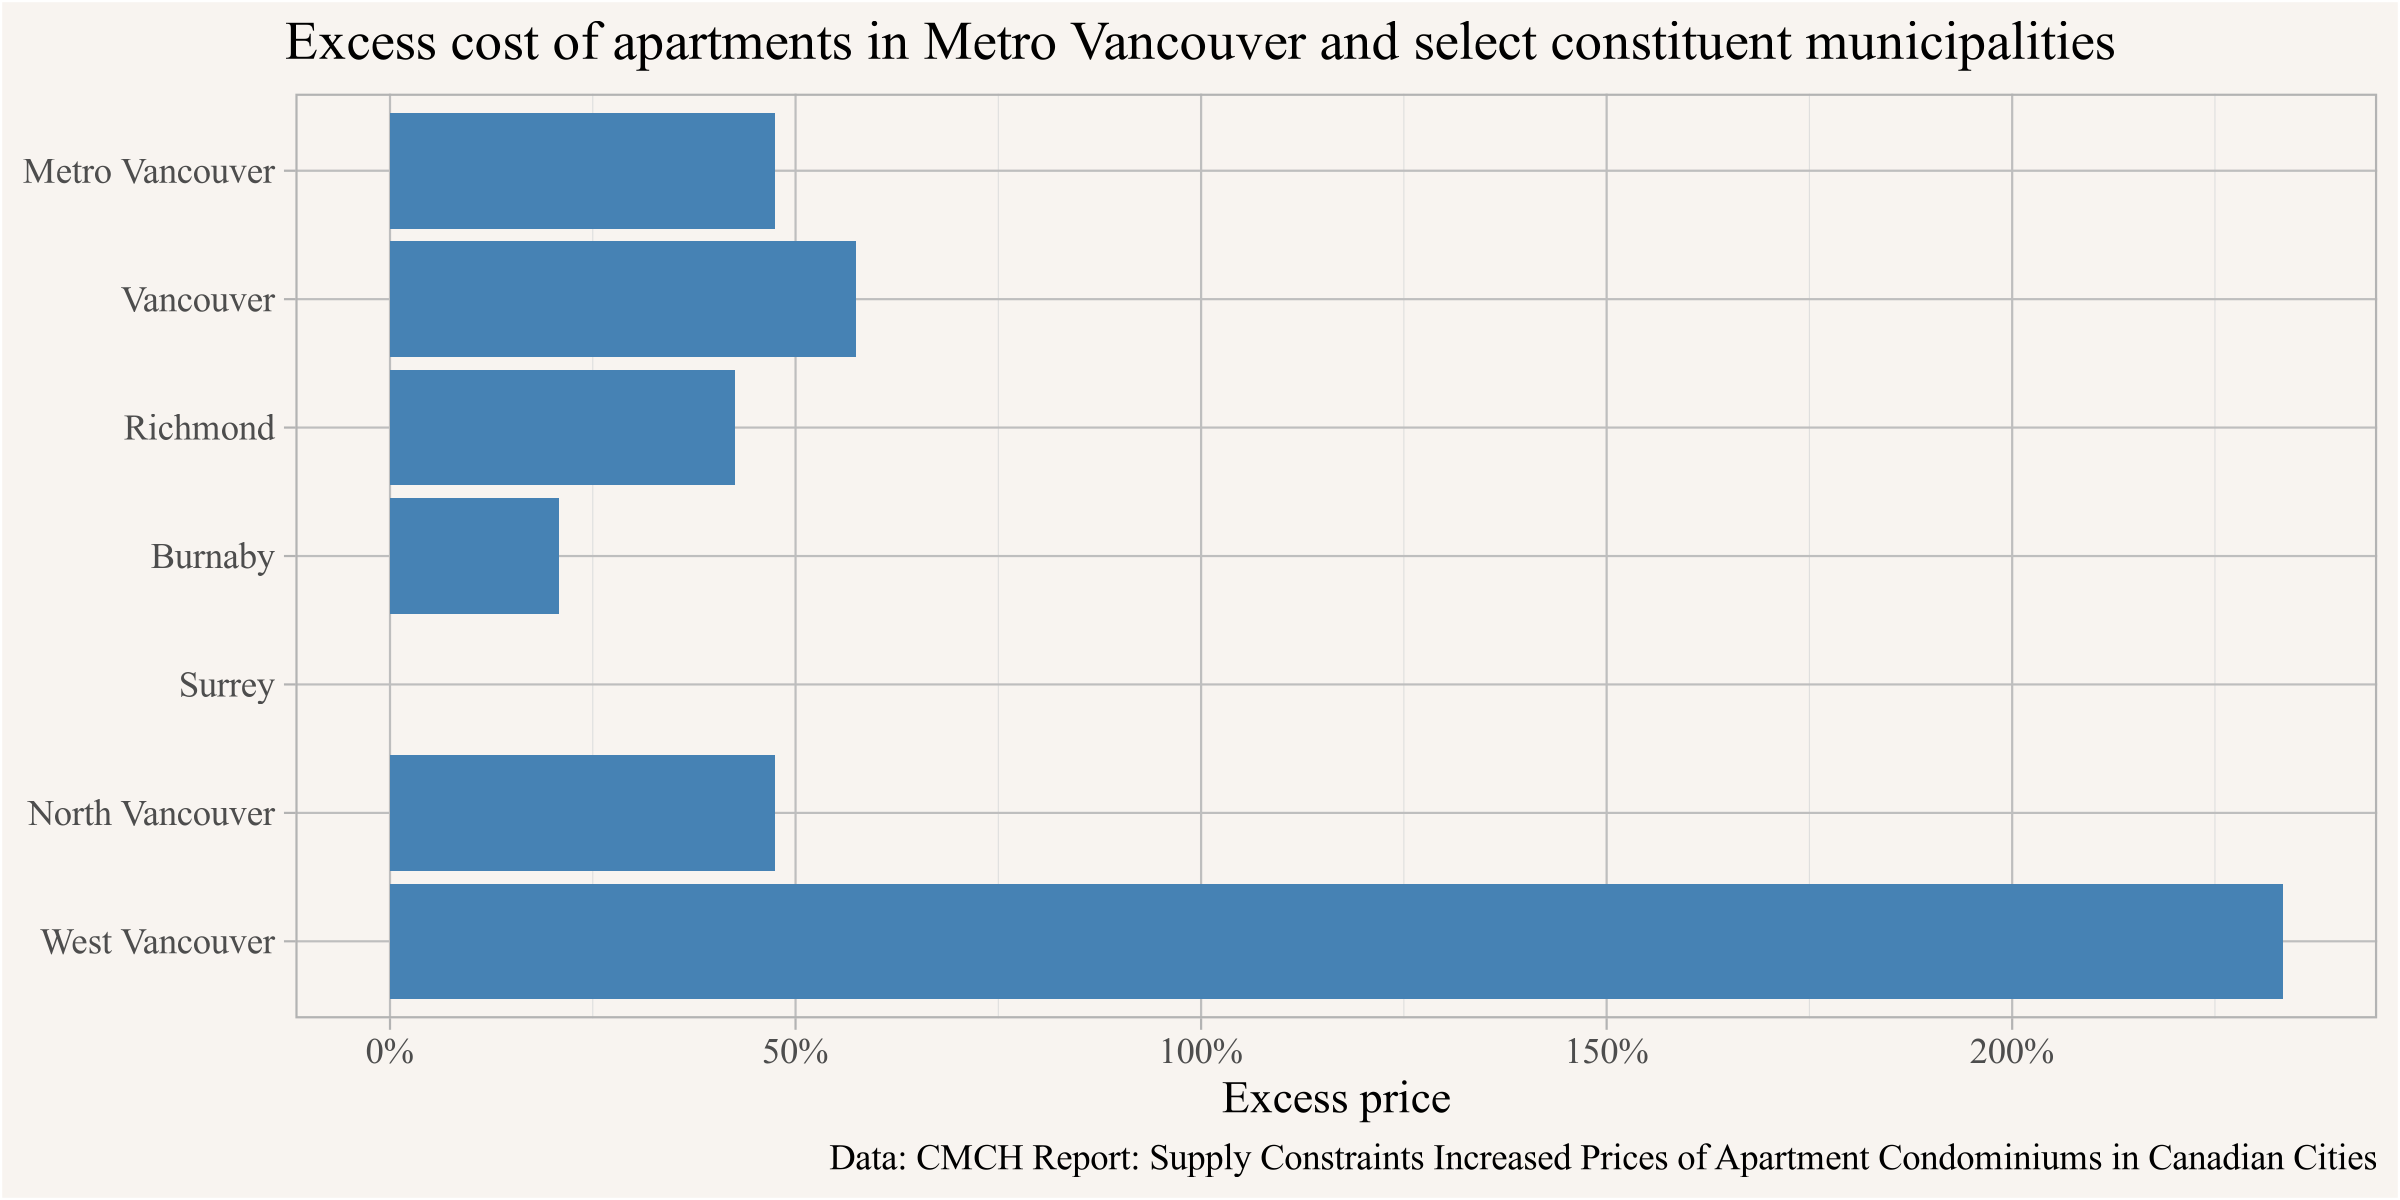
North Vancouver here combines the District and the City. Of note, this suggests that Surrey builds housing roughly in line with demand. But the more centrally located municipalities of Vancouver, North Vancouver, Richmond and Burnaby, are under-building with respect to demand. This speaks to not just the overall housing shortage, but also the spatial misallocation of housing in the region, both of which are to a large extent promoted by Metro Vancouver regional planning.
Demand elasticity
To translates our wedge estimates into current housing shortfall estimates we need to assess the demand elasticity of price. For BC overall CMHC has estimated a demand elasticity of -0.5, so all else being equal for every 1% of increase in housing supply prices fall by 2%, the inverse demand elasticity. Ideally one would try to get more detailed estimates for Vancouver, but the reality is that the shape of the demand curve is difficult to estimate and comes with large uncertainties, suggesting we should probably report ranges rather than point estimates. We add estimates using demand elasticities between -0.7 to -0.3 that roughly cover the range seen in the literature. Combining this with housing stock estimates this gives us estimates of the current (2018) housing shortfall, which should be interpreted as the number of dwelling units needed to compete away the excess cost.
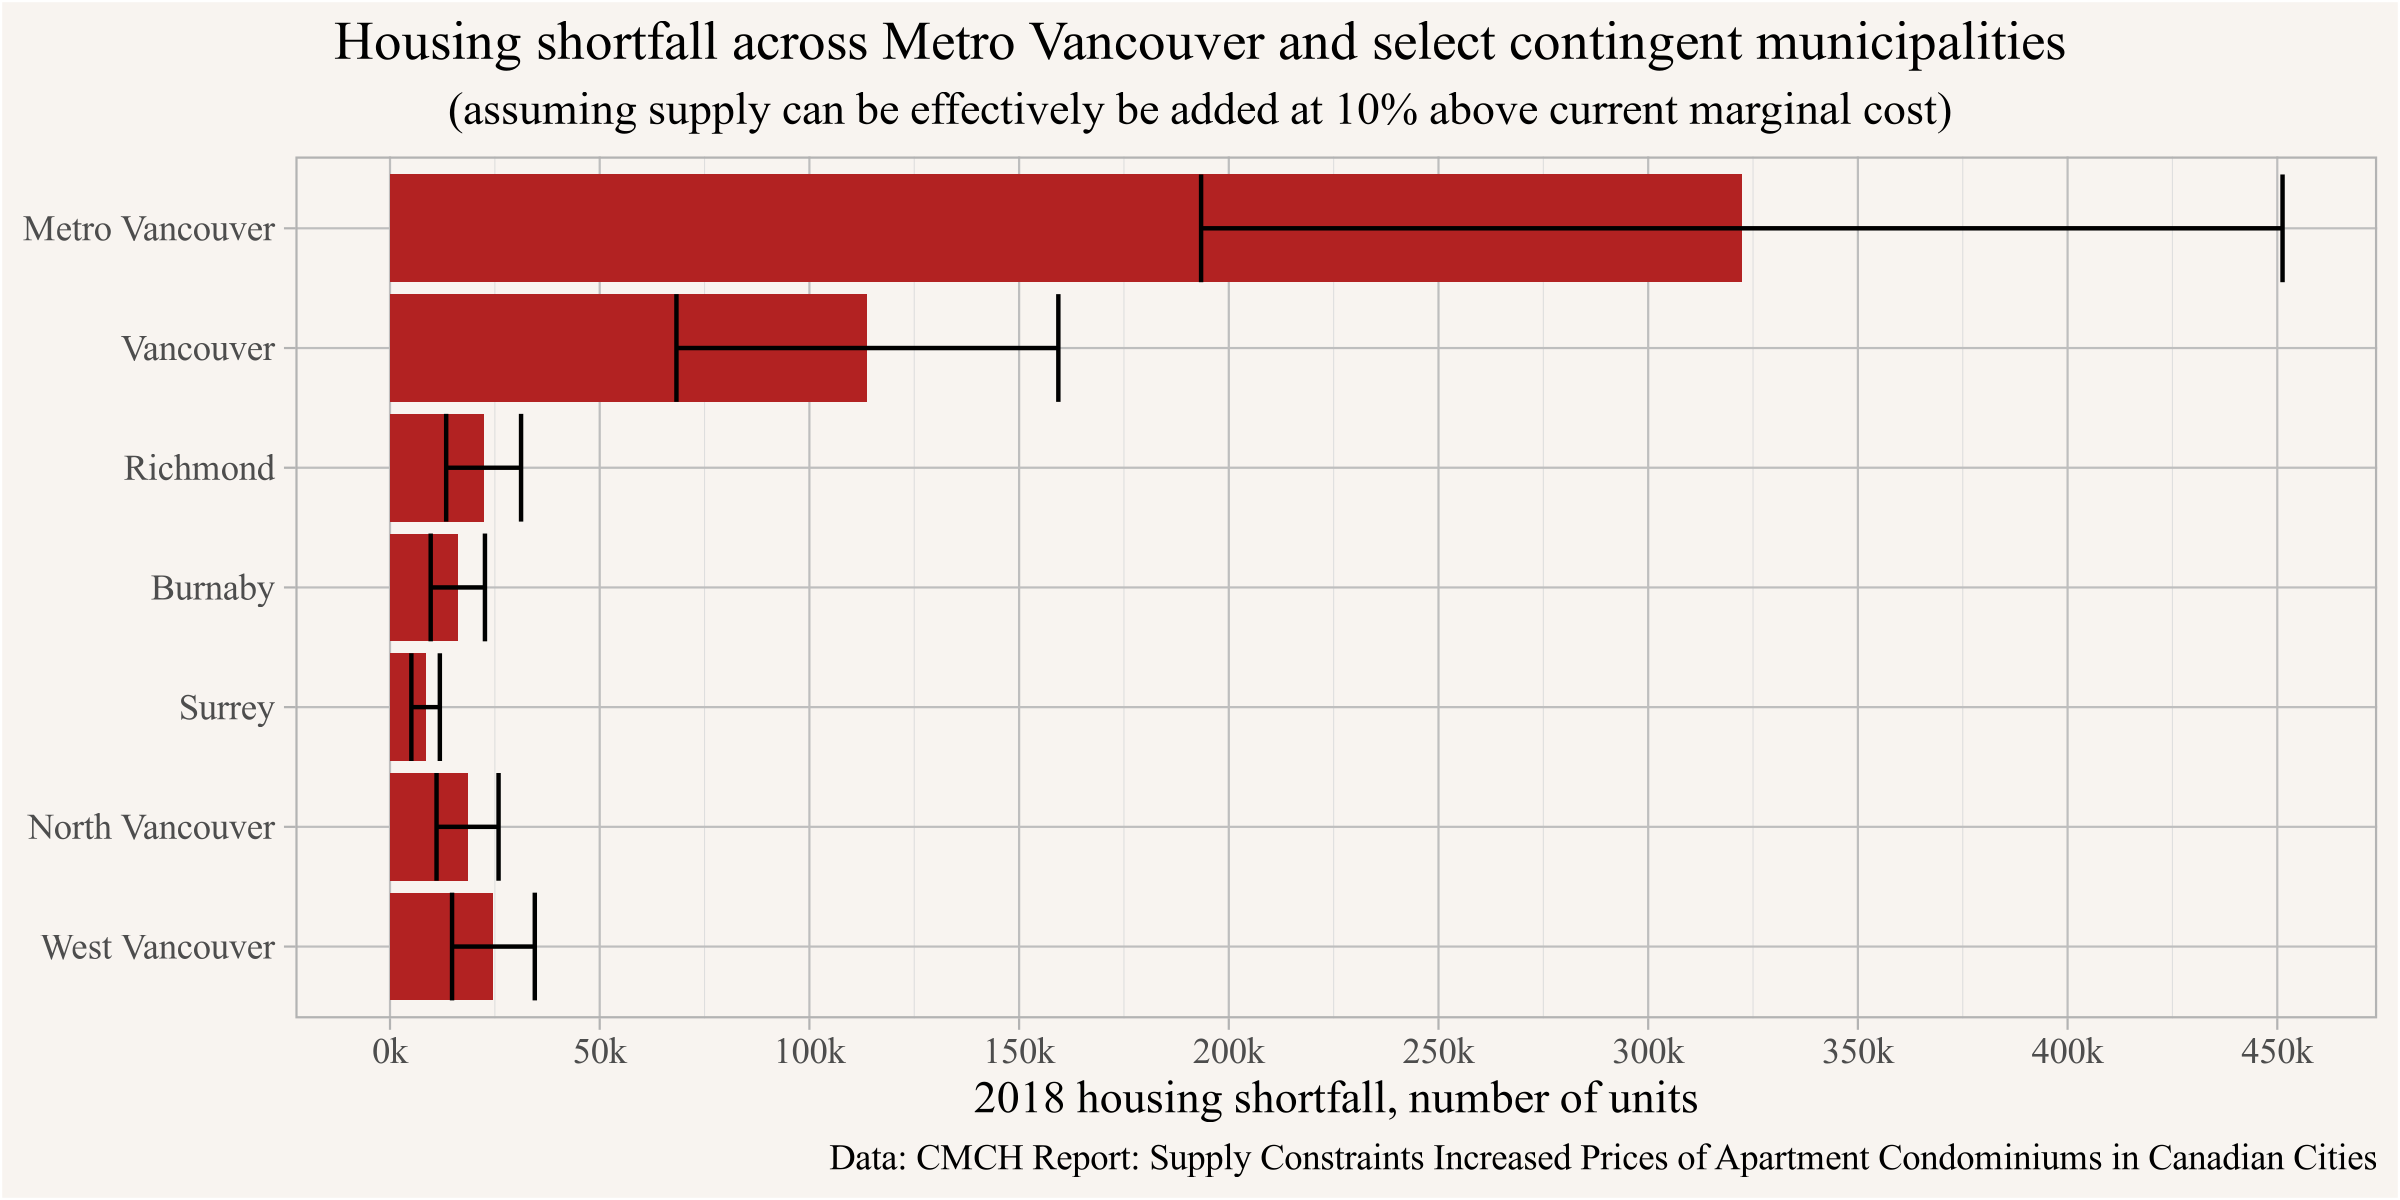
There are some potential issues with these estimates, for example housing demand is not homogeneous, and given how far prices are from equilibrium of Minimum Profitable Production Cost our extrapolation may be off. Moreover, current construction tends to cater to the higher end of the market, we expect that to change as we slide down the demand curve, in which case we will see less fancy, and thus cheaper, construction, which increases the wedge and deepens the range of price effects we would see. We believe that using a broad range of demand elasticities should cover this and other uncertainties in this process. This gets us to the current housing shortfall, which to no surprise is concentrated in the central parts of the region, in particular the City of Vancouver.
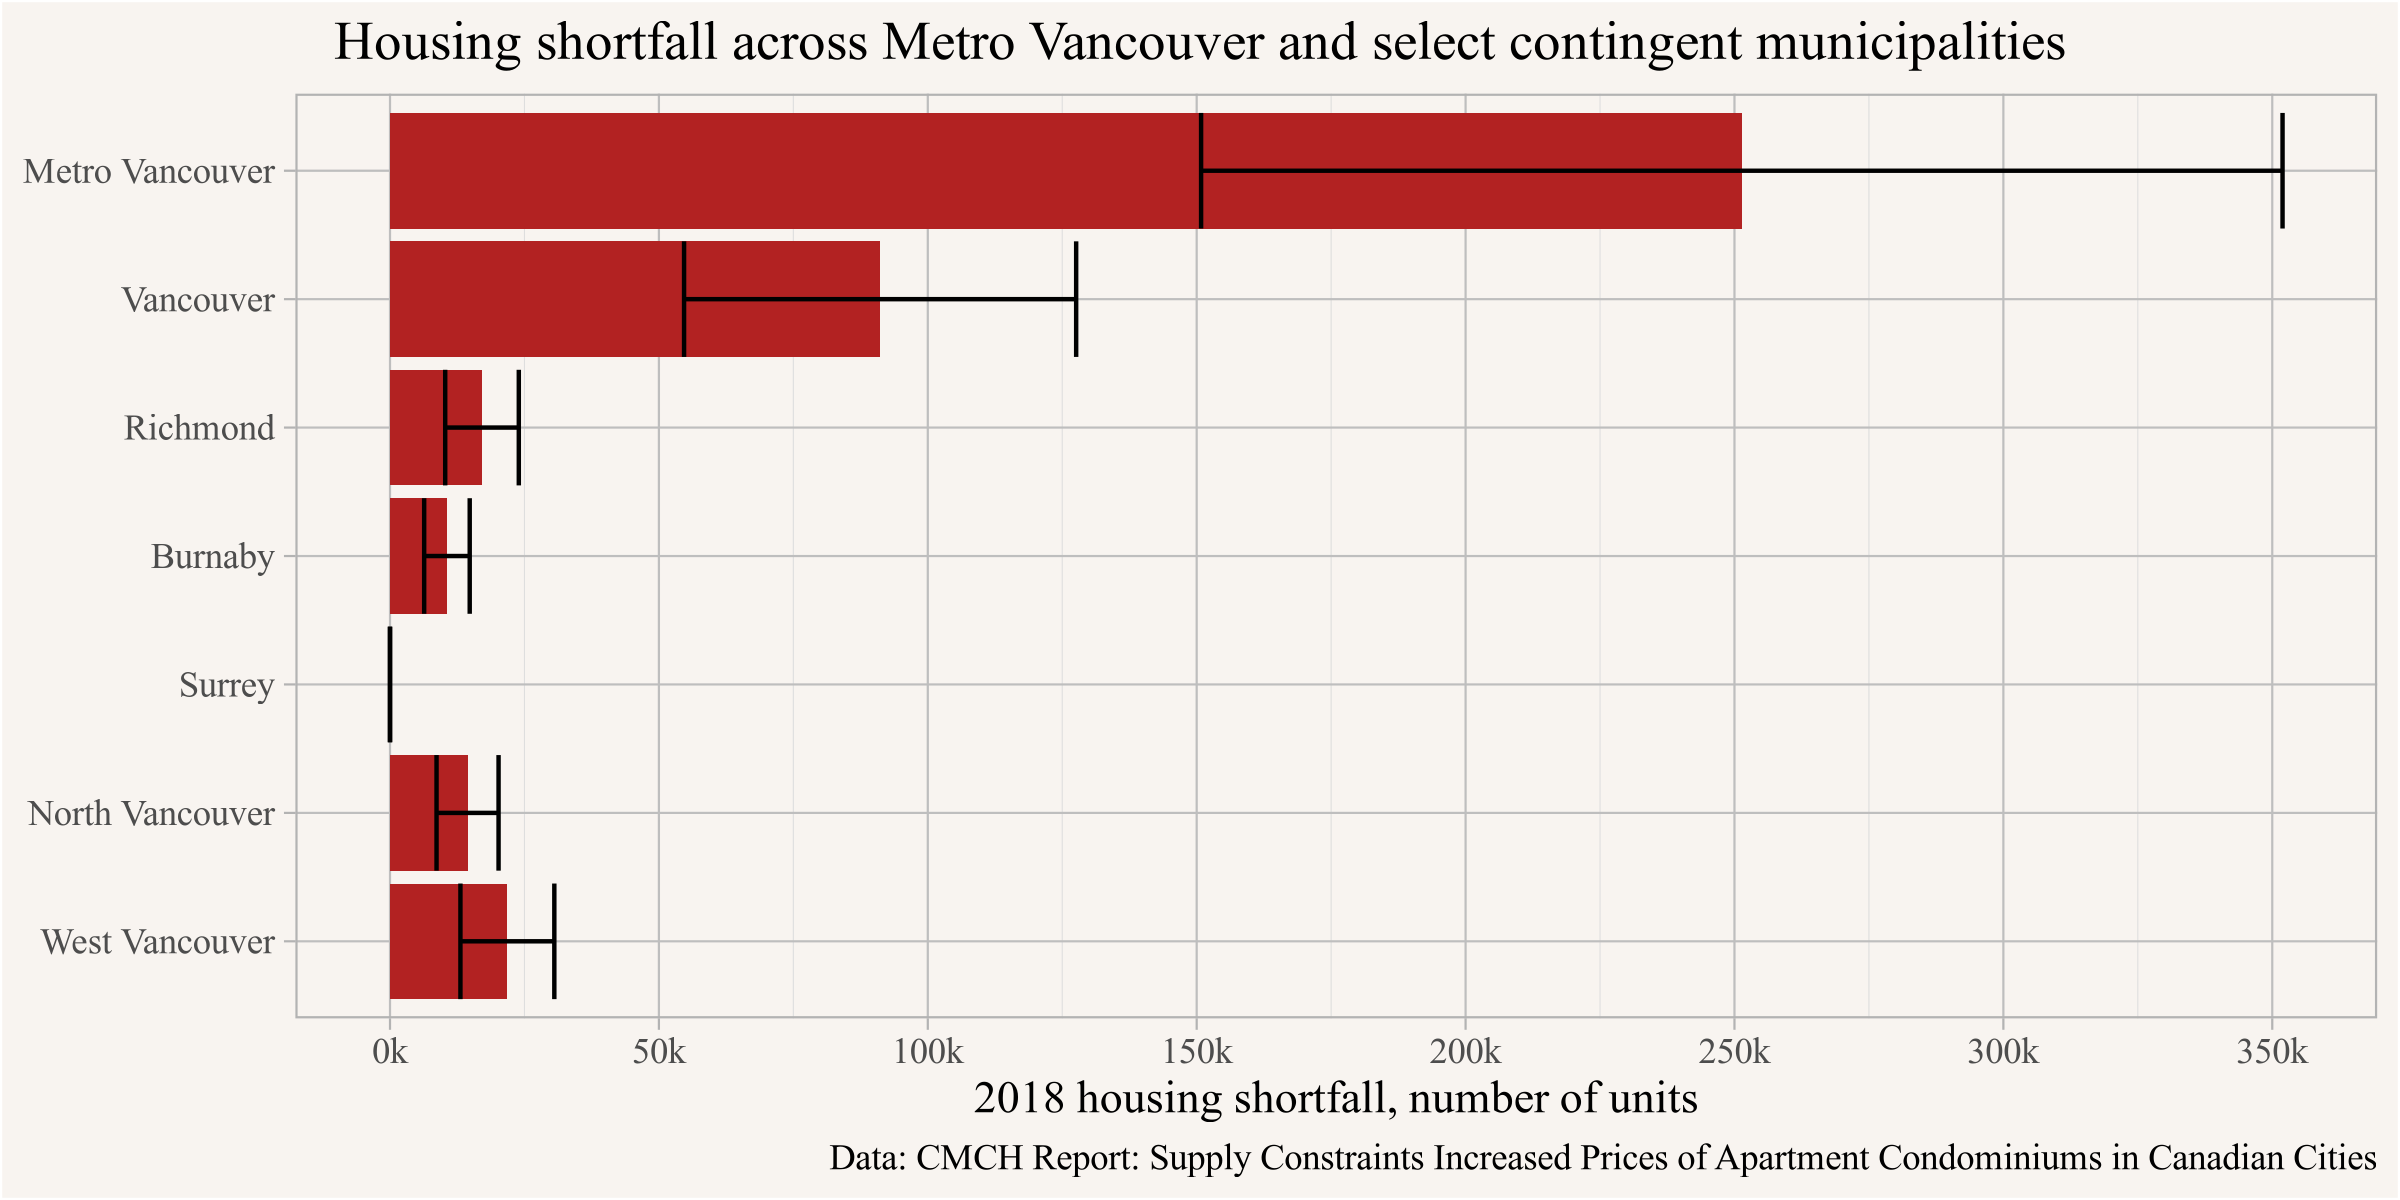
We note that our simple estimate of a shortfall of 250k housing units for Metro Vancouver stacks up pretty well against other relevant estimates. For instance, the suppressed household estimate we calculated suggests a shortage of between 130k to 200k dwellings for Metro Vancouver looking at household maintainer rates for existing residents alone, but not including those outside the region. To put it differently, we would anticipate many more people moving into their own households instead of doubling up with others if more housing were available, but we would also expect more people remaining in or arriving to Vancouver.
Regardless, these estimates are pegged to the present, and housing can’t be created instantly. To transform our estimates into housing targets we need to set a goal for some point in the future. But housing demand will likely grow in that time frame, necessitating more housing. This leads us to thinking not just about our current shortfall, but also about future shortfalls. How do we plan ahead?
One option is to benchmark against business as usual development, adding more on top. We see this with the CMHC housing target for BC of an additional 570k units over the next 10 years needed to bring affordability back in line with 2003-2004 levels. On first pass, our estimated shortfall of 250k households in Metro Vancouver fits pretty well with this target, insofar as Metro Vancouver contains over half the population of BC. But the fit isn’t perfect, and given that this is a different measure, speaking to a distinct affordability standard already considered unacceptable across the rest of Canada, and calculated out 10 years into the future, we shouldn’t expect it to be. How might we come up with our own housing target?
Estimating future housing demand
This is where we have to make some assumptions. How will the demand for housing grow in the future, say over the next 10 years? For the purposes if this post we take a very rough shortcut and piggy-back off of Metro Vancouver projected household growth. As we discussed in our last post, Metro Vancouver’s methods underlying projected household growth systematically underestimate demand, and we remedy this by assuming that they underestimate demand in line with the size of our current housing shortfall above. After all, the same growth management strategies baked into the Metro Vancouver projections is exactly what leads to our current housing shortfall.
So to get to projections of future housing demand we scale Metro household projections up by the ratio of the current shortfall to the existing dwelling stock. This may over-estimate demand a bit since traditionally Metro Vancouver fell short of meeting their household targets, but it may also underestimate demand insofar as Metro Vancouver projections are set to worsen the housing shortage. Also of note, Metro Vancouver projections are based on households, even though they mislabel them as “dwelling units”. To get to dwelling targets we add another 5% to allow for moving vacancies and other frictions.
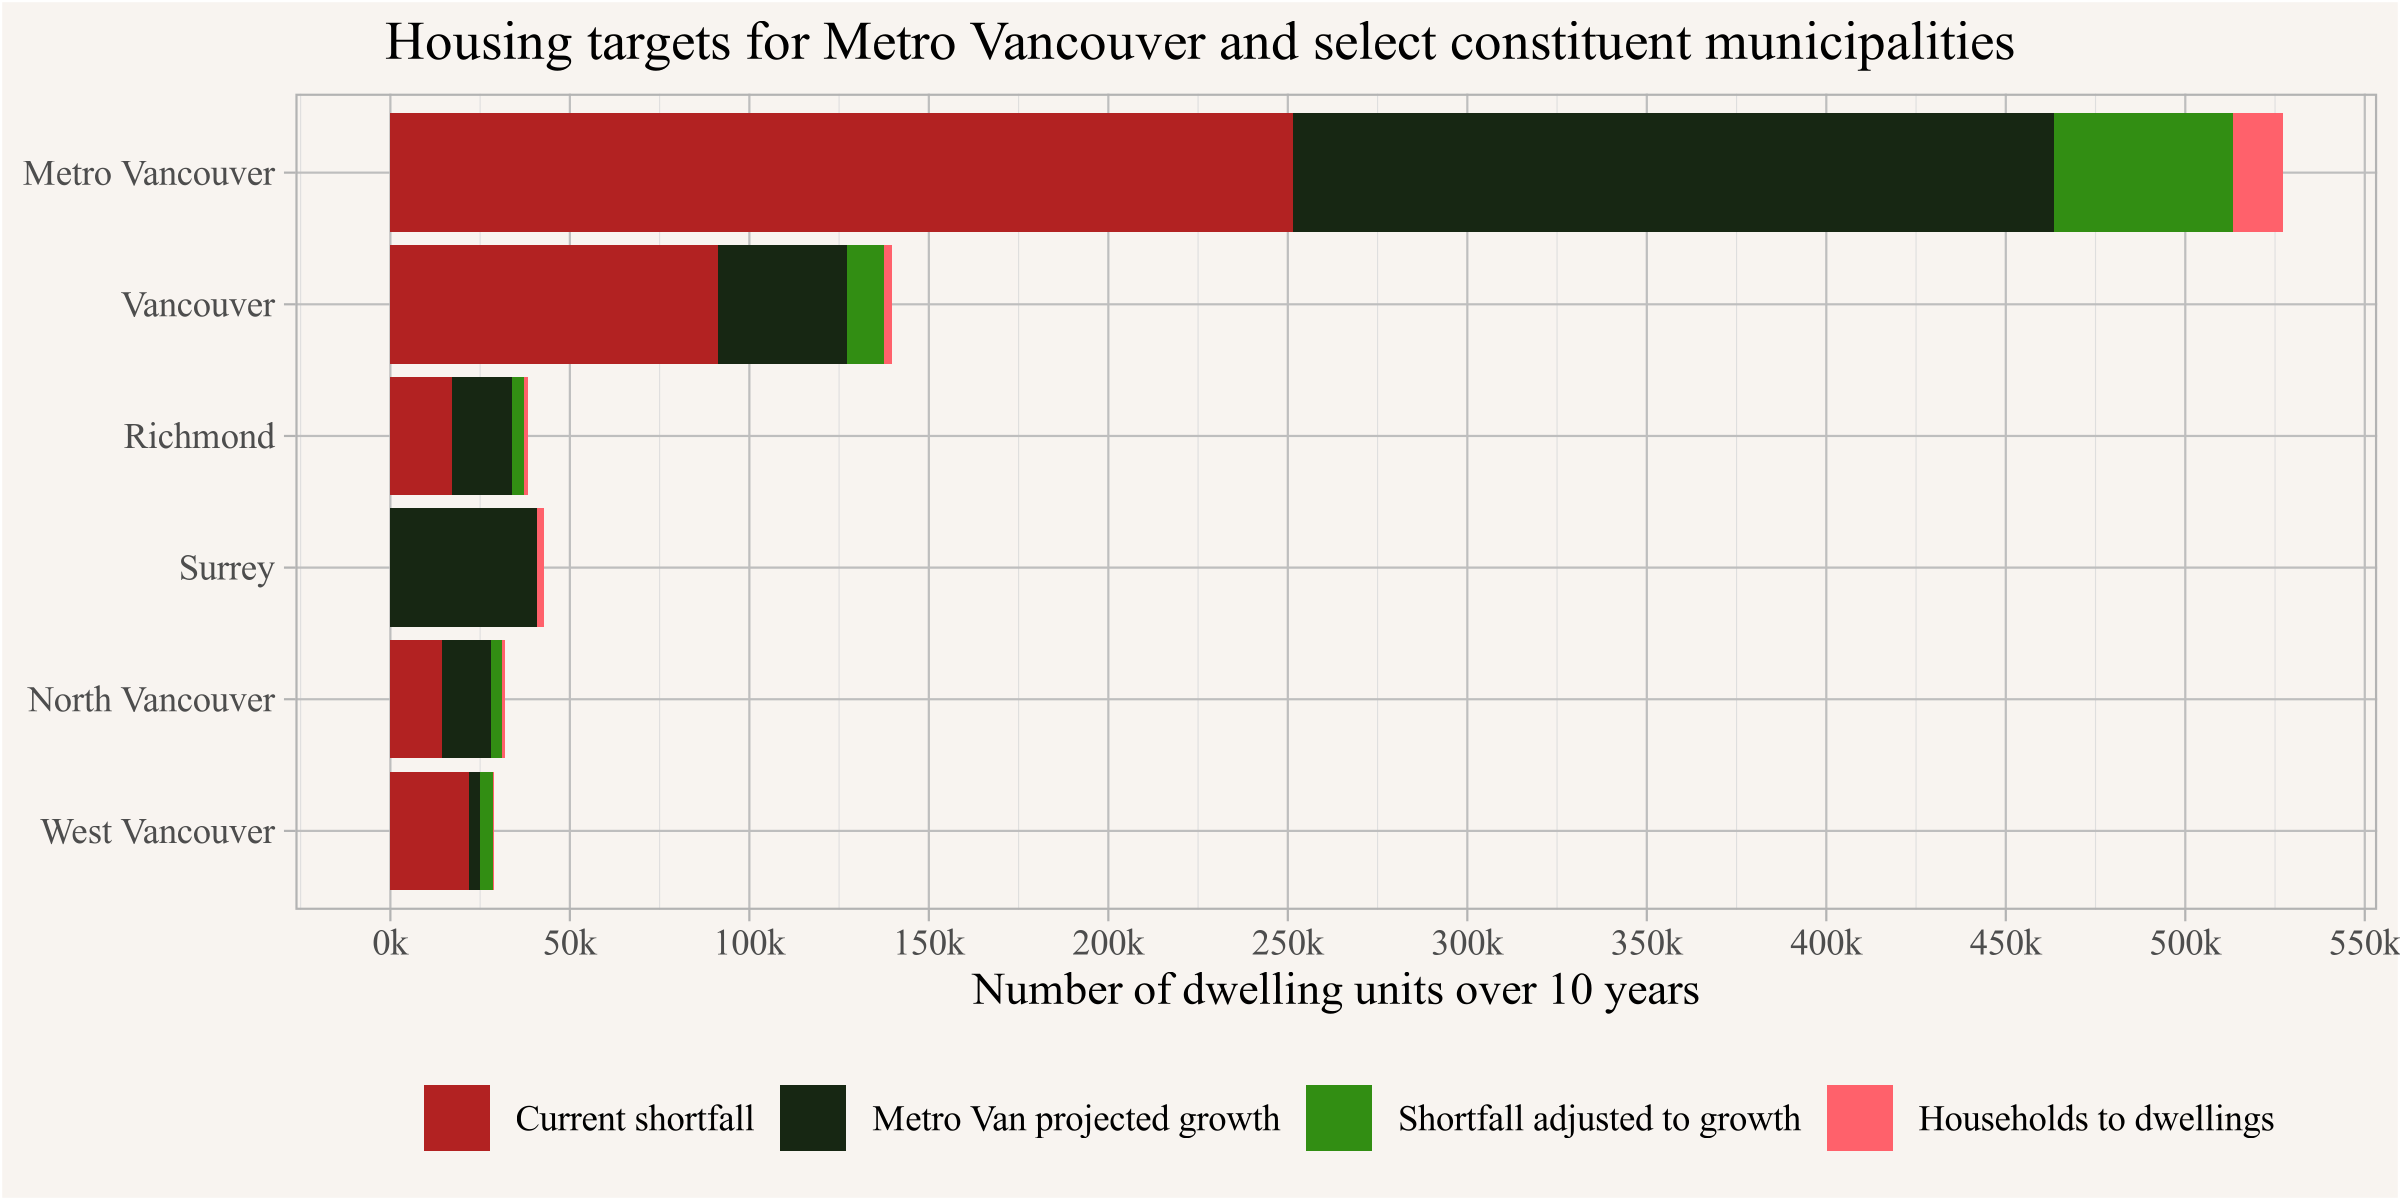
Here we break out the current shortfall estimated above, the current Metro Vancouver projections, our scaling up of Metro Vancouver projections by estimated shortfall to current stock, plus a factor to convert Metro Vancouver’s (mislabelled) household projections into dwelling projections. And voilà! Housing Targets!
This is all pretty rough and we have given up estimating the extent of our uncertainties here. Adding to those we already discussed we now add uncertainties in Metro Vancouver projections, and uncertainties how to adjust them for their methodological flaws. Since 2018 prices have climbed significantly, but so have construction costs. Incomes have also increased, as have interest rates. It would be worthwhile to redo this analysis for today’s conditions, while also paying more attention to compositional effects that lead to some curious quirks in the CMHC report. But that goes beyond the scope of a blog post.
For now this gives a baseline for planning to work with. It’s probably not realistic to expect half a million new dwelling units across Metro Vancouver, built in the places where people want to live. It takes time for the construction labour force to adjust, and redevelopment is contingent on properties selling. But it gives us a 10-year target to work toward.
Non-market housing
To close this section we note that we are talking about overall numbers, and using market mechanisms to estimate housing targets. People living in non-market housing don’t enter in the excess price metric we calculate as our wedge (renters enter implicitly, though not directly). But non-market housing is counted as part of the overall housing supply, and thus enters into our housing targets. The excess price metric implies that prices for new housing would fall by roughly 50% in Metro Vancouver, more in some sub-regions and less in others, and while these price reductions and related rent reductions would be expected to propagate in some way through the entire housing spectrum, it is not clear how exactly this would transform the lower end of the market. Nor is it clear the lower end of the market could meet everyone’s needs. We expect there would likely still be people left in inadequate or unaffordable housing, where dedicated non-market housing or cash supplements should be directed. But we also expect that alleviating overall housing shortages makes this work a lot easier to do.
Ideally after addressing how much overall housing is needed, we’d return to the second part of our question to ask how much non-market housing is needed to insure everyone has access to housing. We have some ideas for how to go about this, involving calculating the effects of meeting overall targets on rent distributions by housing type, and drawing upon household characteristics to figure out what proportion of households wouldn’t find needs met by these new distributions. But that involves a lot more work and assumptions, and we’ll leave it for another post.
For now we’ll note that the work and assumptions involved in jointly assessing overall housing targets and specifically non-market housing targets point toward a persistent shortcoming in many current housing needs assessments. A lot of housing needs estimates simply look at how the need of the current population is met by the available housing. Sometimes assessments are pegged to household income brackets and look at how many households in each bracket face housing struggles. This is useful for understanding how people are doing in the current housing environment, but only of limited use when coming up with housing targets, where projection into the future includes people not currently resident in the region and involves a lot of moving parts operating within a broader and interconnected housing system.
Upshot
Setting defensible housing targets is hard, but necessary under our current planning and development regime. If we’re going to essentially restrict all new multi-family housing by default, only allowing it after lengthy, expensive, and uncertain discretionary processes, then we really need targets to ensure we’re still building enough housing. In short, housing is good and we need it. We approach the construction of overall targets as a means of preventing planning from restricting the housing we need.
Here in Metro Vancouver, defensible housing targets suggest we need a lot more housing. Looking forward, we’ll need a lot more housing just to keep things from getting worse. And we’ll need a lot more than that in order to make things better. We might not be able to hit our targets, but we should aim high. The more housing we build, both market and non-market, the better things will get.
Of course our targets hinge on our values as human rights YIMBYs that housing is good, that people have a right to it, that allowing people to gather together in cities is good, and that new neighbours bring their own kind of amenity. Others may have different values, and consequently arrive at different targets. For instance, some people believe cities, acting as either private corporations or miniature states, have a right to exclude people to maximize utility for their current shareholders/property owners/citizens. This kind of thinking has become entrenched within current procedures in our planning and development regimes even as technocratic language obscures the underlying values argument. We can look around at access to housing across the region and see where our current procedures lead.
In short: Housing is good, actually. Our targets should reinforce that point, making it simpler and easier to add housing, especially in places where people want to live. In the long term we want to get away from targets and return to a housing system with ample outright capacity. Housing targets are a bridge to get us there from our current planning regime. We will still need projections, but their role will transition to give rough ranges of what to expect to ensure we have enough outright capacity, and make smart decisions around infrastructure planning.
As usual, the code for this post is available on GitHub for anyone to reproduce or adapt for their own purposes.
Update (additional scenario on effective cost assumptions, September 25, 2023)
One caveat on our analysis above is that we added in a sizable land component to the marginal cost of housing. This may not be necessary, in a market where the amount of housing is not constrained by municipal regulation (maybe where municipalities even encourage more housing!) a developer could build up until the marginal (social) cost of production, including profit, equals the the price the housing sells for. The additional “land component” of 20% was added rather ad-hoc, with the implicit understanding that when we are far away from equilibrium developers would not just build one more floor but many, and the effective marginal cost of adding these floors is higher than the marginal cost of adding just one floor. This could also capture costs associated with externalities of increasing population density, which also increases the cost of providing services that may not be captured at the current level of DCC/DCLs (assuming for simplicity those are set properly to cover only the current incremental cost of new construction). Lastly this accounts for risk, where developers may opt to build below the economically optimal height to avoid running the risk of not being able to recover all their costs if it turns out that prices are lower than anticipated at the time of completion.
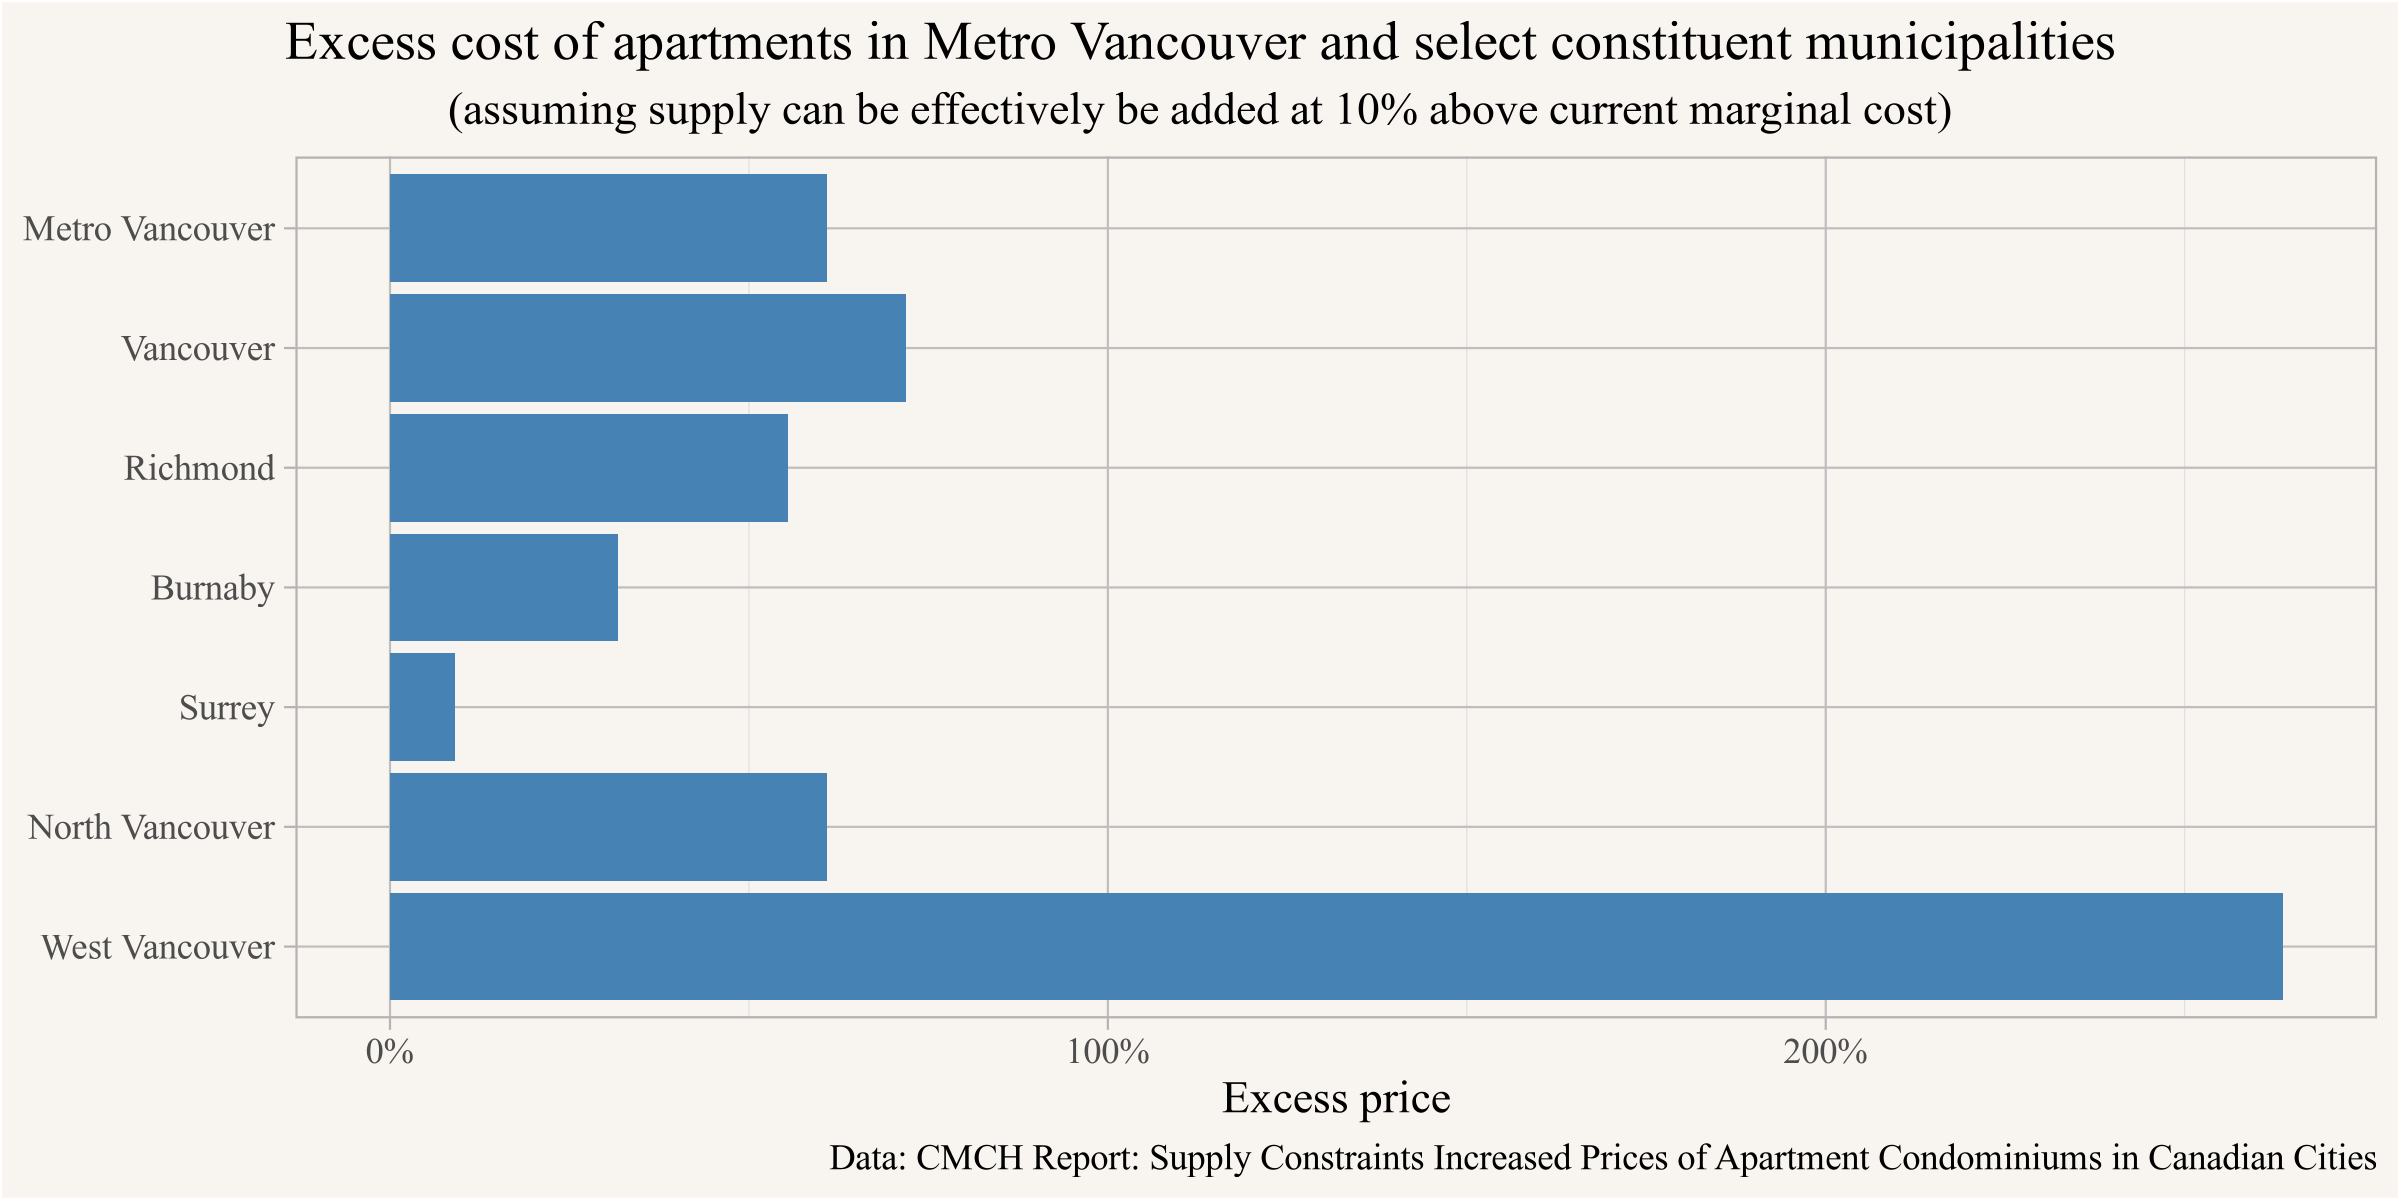
The 20% estimate is probably at the high end of the range of what could reasonably be expected here. To complement our previous estimates we re-run the analysis where we assume supply can be effectively added at 10% above current marginal cost of supply.
Under this scenario, we start out with a wedge that is ~10% larger.
This in turn gives significantly higher estimates of current shortfall.
When spacing this out over 10 years this leads to again significantly higher 10 year targets, with higher baselines but also higher correction to the projection housing demand.
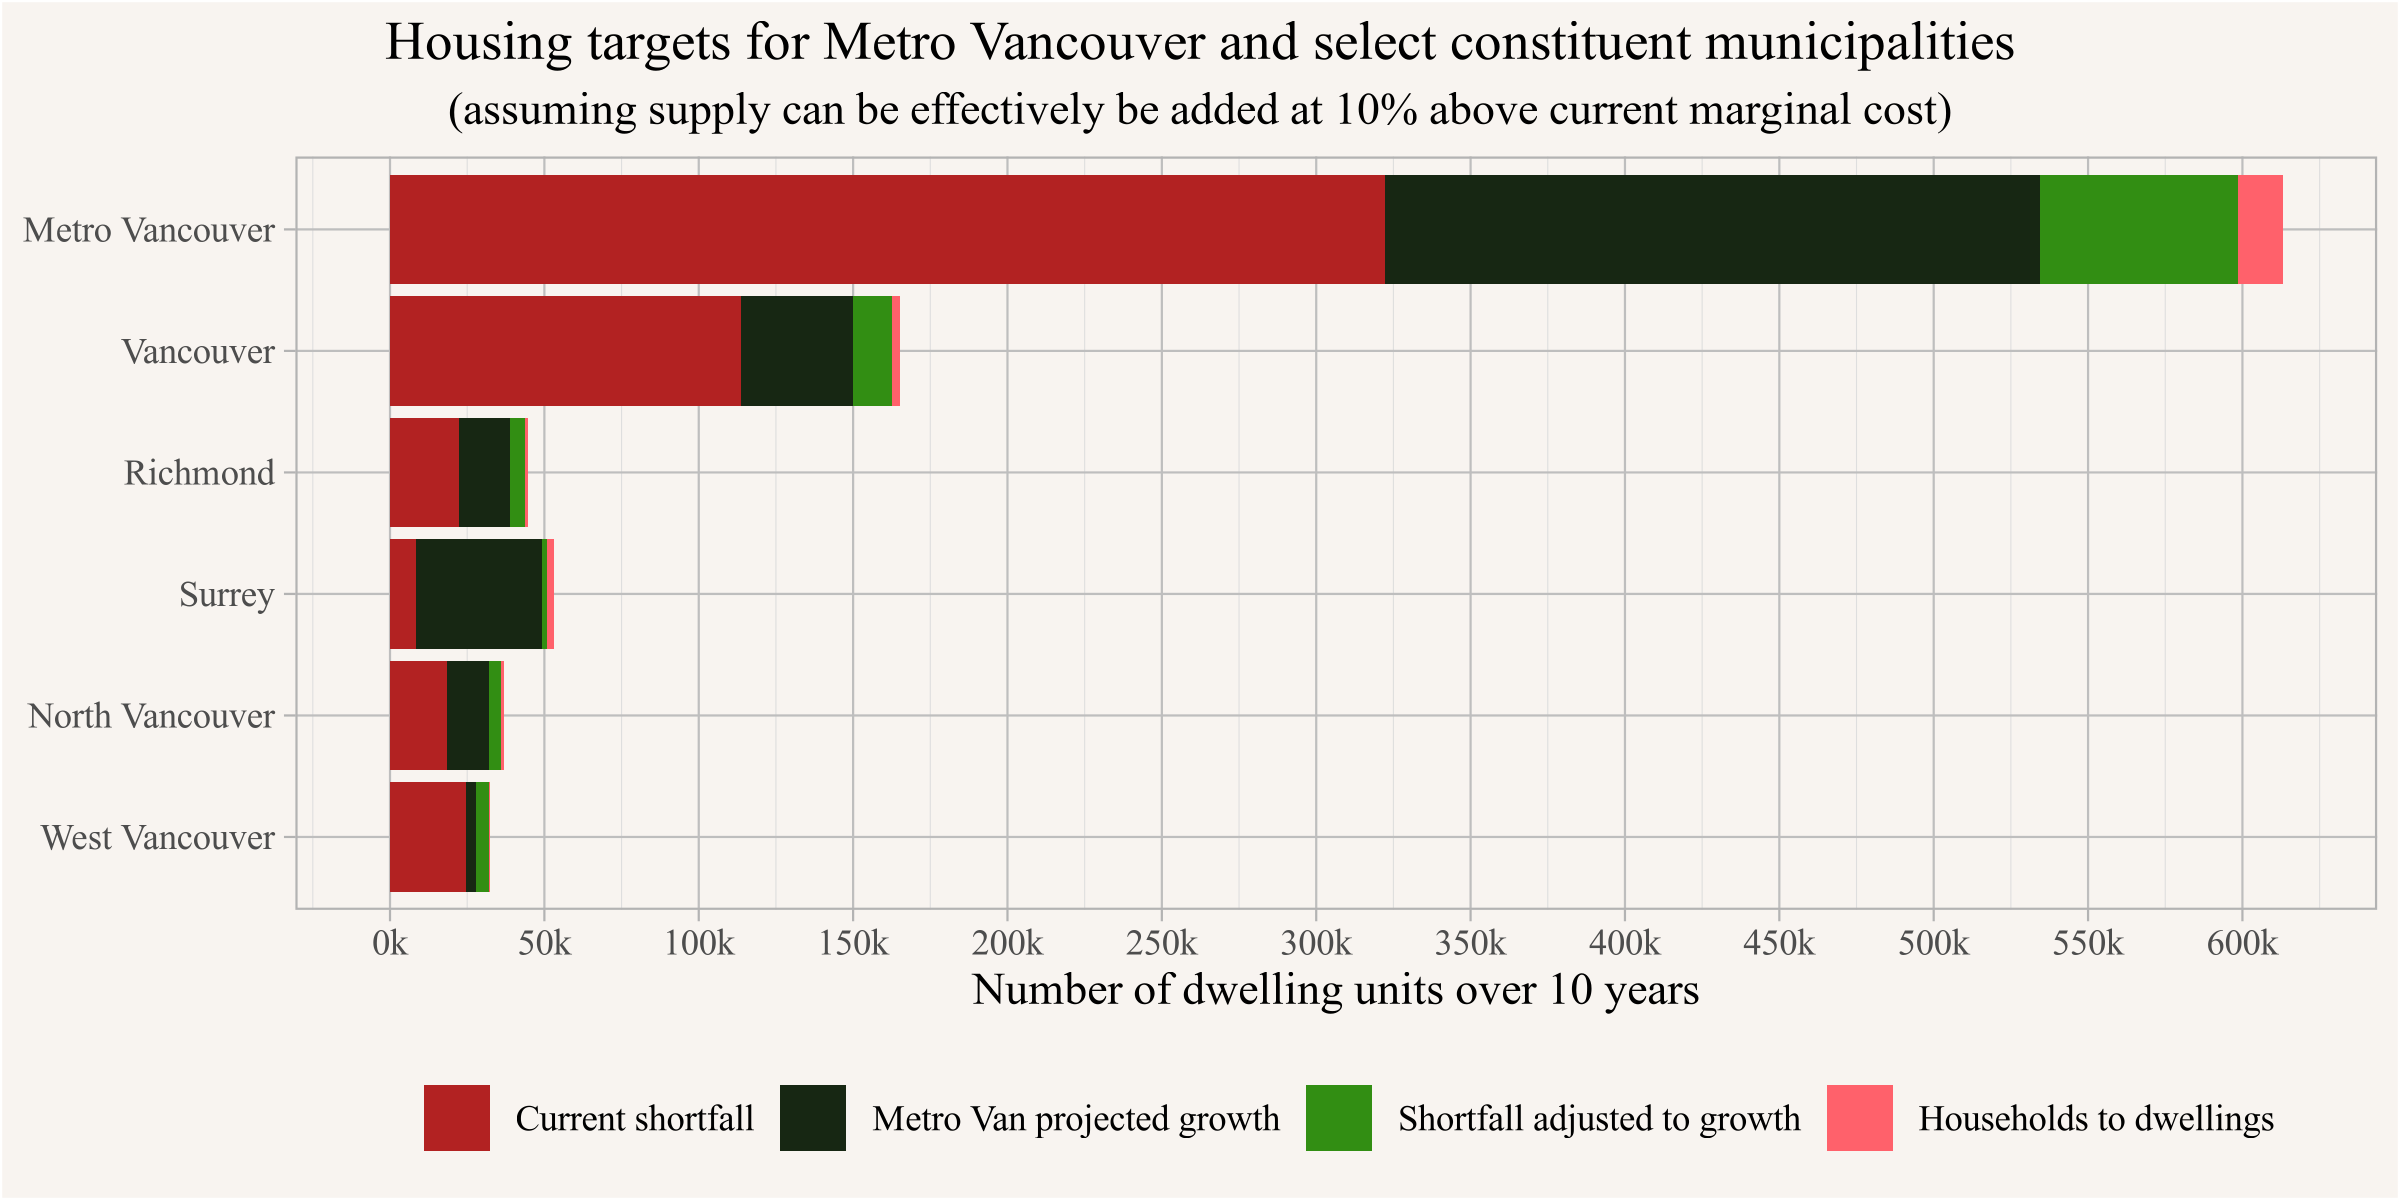
Assuming supply can be effectively added at the current marginal cost would locate more than half of BC’s current dwelling shortfall in Metro Vancouver, and accordingly finds a higher dwelling shortfall especially in the more expensive cities within Metro Vancouver. This is probably a more realistic estimate of targets to return the market to a condition where the total amount of housing is not overly constrained by municipal restrictions limiting new housing construction.
Reproducibility receipt
## [1] "2023-09-25 22:31:07 PDT"## Local: master /Users/jens/Documents/R/mountaindoodles
## Remote: master @ origin (https://github.com/mountainMath/doodles.git)
## Head: [164fe57] 2023-09-26: update (some of the) dead links in Metro Vancouver regimes post where Metro Vancouver website changed.## R version 4.3.0 (2023-04-21)
## Platform: aarch64-apple-darwin20 (64-bit)
## Running under: macOS Ventura 13.6
##
## Matrix products: default
## BLAS: /System/Library/Frameworks/Accelerate.framework/Versions/A/Frameworks/vecLib.framework/Versions/A/libBLAS.dylib
## LAPACK: /Library/Frameworks/R.framework/Versions/4.3-arm64/Resources/lib/libRlapack.dylib; LAPACK version 3.11.0
##
## locale:
## [1] en_US.UTF-8/en_US.UTF-8/en_US.UTF-8/C/en_US.UTF-8/en_US.UTF-8
##
## time zone: America/Vancouver
## tzcode source: internal
##
## attached base packages:
## [1] stats graphics grDevices utils datasets methods base
##
## other attached packages:
## [1] mountainmathHelpers_0.1.4 cancensus_0.5.6
## [3] lubridate_1.9.2 forcats_1.0.0
## [5] stringr_1.5.0 dplyr_1.1.2
## [7] purrr_1.0.1 readr_2.1.4
## [9] tidyr_1.3.0 tibble_3.2.1
## [11] ggplot2_3.4.2 tidyverse_2.0.0
##
## loaded via a namespace (and not attached):
## [1] sass_0.4.5 utf8_1.2.3 generics_0.1.3 blogdown_1.18
## [5] stringi_1.7.12 hms_1.1.3 digest_0.6.31 magrittr_2.0.3
## [9] timechange_0.2.0 evaluate_0.20 grid_4.3.0 bookdown_0.34
## [13] fastmap_1.1.1 jsonlite_1.8.4 fansi_1.0.4 scales_1.2.1
## [17] jquerylib_0.1.4 cli_3.6.1 rlang_1.1.1 munsell_0.5.0
## [21] withr_2.5.0 cachem_1.0.8 yaml_2.3.7 tools_4.3.0
## [25] tzdb_0.3.0 colorspace_2.1-0 vctrs_0.6.2 R6_2.5.1
## [29] git2r_0.32.0 lifecycle_1.0.3 pkgconfig_2.0.3 pillar_1.9.0
## [33] bslib_0.4.2 gtable_0.3.3 glue_1.6.2 xfun_0.39
## [37] tidyselect_1.2.0 rstudioapi_0.14 knitr_1.42 htmltools_0.5.5
## [41] rmarkdown_2.23 compiler_4.3.0Reuse
Citation
@misc{housing-targets.2023,
  author = {{von Bergmann}, Jens and Lauster, Nathan},
  title = {Housing Targets},
  date = {2023-06-27},
  url = {https://doodles.mountainmath.ca/posts/2023-06-27-housing-targets/},
  langid = {en}
}
