(Joint with Nathan Lauster and cross-posted at HomeFreeSociology)
Earlier this year a report from the NSW Productivity Commission in New South Wales, Australia, included a useful estimate to illustrate the harm that’s being done by height restrictions in Sydney. We thought it might be helpful to replicate the analysis for the Vancouver context.
Taking ideas from the report we set up a simple counter-factual question:
What would rents be if every apartment building built in Metro Vancouver over the past five years had been on average 20% taller?
TL;DR
We estimate that planning decisions preventing apartment buildings built in the past 5 years in Metro Vancouver from being on average 20% taller are resulting in an annual redistribution of income from renters to existing landlords on the order of half a billion dollars across the region via higher rents.
Economics 101
To answer our counter-factual question, it’s worth quickly reviewing some basic economics concept. Firstly, the demand curve for housing slopes down. That means that as the price or rent for housing falls, more people will look to buy or rent that housing. That generally leads more households to form, e.g. young adults moving out of their parent’s basement or out of roommate or other complex household situations to form their own households. And it could mean some people that would have otherwise been pushed out are now able to stay, and some people deterred by high housing costs can move into our region. And the reverse of all that will happen if housing prices and rents rise.
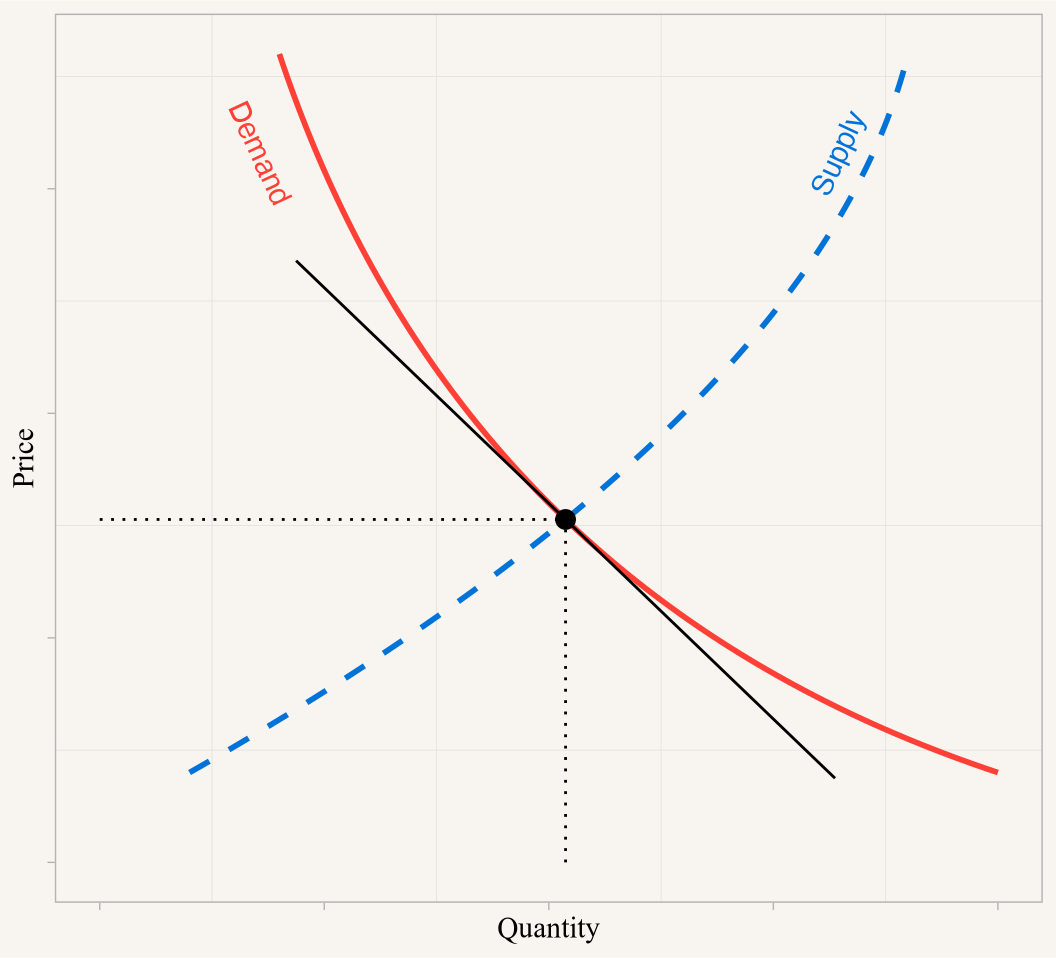
How do we know this? Economic theory tells us demand curves generally slope downward and both theory and data confirm the demographic implications. But to answer our question we need to quantify this more precisely. If we increase our housing stock by some percentage, by what percentage will prices and rents change? This is the (inverse) price elasticity of demand. It is the (inverse of the) slope to the demand curve, shown in black in the plot below, re-expressed in terms of the percentage change of demand and supply.

These type of elasticities are notoriously difficult to identify. We are interested in the “long run” effect, so effects after markets adjust to short-term supply shocks. The report we cite above uses an estimate of -0.4 for Sydney, and estimates done by CMHC for the whole province of British Columbia suggest a similar value of around -0.5. We have previously estimated the price elasticity of demand for Metro Vancouver to be around -0.25, albeit with large confidence intervals. For this analysis we will use the value of -0.4 which is closer to what the broader literature suggests, with the understanding that this estimate comes with uncertainties and actual effects might be a bit larger or a bit smaller. For reference, an estimate of -0.4 is equivalent to calculating that a 1% increase in supply would result in a 2.5% decrease in prices and rents. Since ours is a point estimate of price elasticity, these effects compound, and a 10% increase in supply would result in a 21% decrease in prices and rents.
We note that the supply curve in the graph above is to be taken with a grain of salt. While the demand curve for housing works roughly as one would expect, insofar as housing is largely allocated via market mechanisms, the supply of housing works differently. To list just two caveats, housing is a durable good, with the market largely composed of existing, rather than newly produced, housing. More importantly for our purposes, there are strong external constraints on how much new supply can be added through newly produced housing. Even where supply curves suggest developers would happily add more dwellings in response to prices, planning often prevents them from doing so.
Height restrictions in Vancouver
For this post height limitation plays the role of a simple proxy for the restrictiveness of zoning. A CMHC report from 2019 has found that height restrictions are strongly binding in Vancouver, meaning a developer would be very likely to build taller if they were allowed to do so.
The effect of zoning restrictions is generally difficult to observe when only looking at development proposals that make it into the city approval process, but we can still see some of the effect of height restrictions play out there.
For example the development at 1535-1557 Grant Street was initially proposed as a 6 storey apartment building as in principle enabled under the Grandview-Woodland community plan, but was subsequently cut down to 5 storeys in “direct response” to Urban Design Panel & staff review.
The project at 1805 Larch brought forward under the Moderate Income Rental Housing Pilot Project went from six to five due to opposition at the pre-application open house and was compelled to provide more parking spaces.

The development around 708 Renfrew Street proposed under the Affordable Housing Choices (AHC) Policy did not see a reduction in the nominal number of storeys, but saw significant massing changes with the original proposal 43% times larger than the version that eventually got approved. However, the reduction in housing units seems to have ultimately proven fatal to the project’s viability, and the developer abandoned the project.
This motivates our counter-factual of trying to understand what would have happened if recently constructed apartment buildings were on average 20% taller, and had (roughly) 20% more units.
Apartment construction
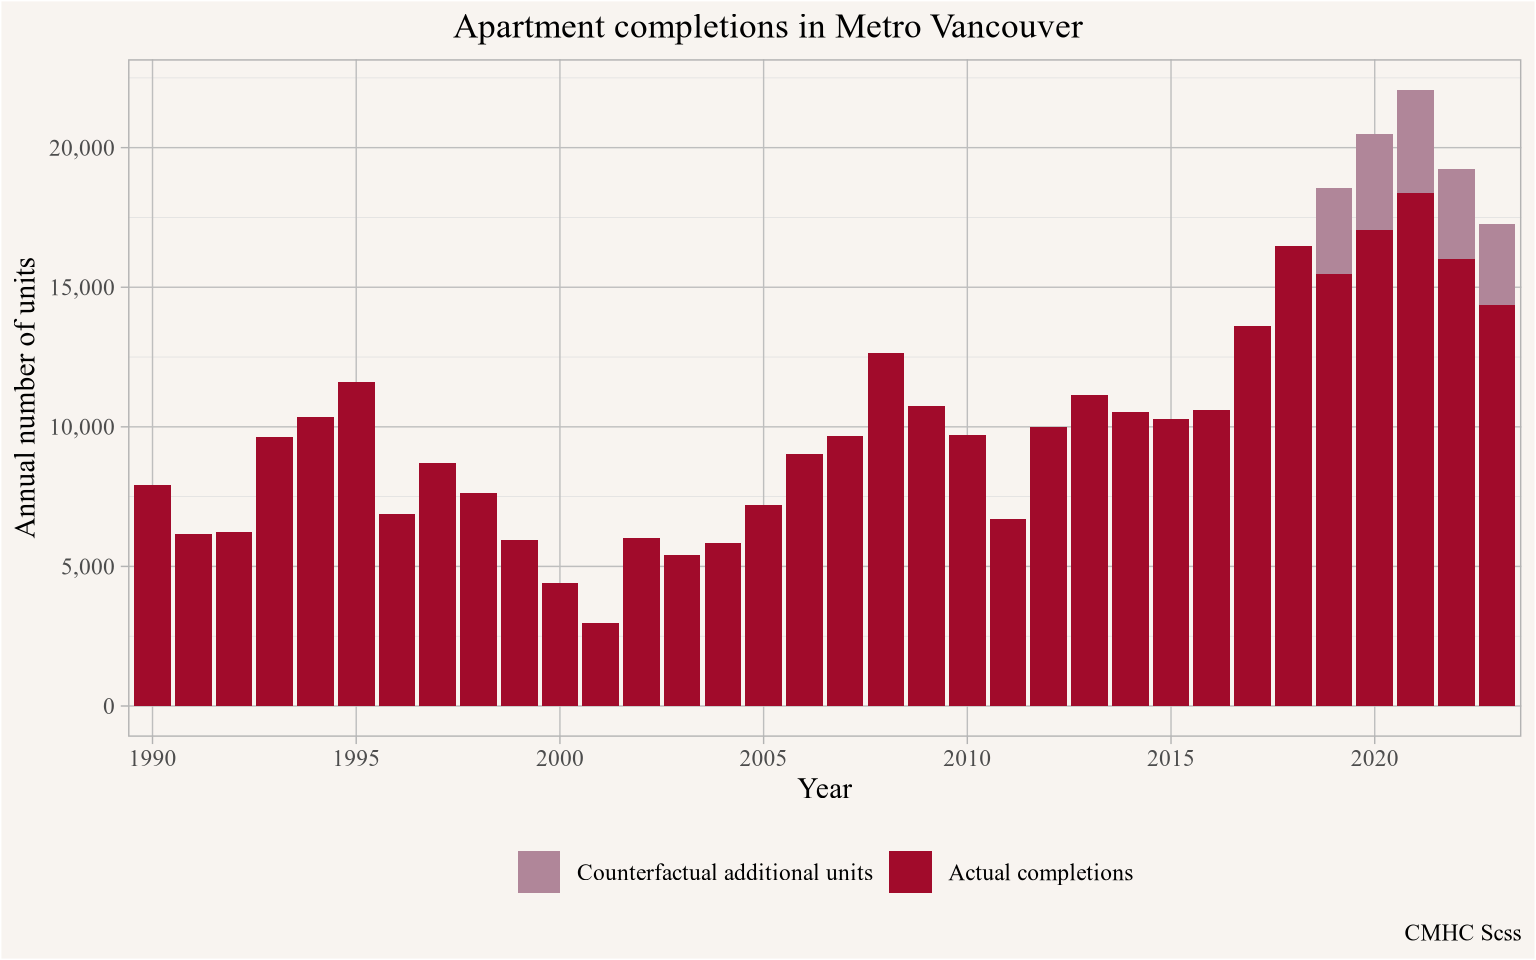
To estimate the impact we look at historical apartment construction in Metro Vancouver, and hypothetically add 20% more units for the past 5 years. This is a rough estimate of what taller buildings could provide, of course. The math linking unit numbers to heights can be more complicated. Taller buildings might’ve enabled more projects (like 708 Renfrew) to “pencil” potentially adding even more units than our estimate. On the other hand, CMHC also counts secondary suites as “apartment units”, which could lead to us overestimating, but that likely only causes a small distortion in the stats.

Overall, there were 81,317 apartment completions in the past 5 years. Had the buildings containing these apartments been on average 20% taller there would have been 16,263 additional housing units, resulting in an 1.5% increase in total housing stock in Metro Vancouver. Using our common demand elasticity assumption, that additional housing supply would have led to a reduction of prices and rents by 3.7%.
Impact on rents
To make this a little more concrete, we can use the average rent for 2-bedroom units in Metro Vancouver with a new rental contract in the preceding year as a proxy for the average rent in the region and estimate the counter-factual rents.
CMHC is now collecting information of rents of units with new rental contracts, and the average such 2-bedroom unit in Metro Vancouver rented for $2,601 a month in 2023. If apartment buildings built during the past 5 years had been on average 20% taller, then the average rent would have been $93 a month lower, saving the average new renter about $1,120 a year. For comparison, BC’s new Renter’s Tax Credit maxes out at $400 per year.
Rents for long-time tenants tend to be lower than for new tenants under BC’s rent control, reflecting Metro Vancouver’s lengthy history of low vacancy rates driving rents for new contracts ever higher. Correspondingly, for tenants under existing rent-controlled tenancy agreements the benefits of adding supply are less direct than for new tenants. Long-time tenants primarily experience additional supply effects in terms of increased choice and lower rents if they are looking to change their living arrangements because of a lower overall moving penalty. But they also potentially gain in their landlords becoming a little less keen to encourage turnover.
At this point it is useful to point out that the aggregate effect of the added counter-factual housing is a net transfer of wealth from existing landlords to tenants. Rent control delays some of these effects, but scaling the rent saving over the existing renter households in Metro Vancouver yields a net transfer of $442M a year from existing landlords to tenants in terms of aggregate rent savings.
Impact on broader housing outcomes
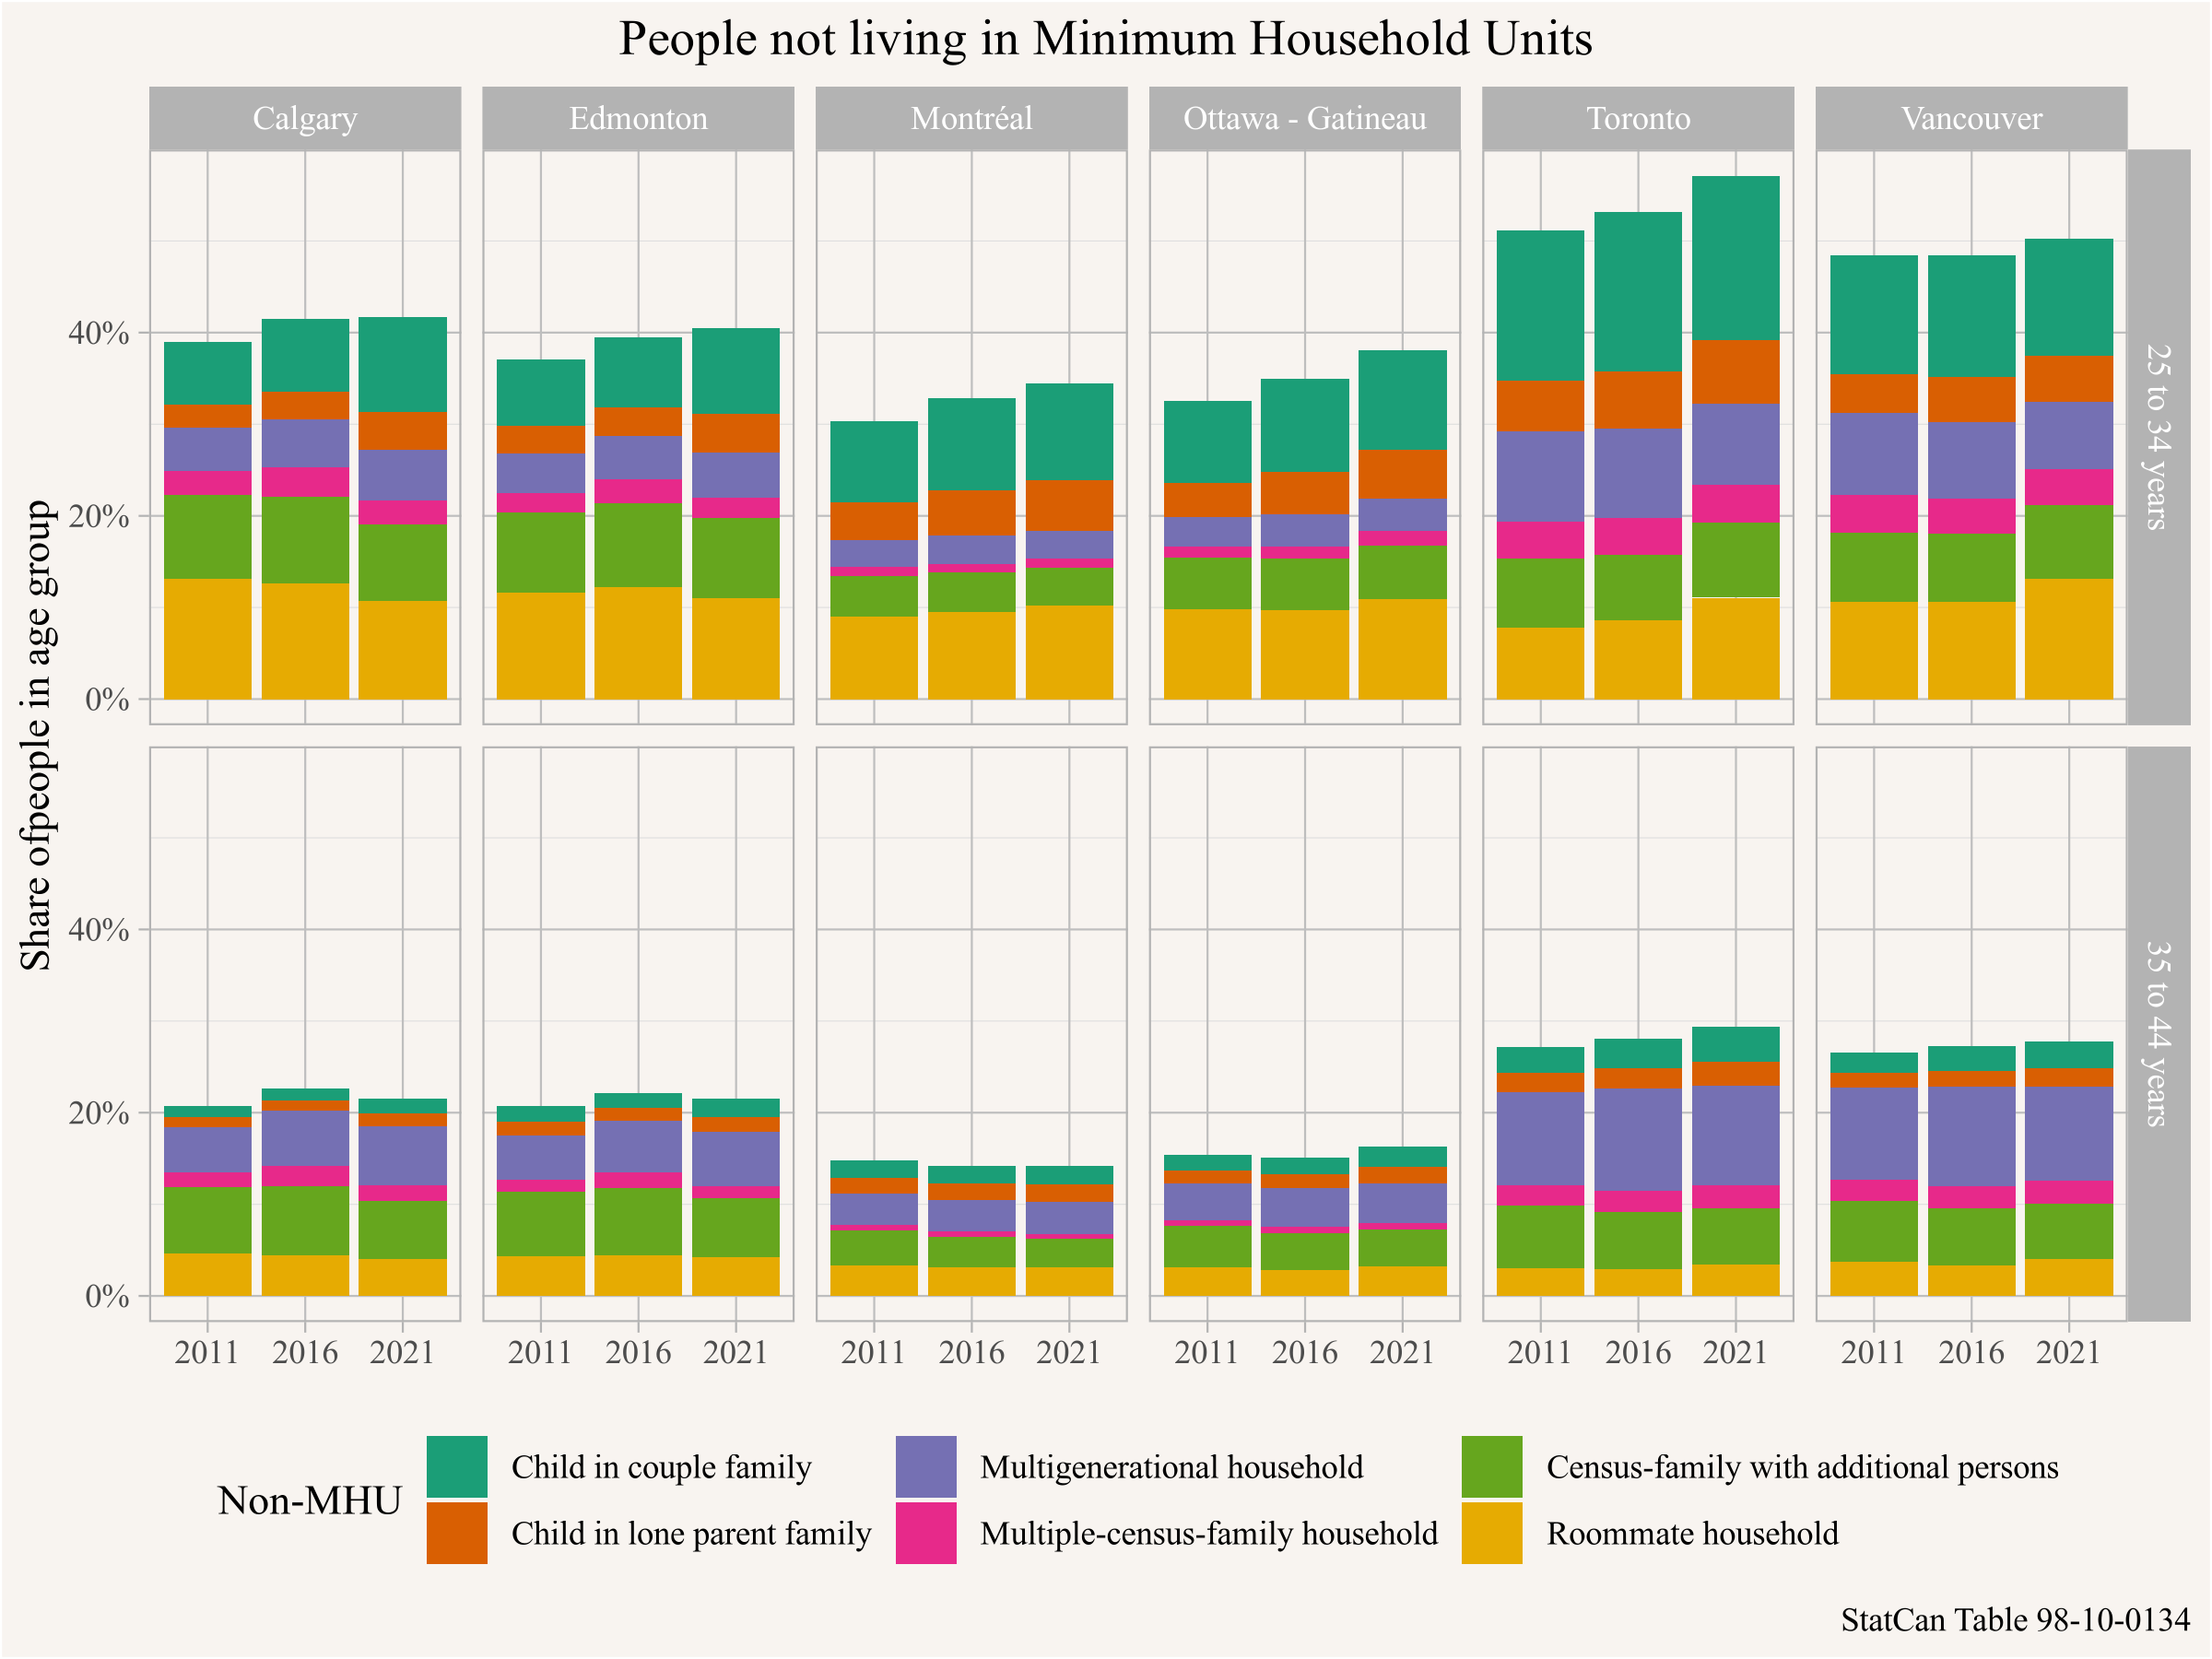
On top of that, the increase in housing stock will allow existing households to who are unhappy with their current living arrangements, for example adults living with parents, or roommates, or other complex living arrangements, to move into their own units. Toronto and Vancouver have elevated rates of such young adults not in “Minimal Household units”, and new housing units are needed for these young adults to form their own households.

This under-appreciated benefit of increasing the housing stock allows individuals and families to better match their housing to their needs and preferences.
Conclusion
One might be inclined to think that a reduction of average rents from $2,601 to $2,508 a month is quite small. And we agree and believe that our counter-factual increase in new housing by 20% is very modest. We should aim for a much larger increase in housing. Previous analysis we performed suggests developers would have built enough units to increase our housing stock by 250,000 units, or 23% if municipalities had let them. This would have resulted in a reduction of average rents by 40%, thus bringing Vancouver rents in line with Canada-wide average CMA rent and resulting in enormous benefits to renters.
Our counter-factuals are purely hypothetical in the sense that we cannot turn back time and allow apartments that have already been built to be taller. But they illustrate the the benefits of building more housing, and the harm of restricting the amount of housing getting built.
We suspect that many municipal planners and politicians don’t understand the extent of the harm to renters or new buyers they are causing by reducing the height of buildings, or more generally by restricting the supply of housing. Planning documents where planners give reasons for significantly reducing height and form of proposed buildings, like the one for the MIRHPP at Larch and 3rd, are often justified largely on aesthetic grounds (“Substantial massing change is required to provide a compatible form of development […] in relation to the surrounding RT-8 and RM-4 developments”) and do not seem to fully weigh or even consider the tradeoffs of the effects on rents and broader housing outcomes, even in cases like this that contain dedicated below-market units.
The other takeaway from this analysis is that affordability comes from supply effects. In terms of affordability, the purpose of new housing is to make old housing cheaper. Often we hear people ask that new housing be affordable, or that new housing should be targeted at specific income groups. This is entirely appropriate and important when it comes to dedicated non-market housing. But trying to target new market housing at specific income bands fundamentally misunderstands housing, and is likely counter-productive. Or in the words of Michael Manville:
If we believe that cheap housing matters and expensive housing doesn’t, and we act on that belief, our primary accomplishment will be to make our cheap housing expensive.
And not coincidentally we have been doing a bang-on job at making our cheap housing expensive across Metro Vancouver.
As usual, the code for this post is available on GitHub for anyone to reproduce or adapt for their own purposes.
Reproducibility receipt
## [1] "2024-04-11 13:56:07 PDT"## Local: master /Users/jens/R/mountaindoodles
## Remote: master @ origin (https://github.com/mountainMath/doodles.git)
## Head: [0ec8ecd] 2024-01-17: fix latex snafu## R version 4.3.2 (2023-10-31)
## Platform: aarch64-apple-darwin20 (64-bit)
## Running under: macOS Sonoma 14.4.1
##
## Matrix products: default
## BLAS: /Library/Frameworks/R.framework/Versions/4.3-arm64/Resources/lib/libRblas.0.dylib
## LAPACK: /Library/Frameworks/R.framework/Versions/4.3-arm64/Resources/lib/libRlapack.dylib; LAPACK version 3.11.0
##
## locale:
## [1] en_US.UTF-8/en_US.UTF-8/en_US.UTF-8/C/en_US.UTF-8/en_US.UTF-8
##
## time zone: America/Vancouver
## tzcode source: internal
##
## attached base packages:
## [1] stats graphics grDevices utils datasets methods base
##
## other attached packages:
## [1] mountainmathHelpers_0.1.4 cmhc_0.2.8
## [3] cancensus_0.5.8 lubridate_1.9.3
## [5] forcats_1.0.0 stringr_1.5.1
## [7] dplyr_1.1.4 purrr_1.0.2
## [9] readr_2.1.4 tidyr_1.3.0
## [11] tibble_3.2.1 ggplot2_3.5.0
## [13] tidyverse_2.0.0
##
## loaded via a namespace (and not attached):
## [1] gtable_0.3.4 xfun_0.41 bslib_0.6.1 htmlwidgets_1.6.4
## [5] tzdb_0.4.0 vctrs_0.6.5 tools_4.3.2 generics_0.1.3
## [9] parallel_4.3.2 curl_5.2.0 fansi_1.0.6 highr_0.10
## [13] cluster_2.1.4 pkgconfig_2.0.3 data.table_1.14.10 checkmate_2.3.1
## [17] lifecycle_1.0.4 git2r_0.33.0 compiler_4.3.2 farver_2.1.1
## [21] munsell_0.5.0 htmltools_0.5.7 sass_0.4.8 yaml_2.3.7
## [25] htmlTable_2.4.2 Formula_1.2-5 crayon_1.5.2 pillar_1.9.0
## [29] jquerylib_0.1.4 cachem_1.0.8 Hmisc_5.1-1 rpart_4.1.21
## [33] tidyselect_1.2.0 digest_0.6.33 stringi_1.8.3 bookdown_0.37
## [37] labeling_0.4.3 rprojroot_2.0.4 fastmap_1.1.1 grid_4.3.2
## [41] here_1.0.1 colorspace_2.1-0 cli_3.6.2 magrittr_2.0.3
## [45] base64enc_0.1-3 utf8_1.2.4 foreign_0.8-85 withr_2.5.2
## [49] scales_1.3.0 backports_1.4.1 bit64_4.0.5 timechange_0.2.0
## [53] httr_1.4.7 rmarkdown_2.25 bit_4.0.5 nnet_7.3-19
## [57] gridExtra_2.3 blogdown_1.19 sanzo_0.1.0 hms_1.1.3
## [61] evaluate_0.23 knitr_1.45 rlang_1.1.3 glue_1.7.0
## [65] vroom_1.6.5 rstudioapi_0.15.0 jsonlite_1.8.8 R6_2.5.1Reuse
Citation
@misc{what-if-recent-apartment-buildings-in-vancouver-were-20-taller.2024,
  author = {{von Bergmann}, Jens and Lauster, Nathan},
  title = {What If Recent Apartment Buildings in {Vancouver} Were 20\%
    Taller?},
  date = {2024-04-11},
  url = {https://doodles.mountainmath.ca/posts/2024-04-11-what-if-recent-apartment-buildings-in-vancouver-were-20-taller/},
  langid = {en}
}
