In 2015 CensusMapper got launched onto the national stage with our Trick-or-Treat maps that got viewed by 150,000 Canadians across the country within just three days. In 2016 we updated our map with some predictive modeling as the 2011 data it was based on was already 5 years old. This year we got the fresh 2016 data that we are serving straight-up.
We again offer our standard Halloween trifecta:
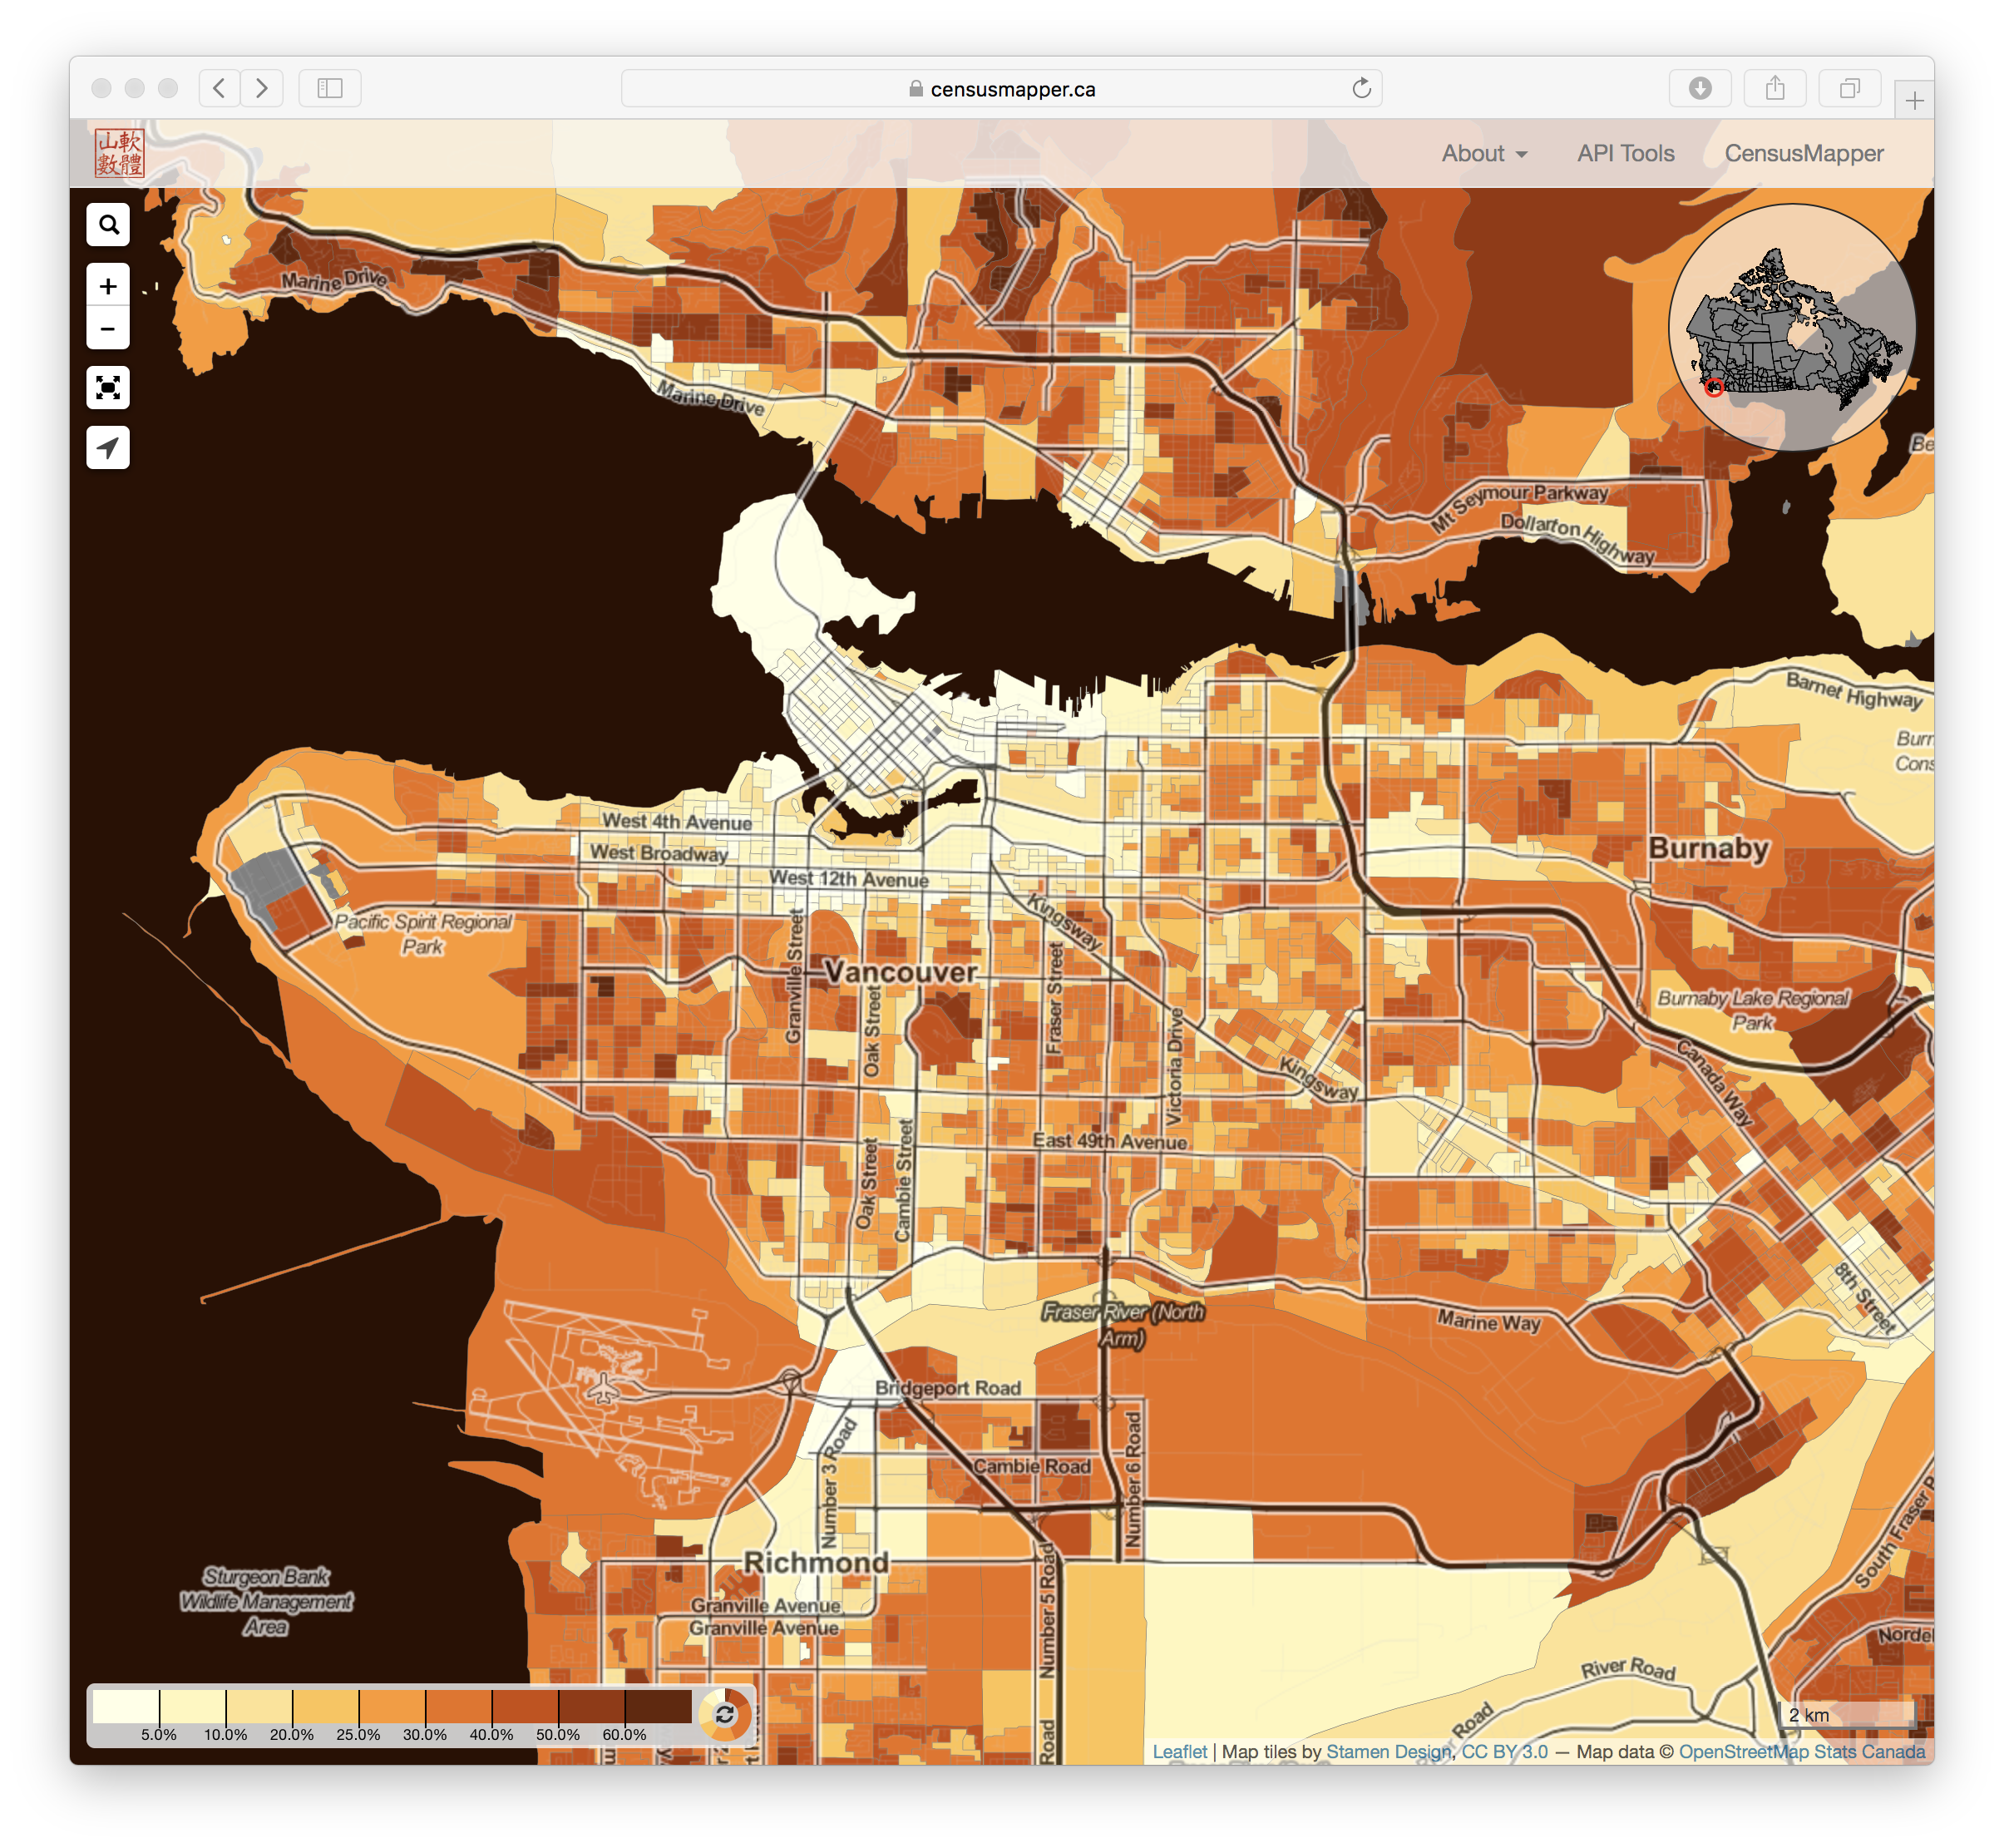
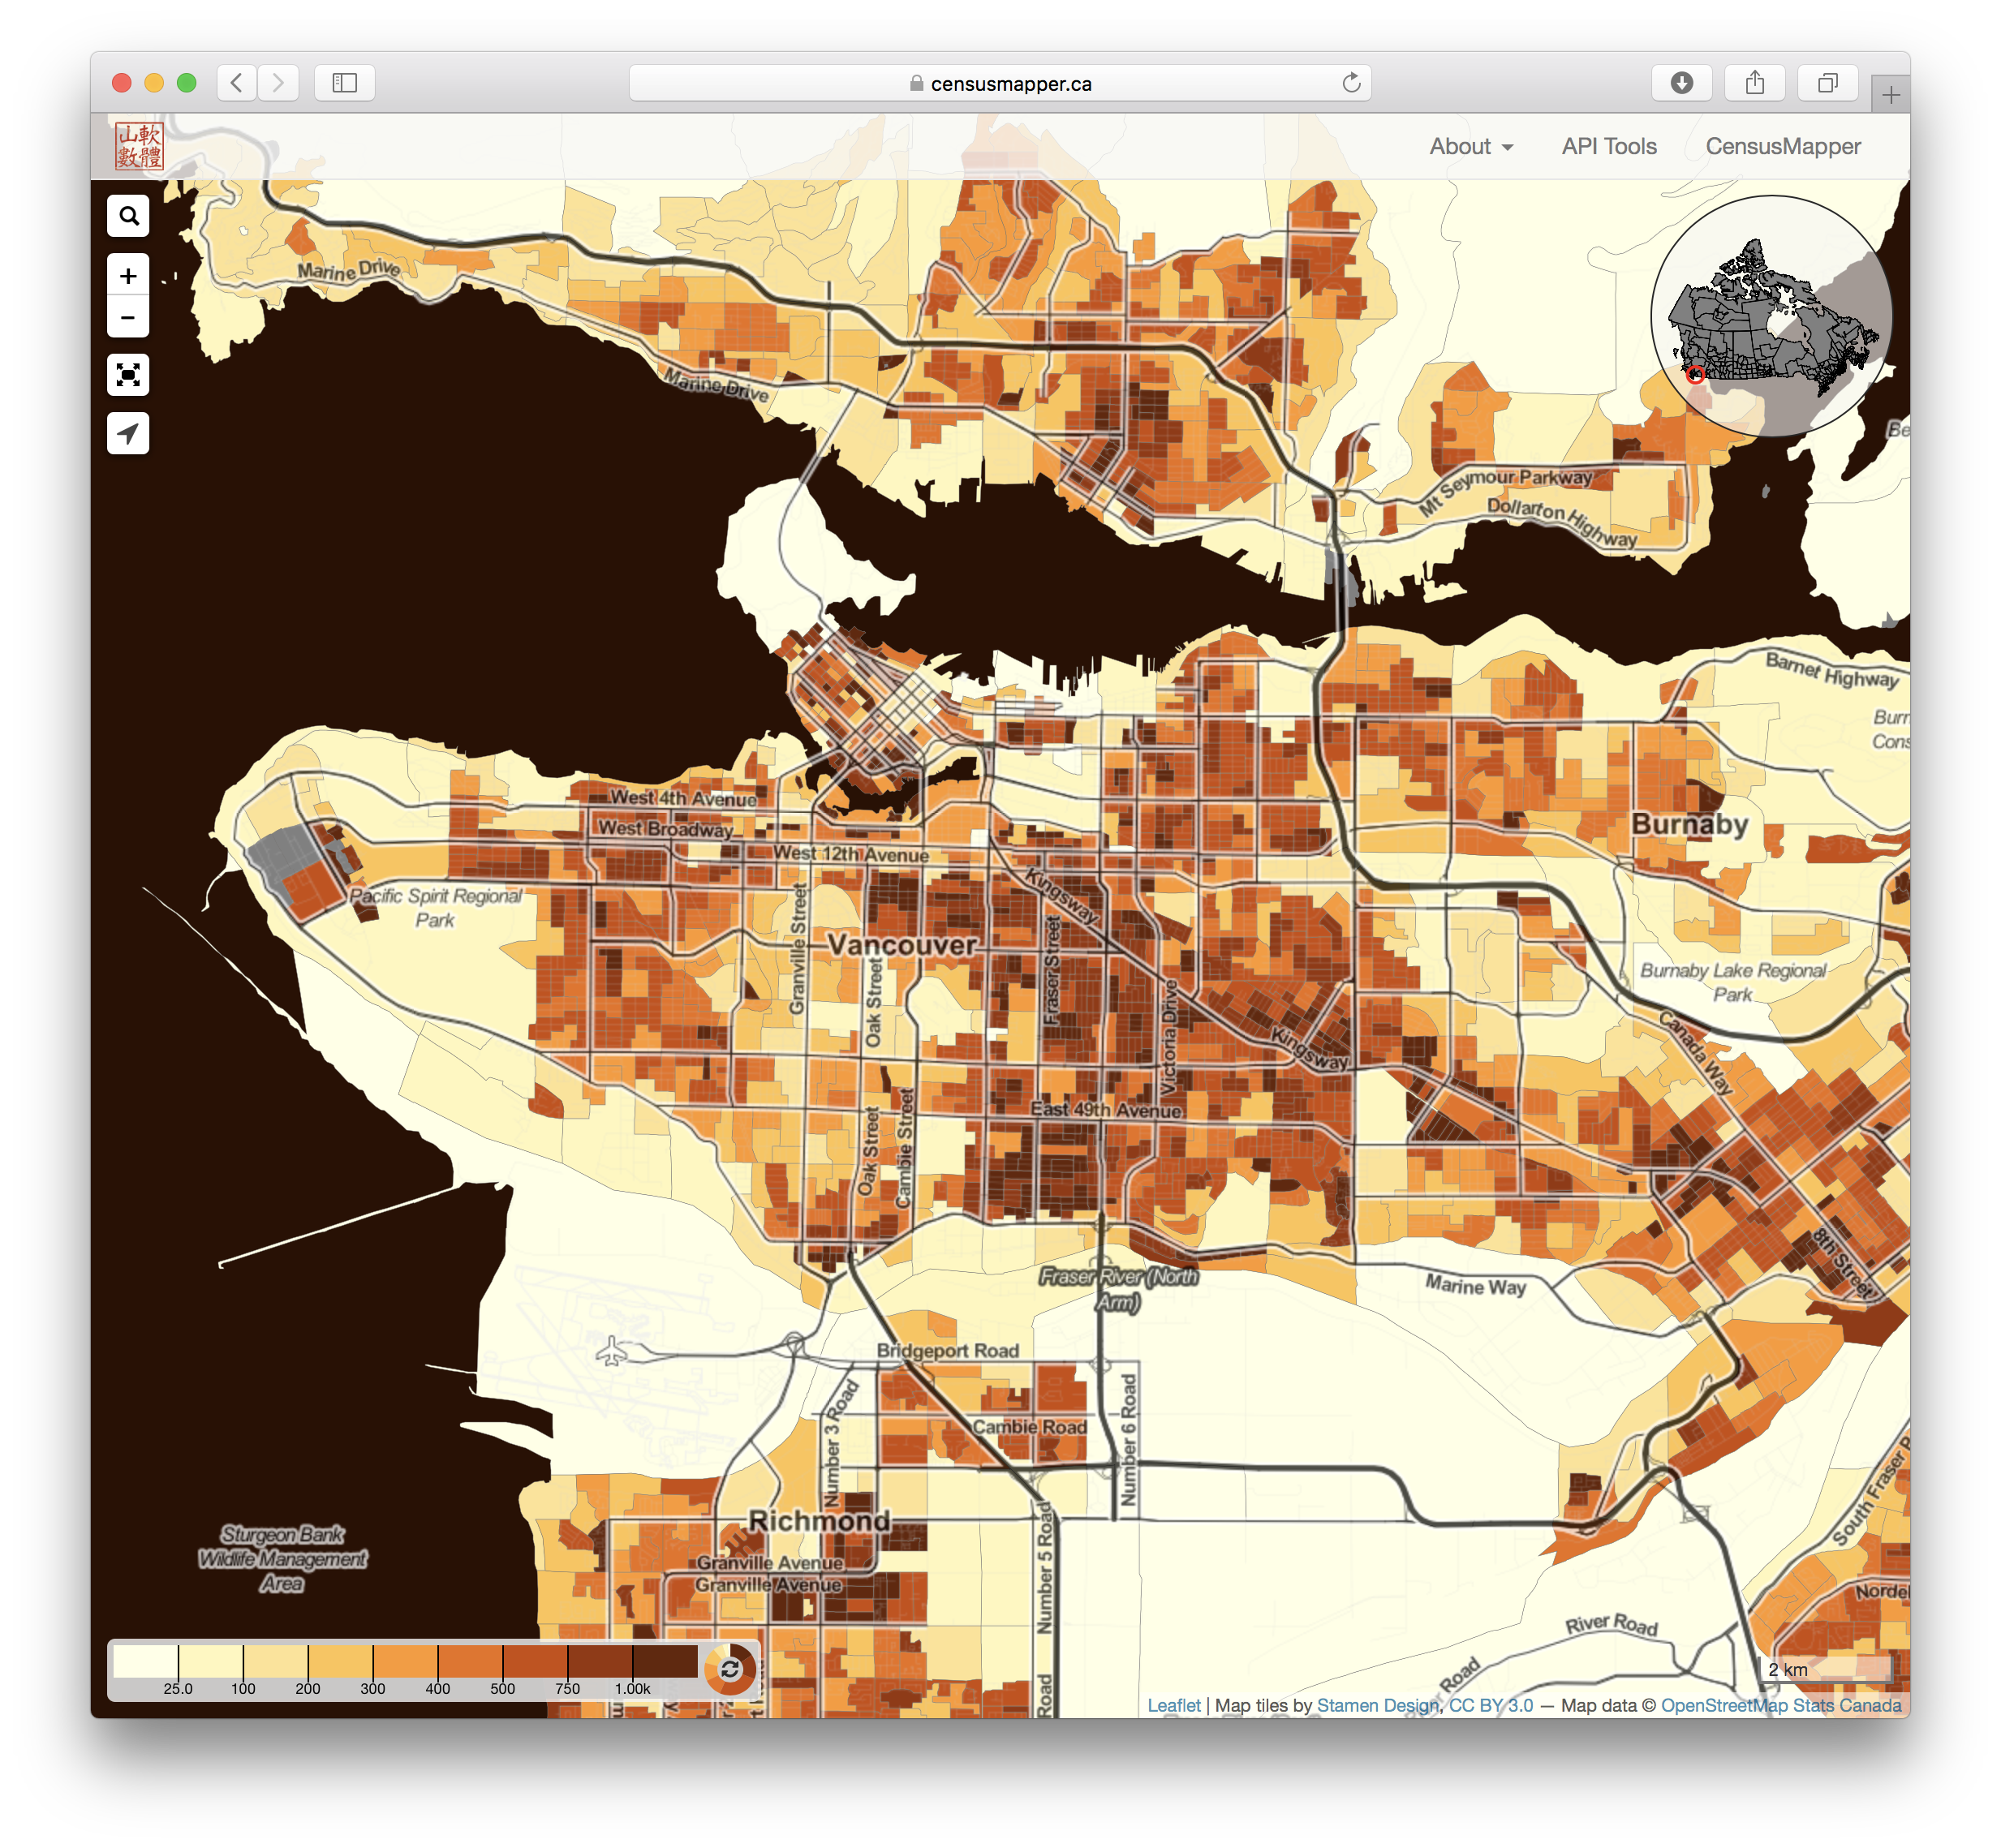
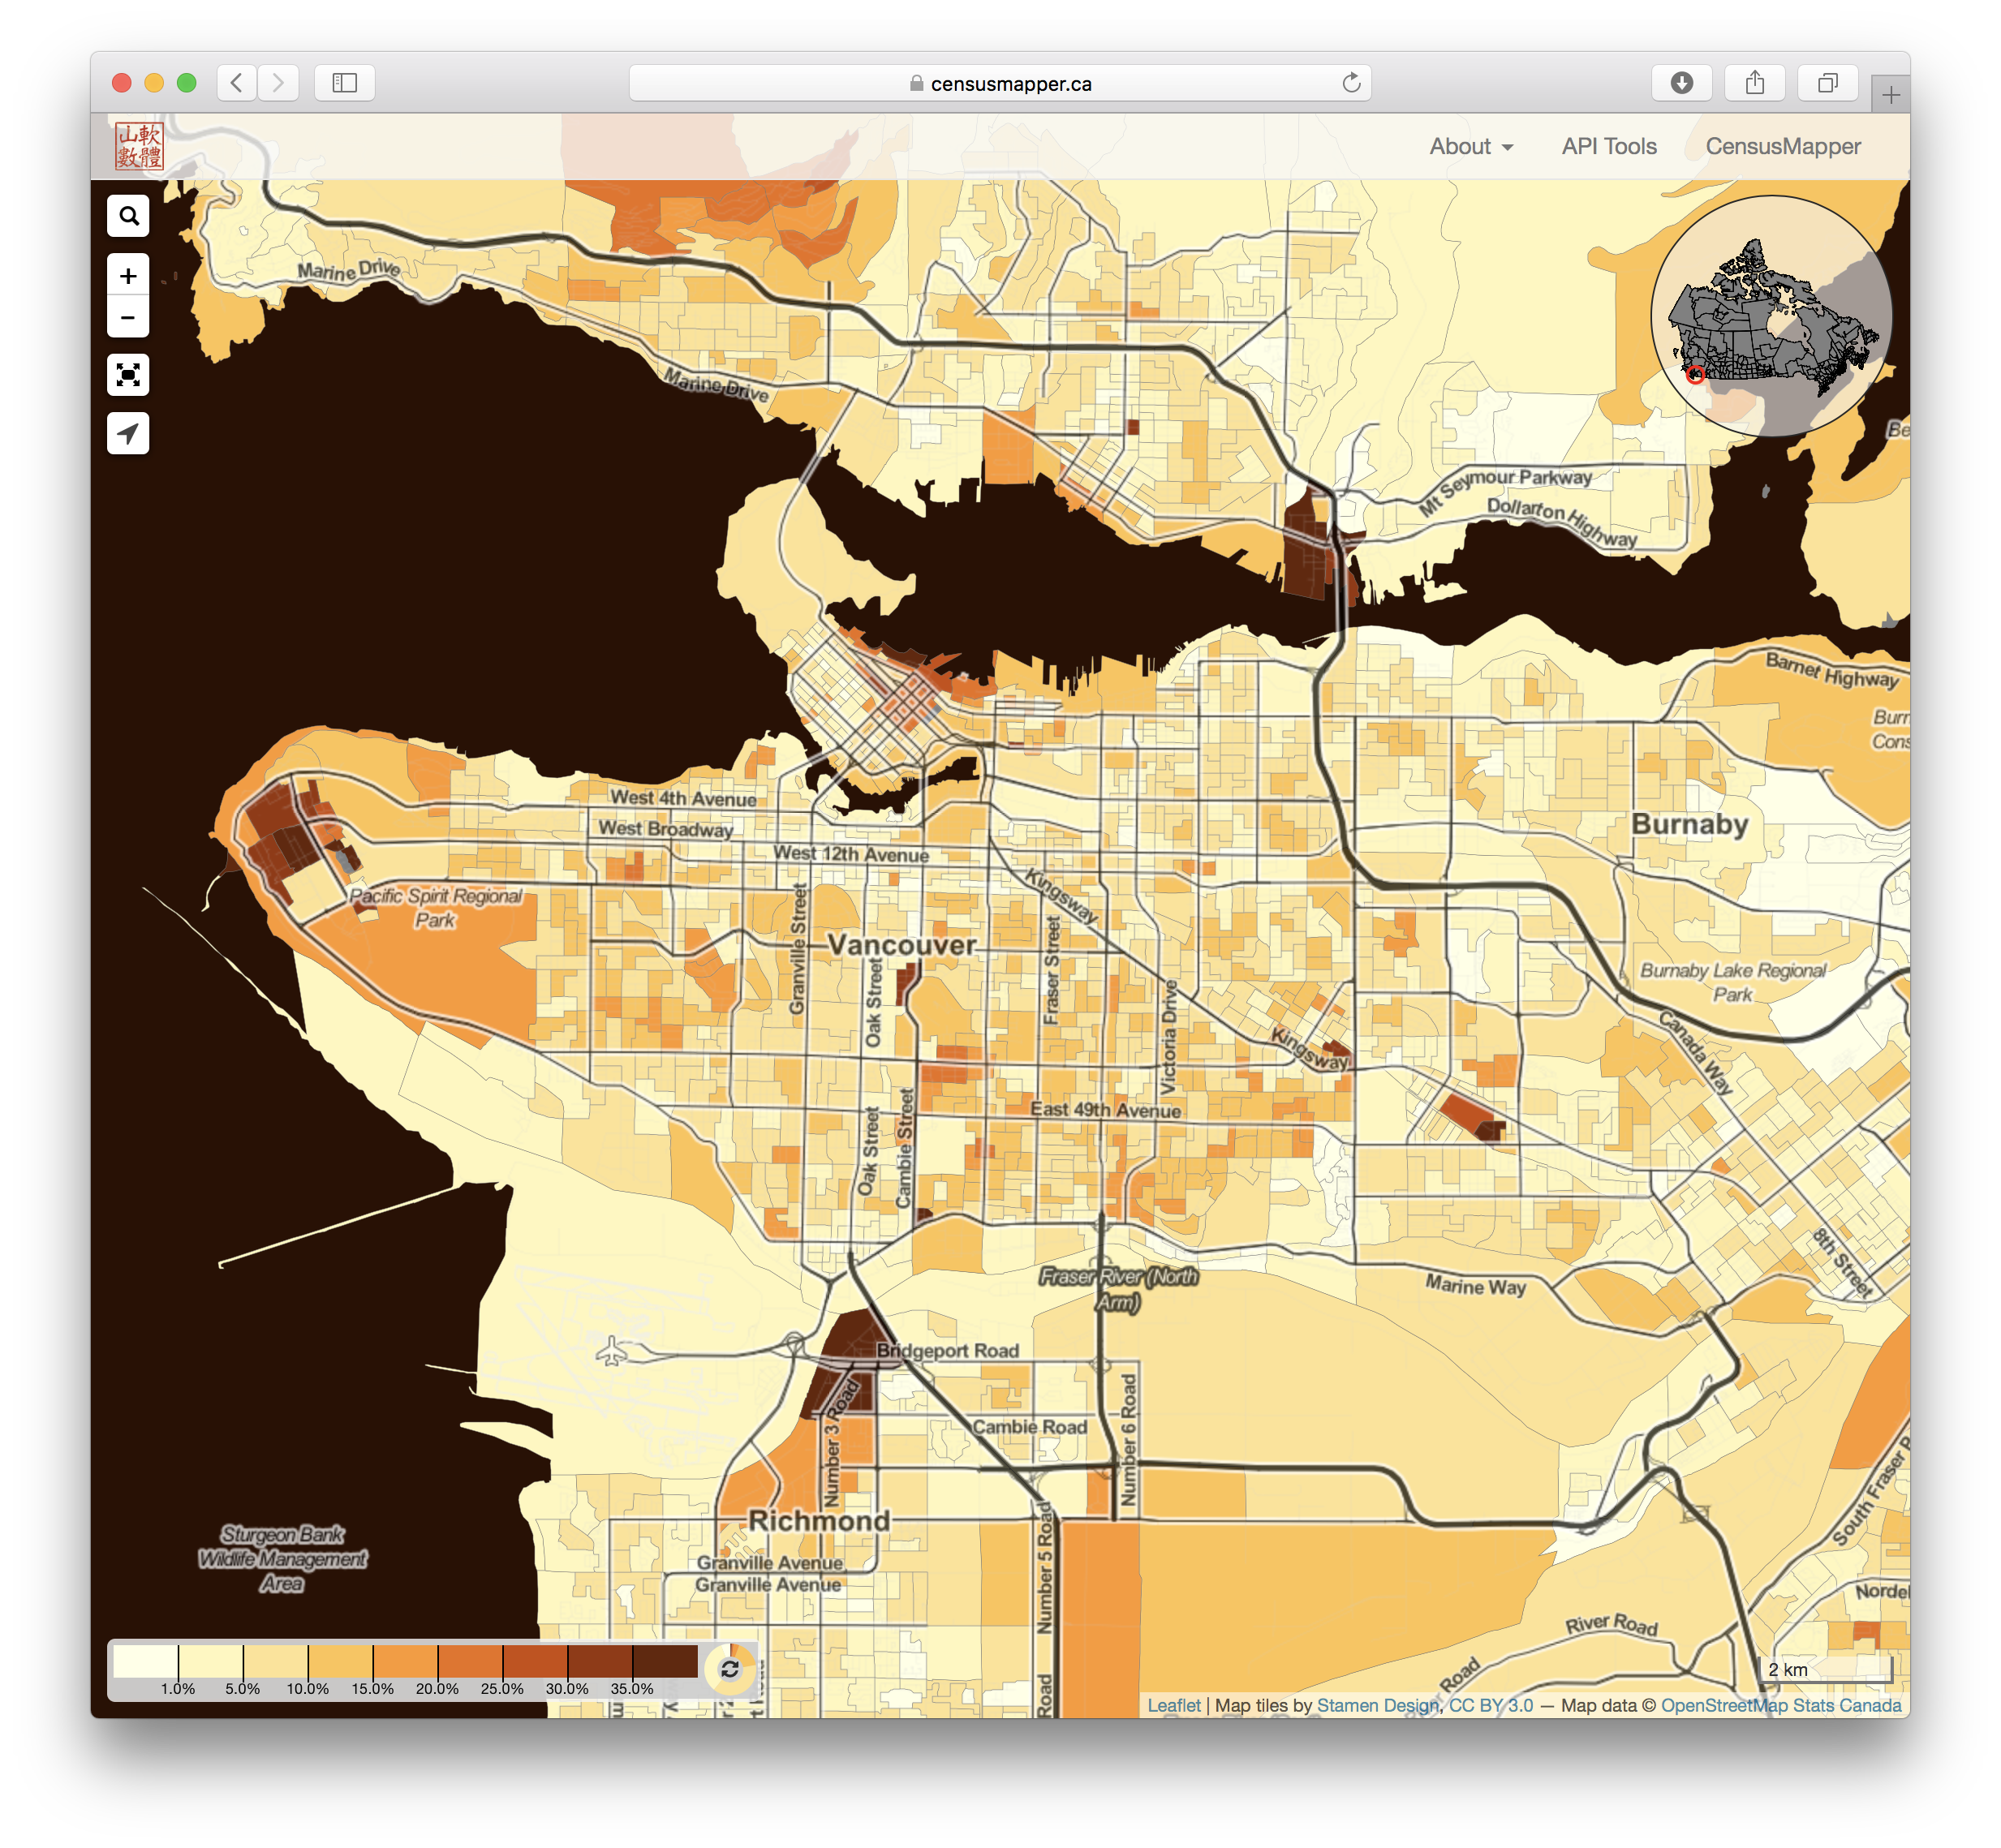
These maps are of course interactive and Canada-wide, you can explore the country by zooming, panning, geo-locating, using the search bar or the overview map in the top right to navigate across Canada. To share the window you are looking at just copy-paste the current URL of the map window.
How to use these maps
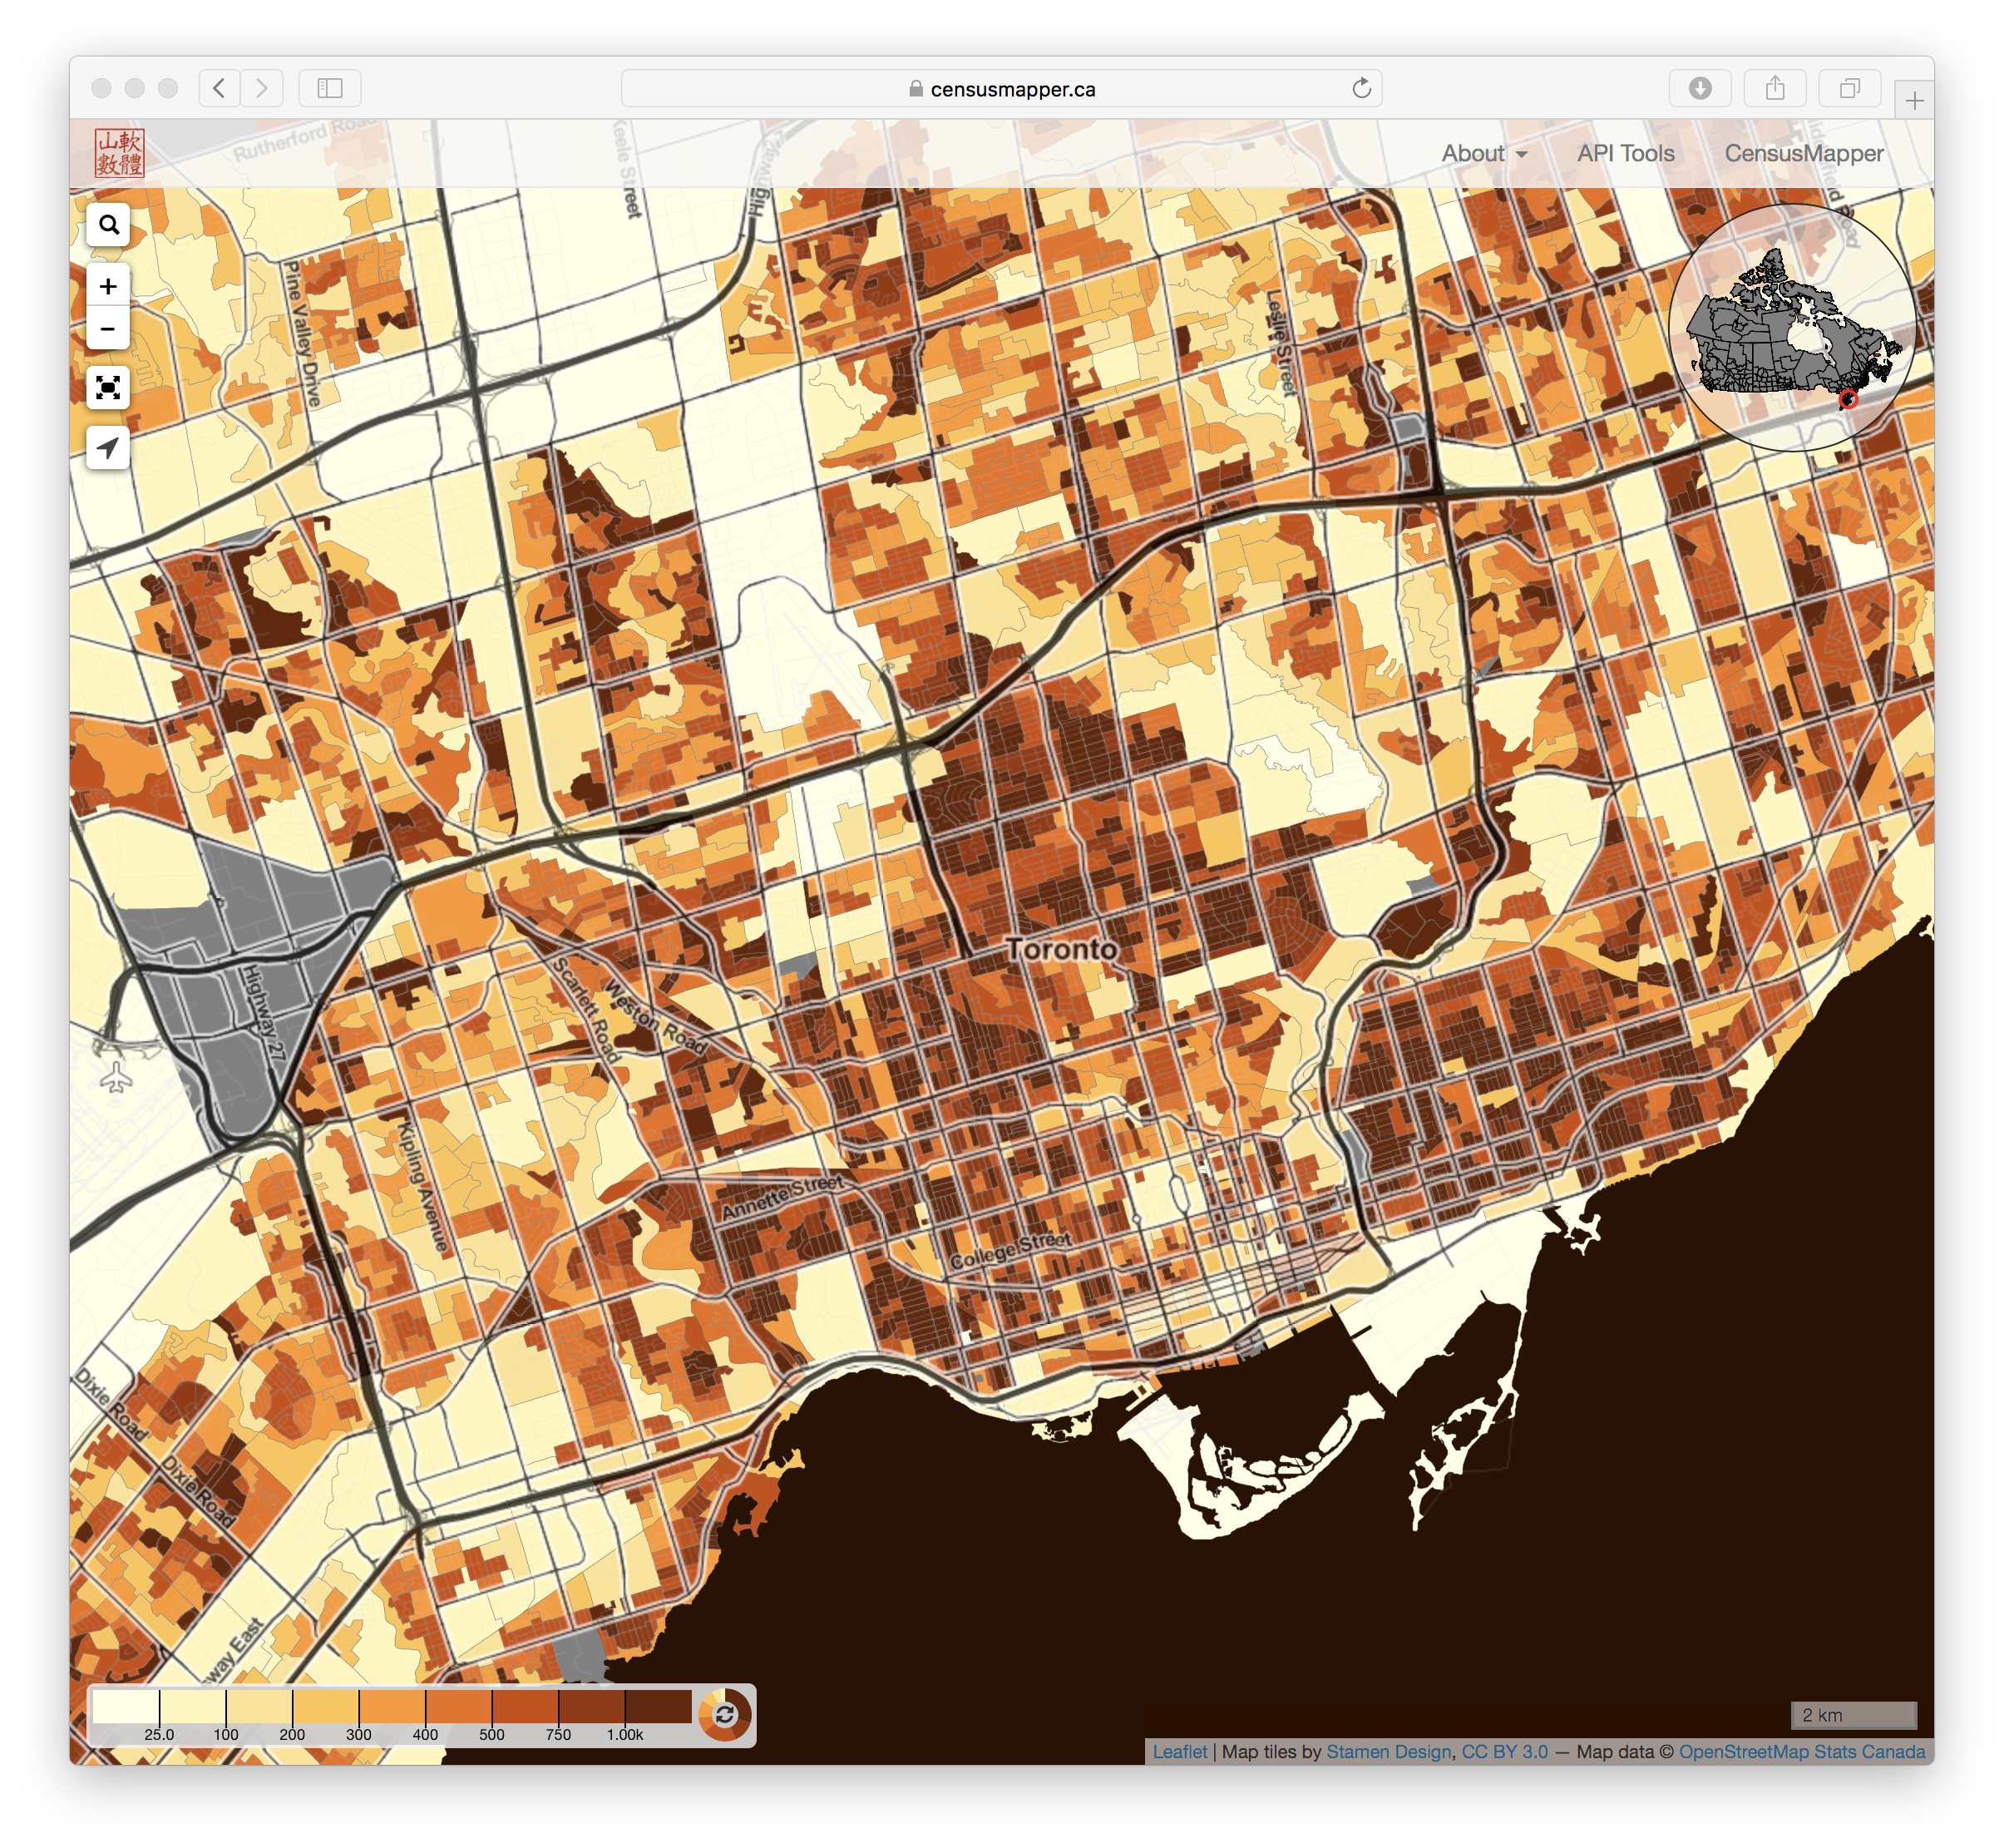
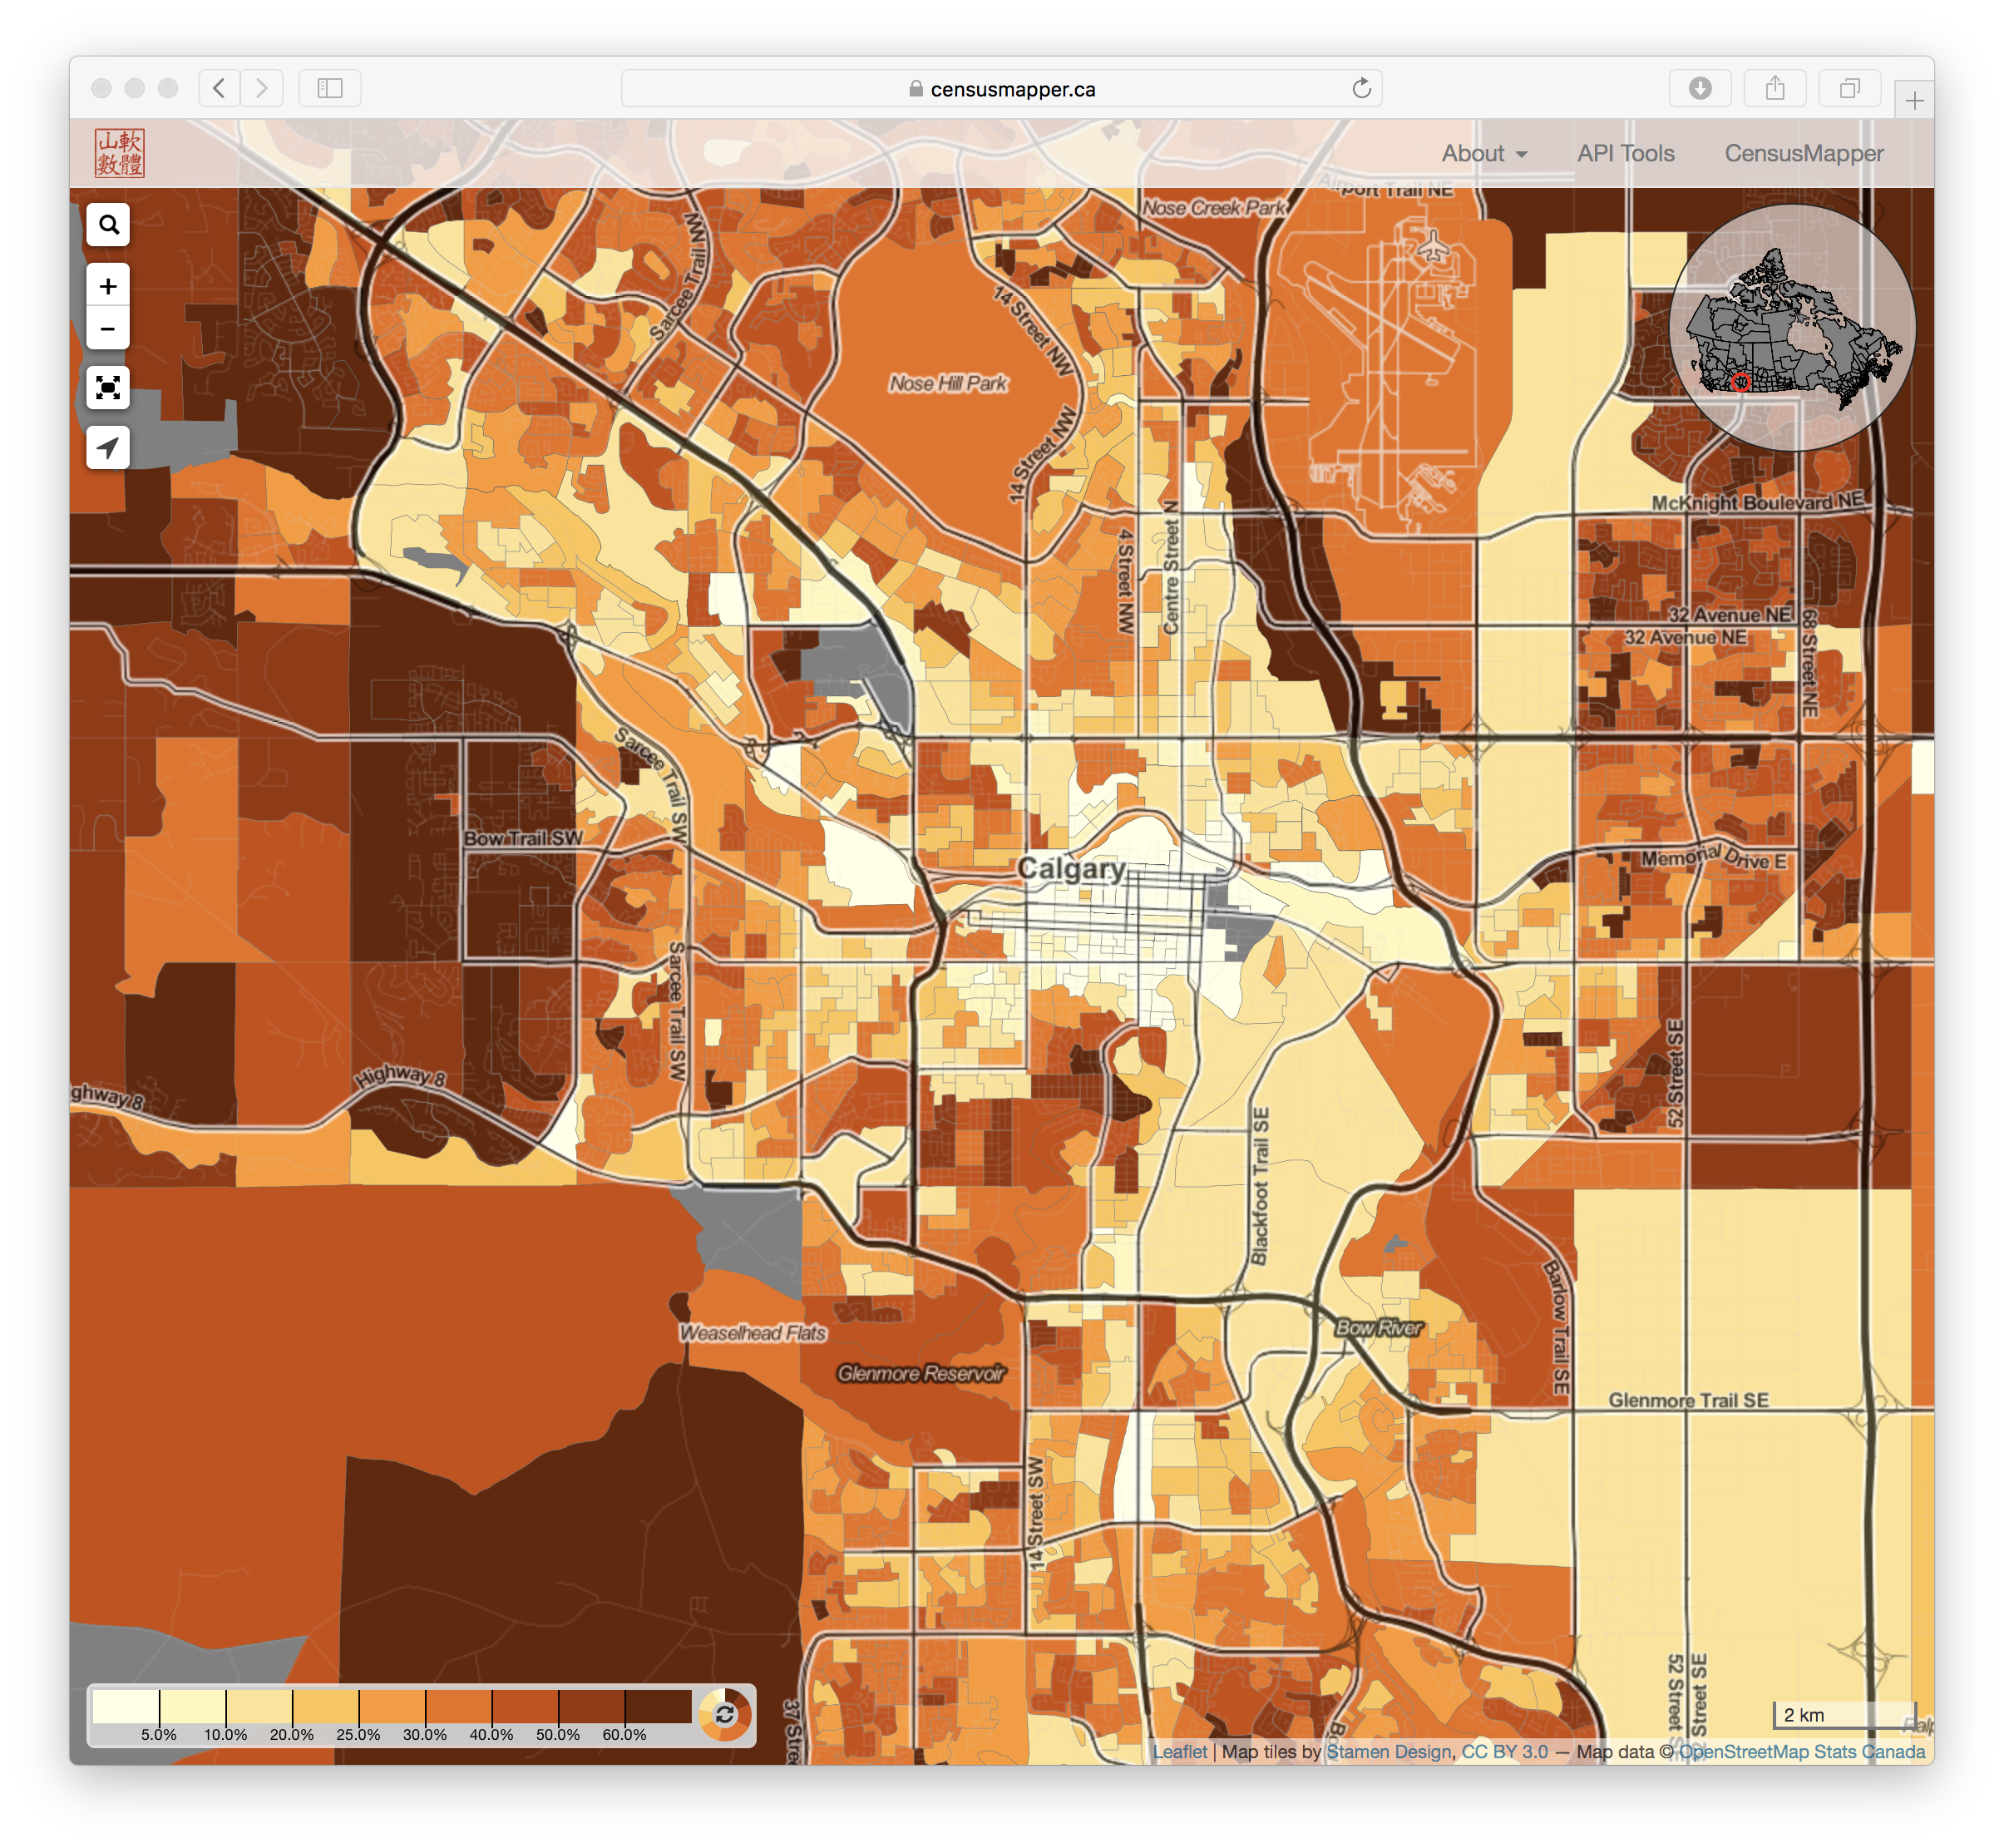
The Trick-or-Treat Onslaught Map estimates the number of children of prime trick-or-treat age per doorbell. Use this map if you are guarding the door and want to know how much candy to stock. Darker colours means you need more candy.
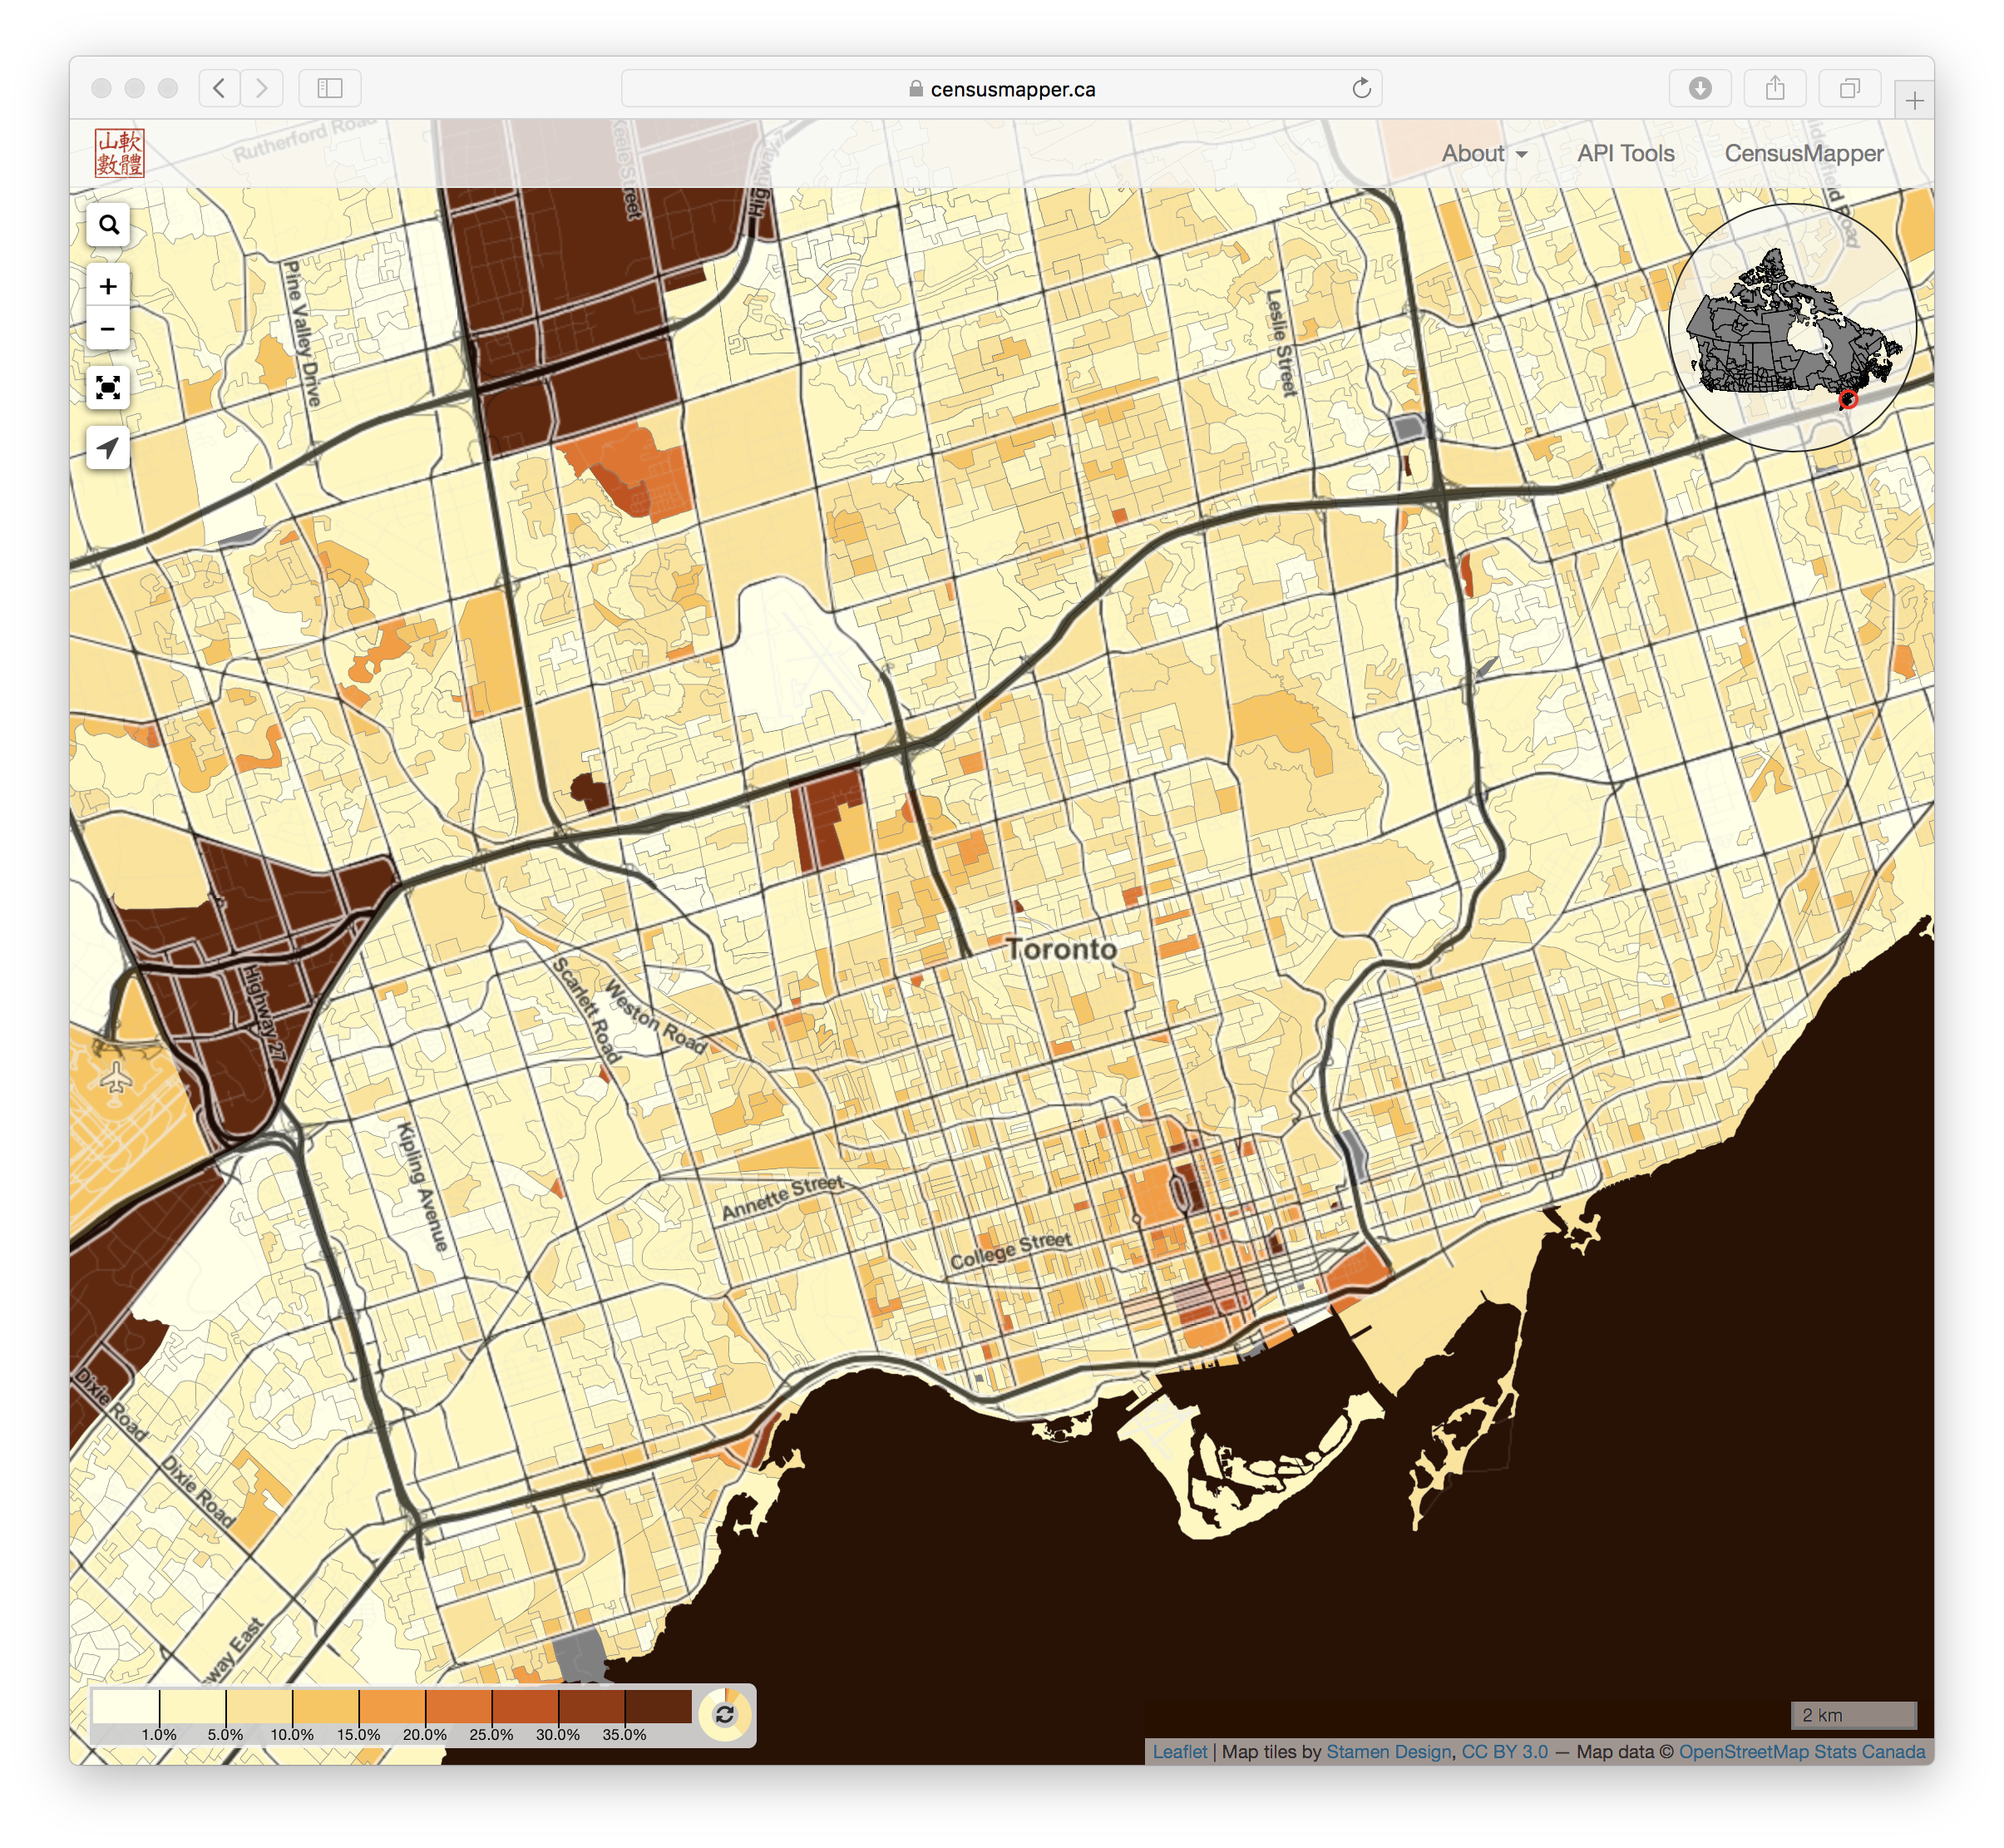
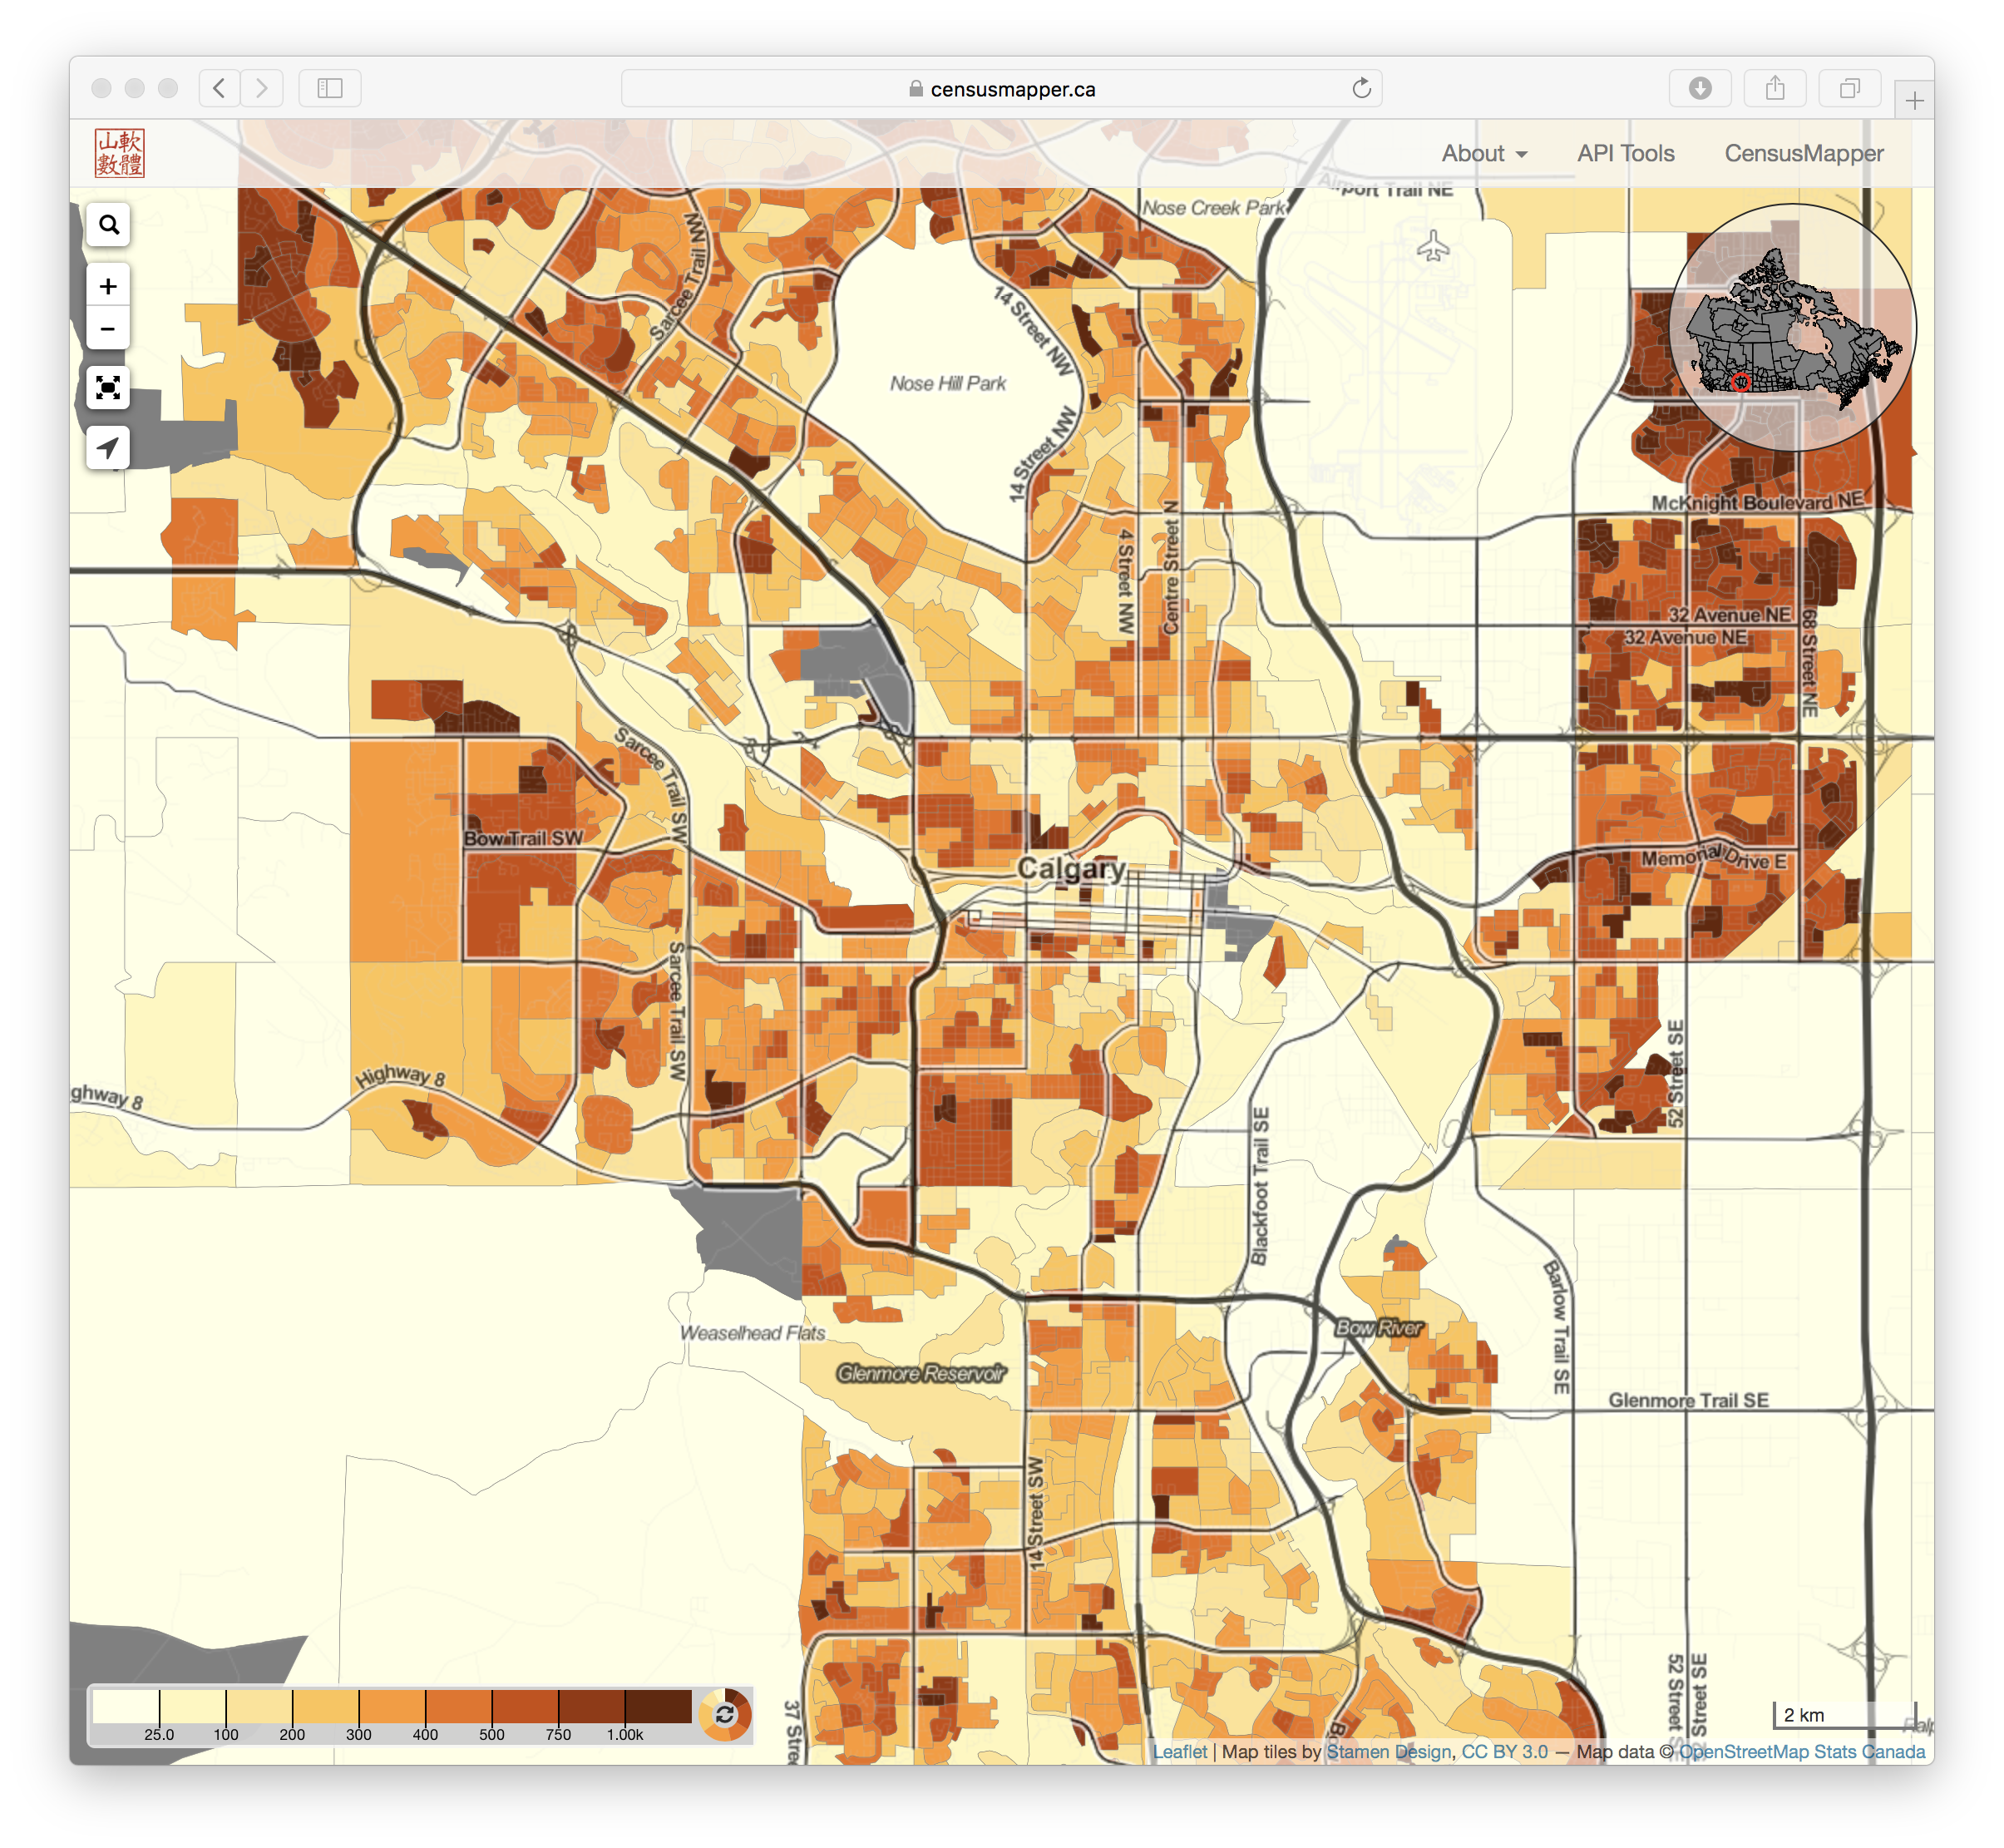
The Trick-or-Treat Density Map estimates the number of children of prime trick-or-treat age per area, so the expected trick-or-treat foot traffic in each area. Use this map if you plan on taking your kids out trick-or-treating and want to make sure you find the area in your neighbourhood with the most kids out on the street. Darker colours mean more kids.
Important: Remember that Trick-or-Treating is also about connecting with your neighbourhood, so we hope you won’t use this to plan your cross-town drive-and-trick-or-treat trip but rather to discover new trick-or-treat density pockets in your own hood.The Haunted Houses Map shows the houses that were occupied only by ghosts or unusual residents in May 2016. Ghosts and unusual residents tend to be restless, and areas that were severely haunted a year ago might have undergone substantial exorcism in the meantime. Dive into the map and the map story for some examples of successful exorcism as well as examples of robust populations of ghosts or unusual residents.
Some stats from last Halloween
Toronto
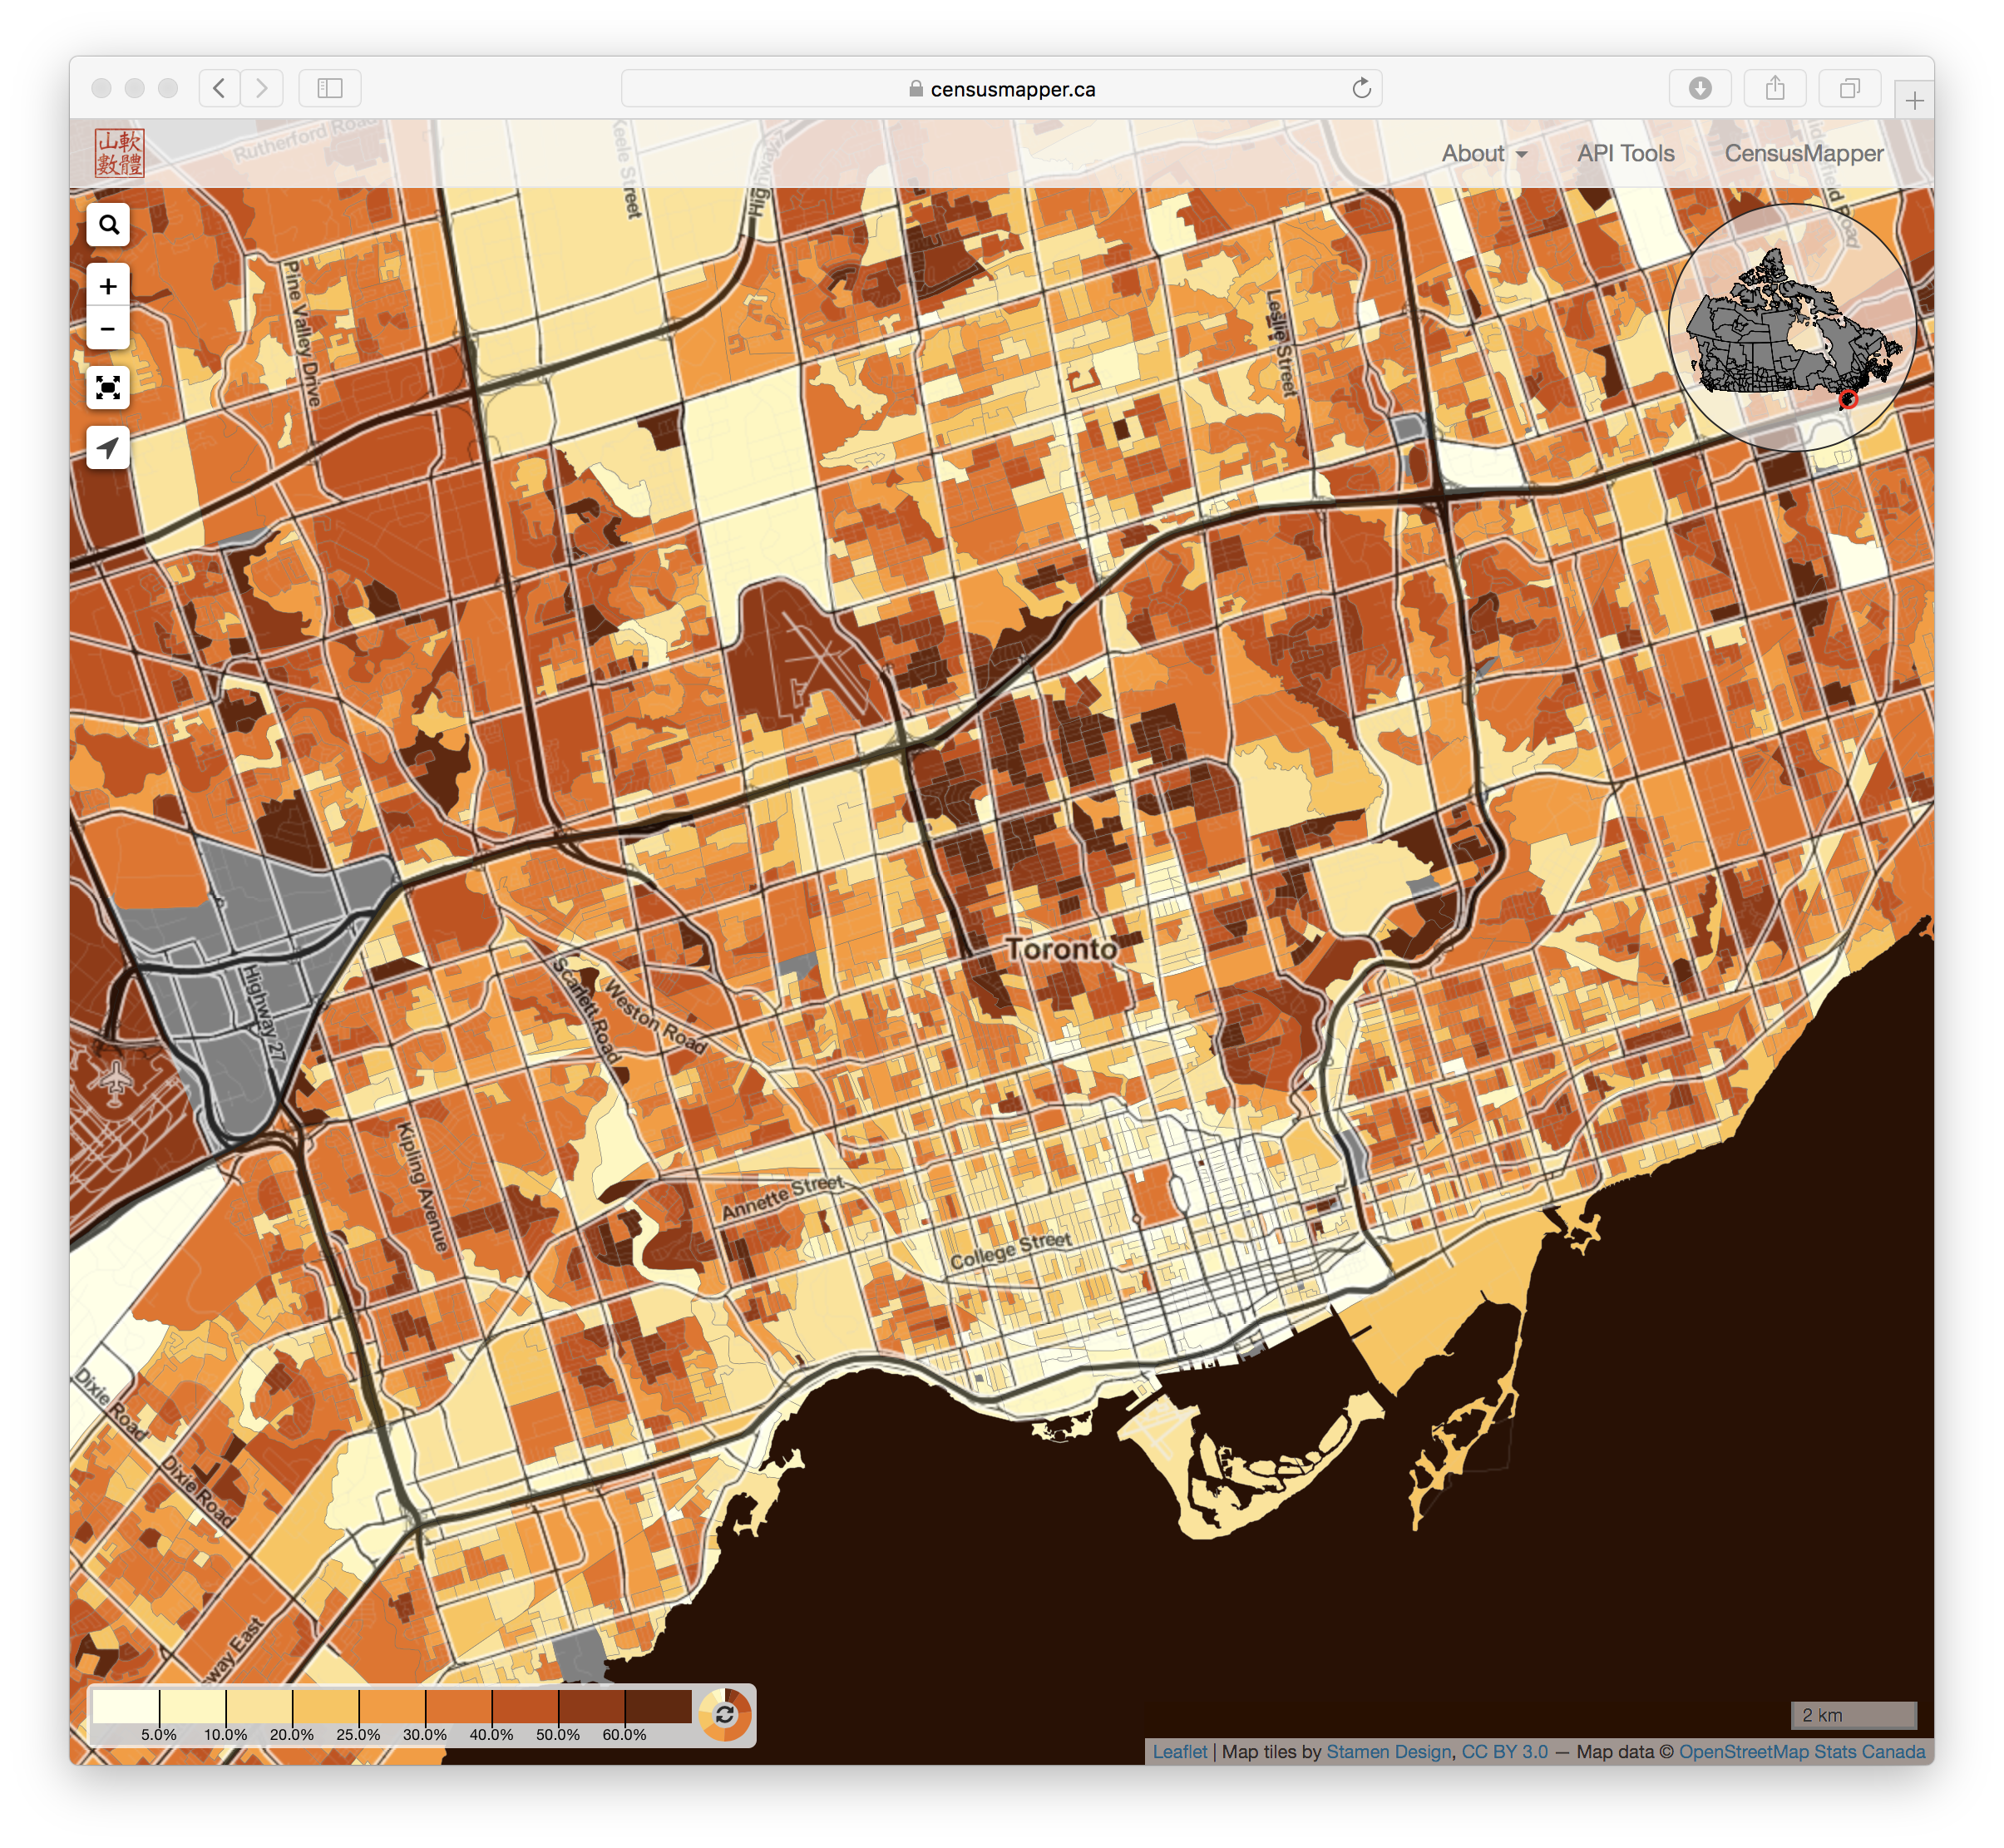
The prize for the most views of our Trick-or-Treat maps last year goes to Toronto, so here are quick-links for the Toronto area.
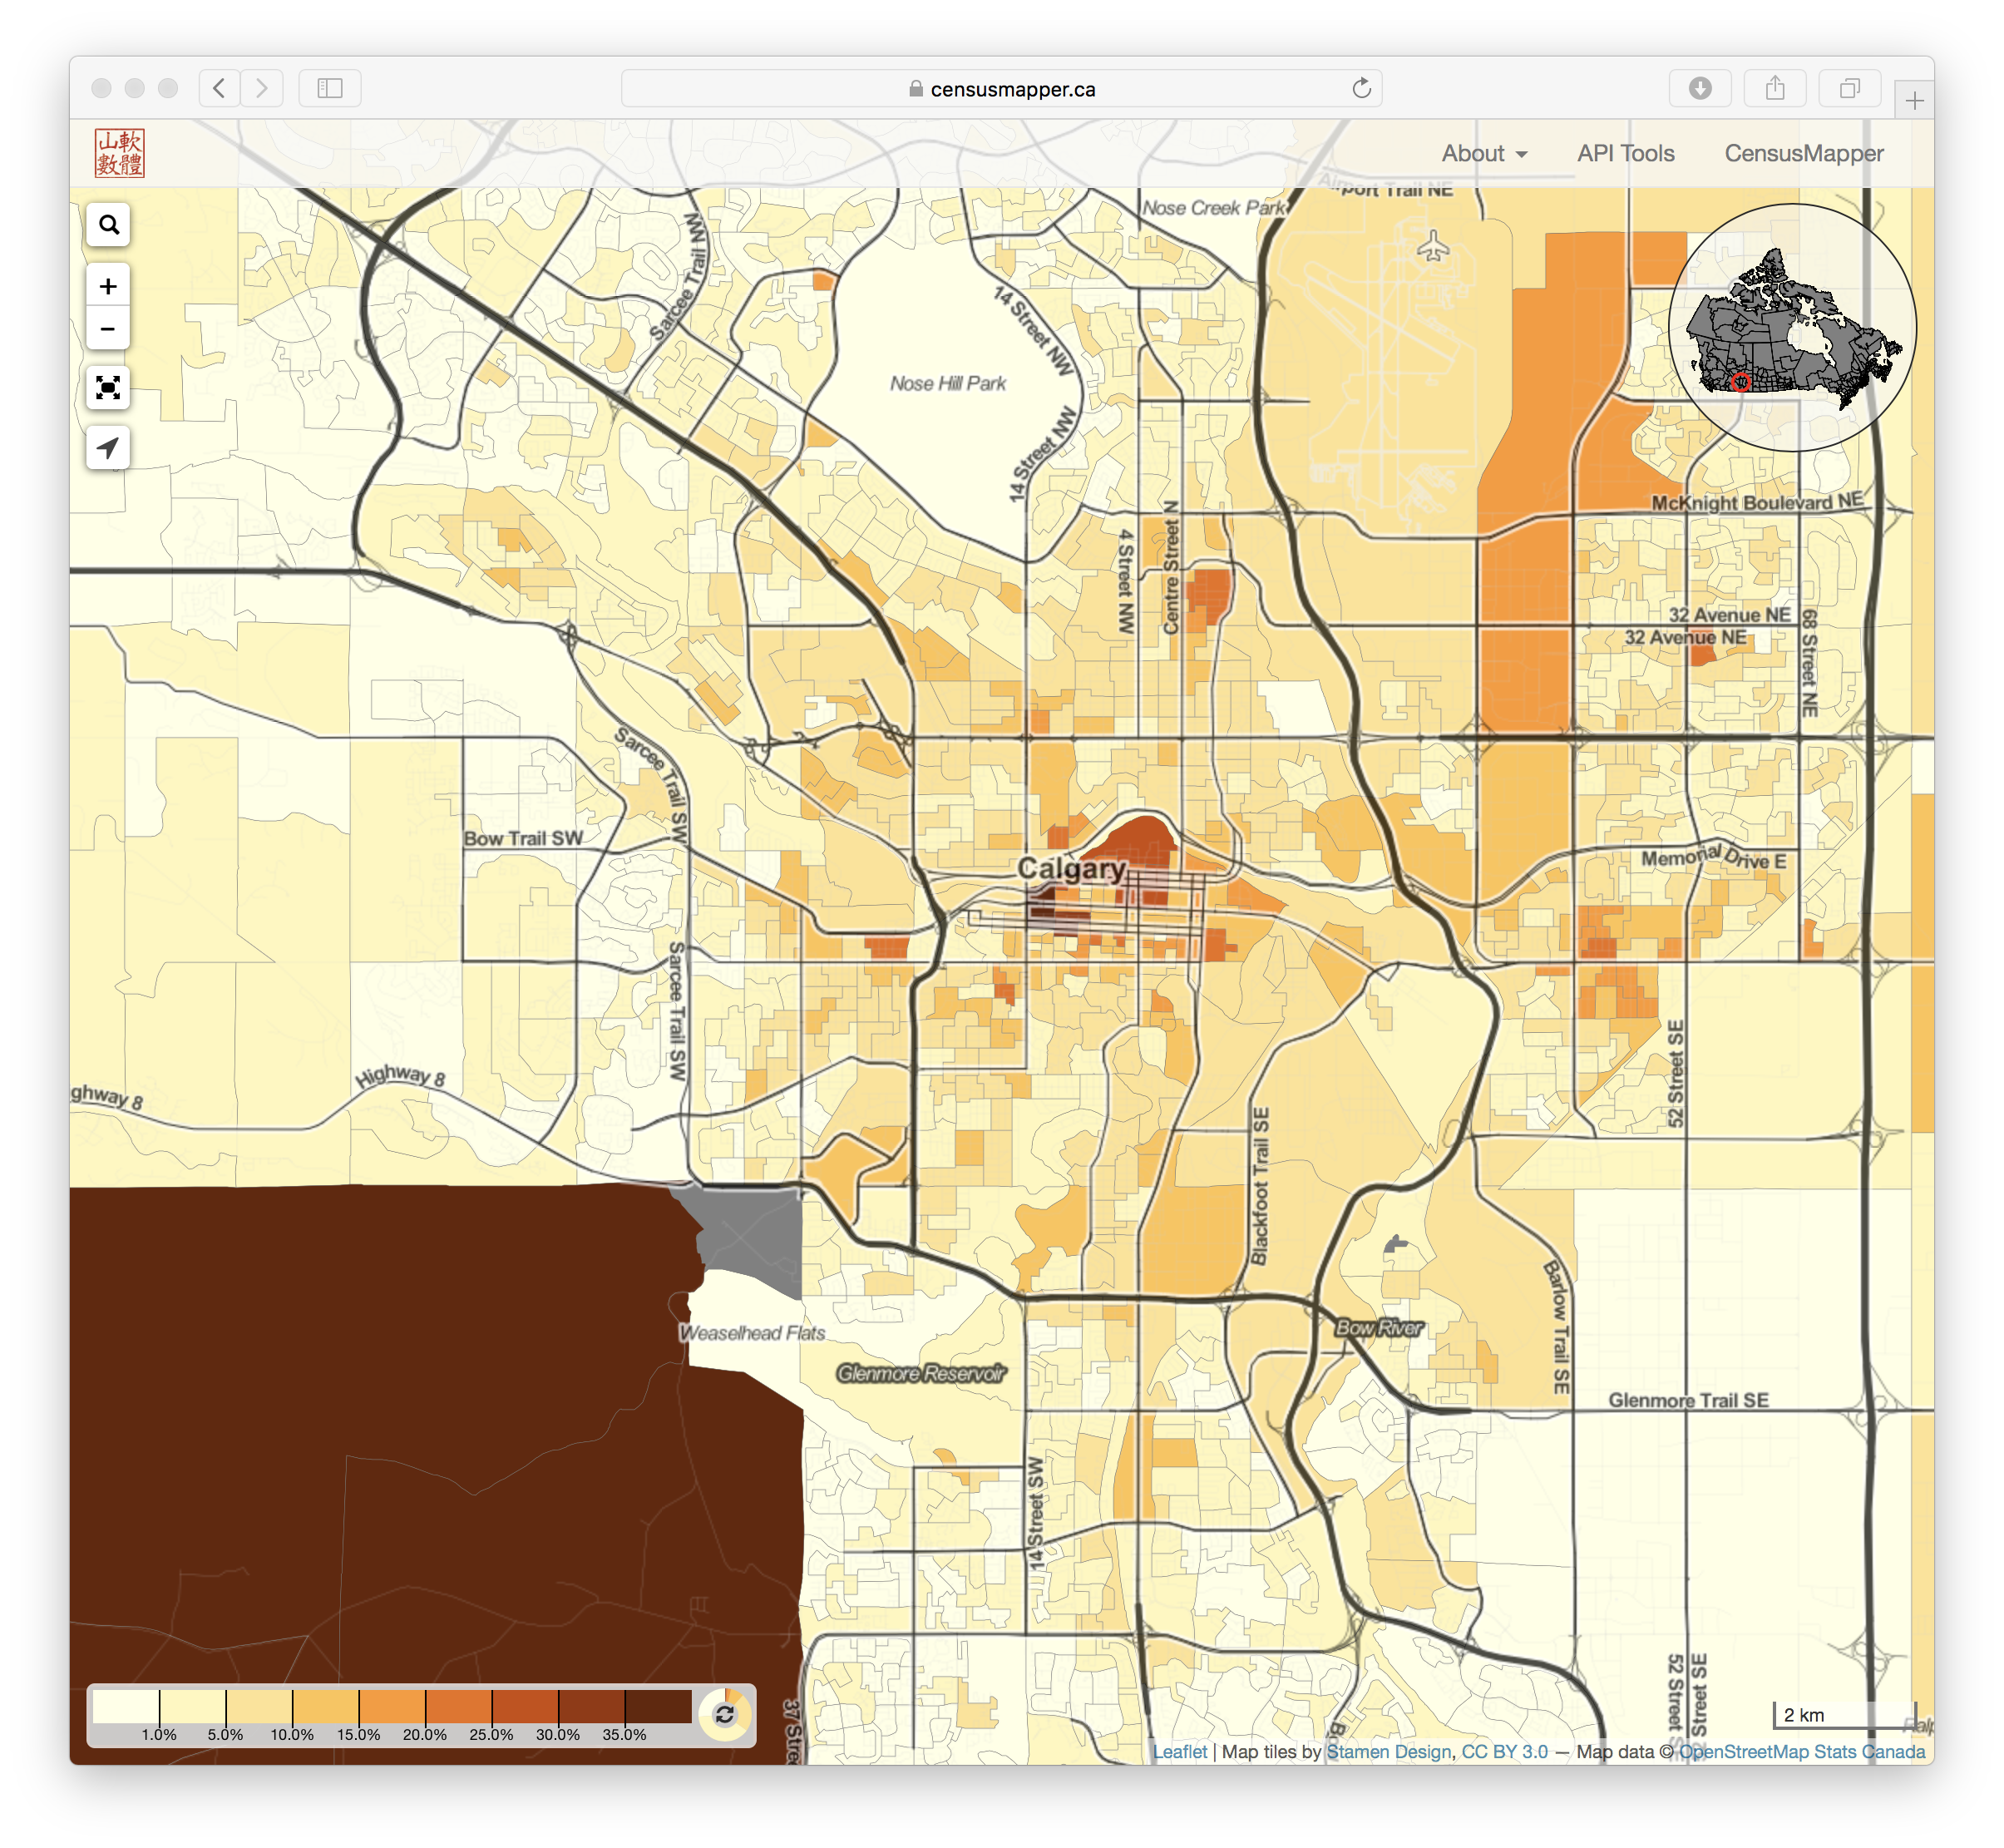
Calgary
Calgary earns the prize of the most views per population last year, earning the title of “most scientific Halloween preparation”.
The Future
For a short second we toyed with the idea to start modelling the number of kids in 2017 based on our 2006 and 2016 data, as well as CMHC completion data. But we felt that the simplicity and transparency of serving straight-up 2016 census data outweighs the benefits of having slightly more accurate data at the expense of complex algorithms. As we move further out from the 2016 census there will be plenty of opportunity to flex some serious CensusMapper muscle and dive deep into our modelling capabilities.
Reuse
Citation
@misc{trick-or-treat-2017.2017,
  author = {{von Bergmann}, Jens},
  title = {Trick-or-Treat 2017},
  date = {2017-10-23},
  url = {https://doodles.mountainmath.ca/posts/2017-10-23-trick-or-treat-2017/},
  langid = {en}
}
