I want do a short post to gently remind people of pitfalls when overly relying on medians for understanding complex issues. Medians are useful because they take a complex distribution and break it down into a single, simple to understand number. This works well as long as this does not mask other aspects of the distribution that are important in the context it is used.
A good example for the dangers of overly relying on medians is the “median multiple” metric that gets used a lot, the median dwelling value divided by the median household income in an area. I have talked about this before but want to give some more general context to illustrate some pitfalls more directly.
Median Household Income
When comparing median household incomes across regions it is very important to pay attention to the significant confounding variables involved. The variance in median income when restricted to various household types is huge as can easily be observed when interactively filtering by various household types. And those differences are persistent across geographic regions. What that means is that a significant determinant of the median overall household income in a region is the composition of households in that region.
A Tale of Two Cities
A good example of this is median household incomes in the City of Vancouver vs the City of Toronto. As has been reported repeatedly, the City of Toronto has higher median household income than the City of Vancouver. And while this was a reasonable way to summarize the income situation in 2005, it is misleading in the context of 2015. People that have been paying close attention to these issues will be nodding their heads and don’t need to read on. For the others this needs a more detailed and clear explanation.
Simpson’s Paradox
To start off, let me explain what the problem is. Median household incomes are higher in Toronto than they are in Vancouver, so how can saying this be misleading?
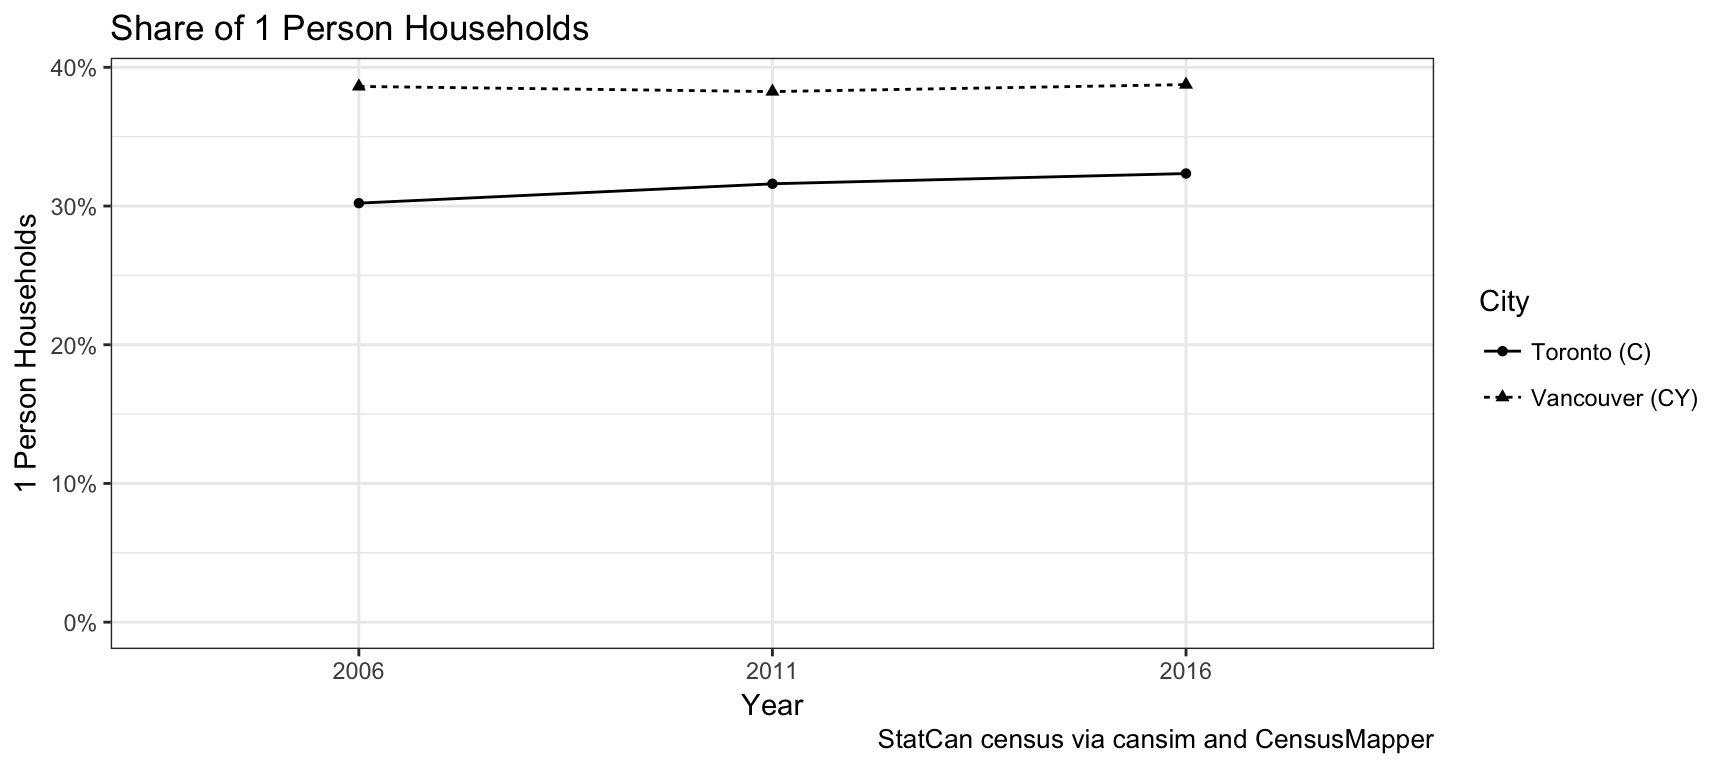
One-person households and two-or-more person households have very different income profiles. We can compare median incomes separately for these groups. If we do that we find that City of Vancouver has higher median household income for one-person households as well as for two-or-more person households when compared to the City of Toronto. How can that be? Vancouver has a much higher proportion of one-person households, which tend to have significantly lower incomes. This is the classical Simpson’s Paradox.
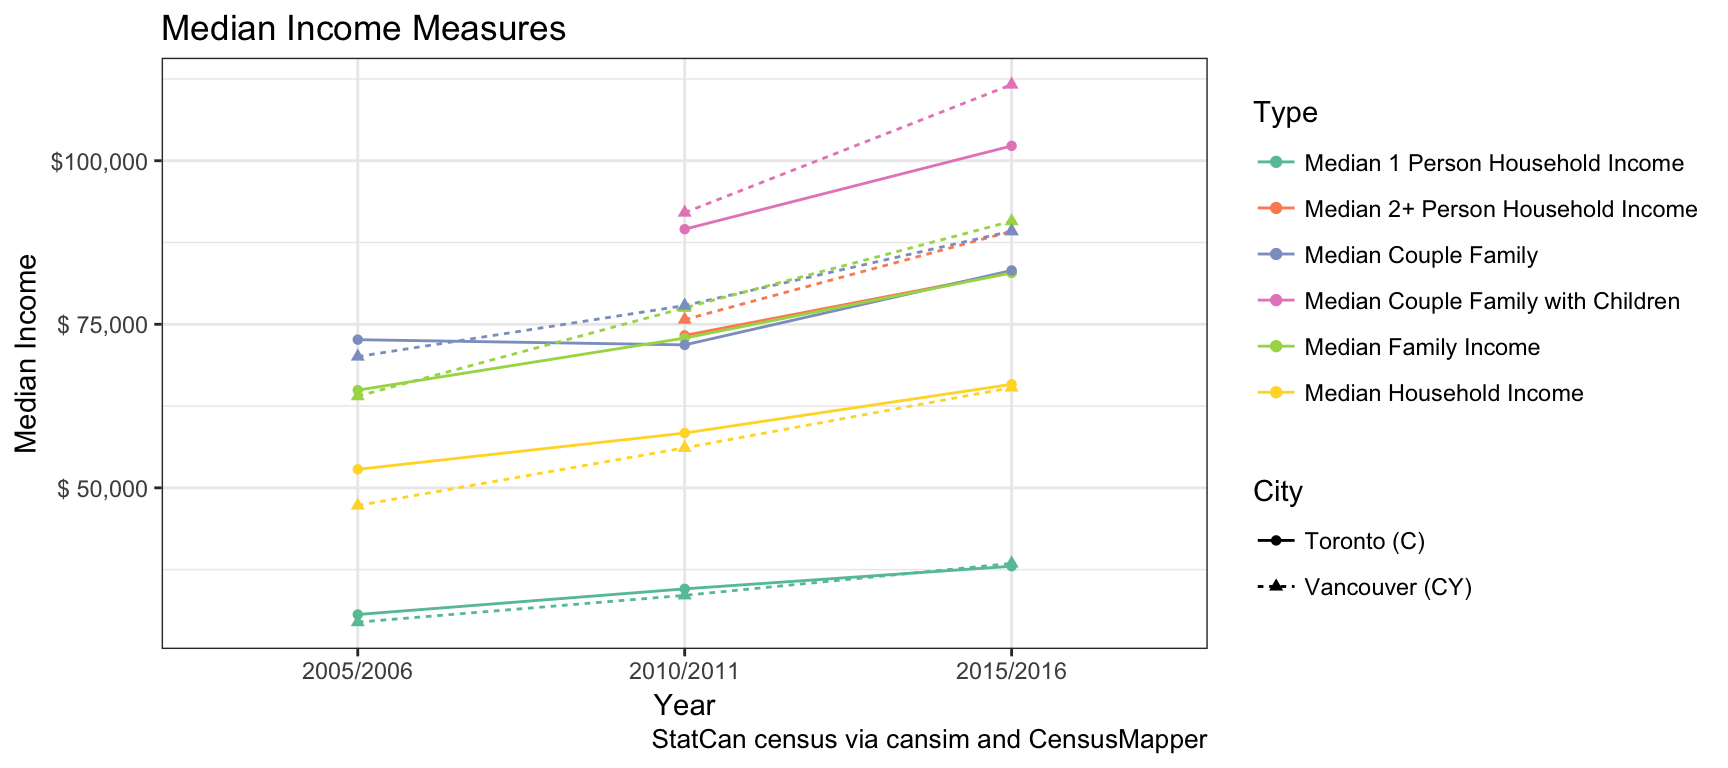
Taking a more comprehensive look, let’s use cancensus to pull a number of relevant median income metrics for 2005-2006, 2010-2011 and 2015-2016 and compare how they changed over time.

Some metrics aren’t available for 2005-2006, but the overall picture becomes very clear. We see that in 2005-2006 Toronto had higher median incomes in all of these metrics, but by 2015-2016 only the median household income is higher in Toronto, and Vancouver scores higher in all finer income groups.
Different household composition seems to be the missing confounding factor, let’s pull these numbers to confirm this.

The difference is not huge, but enough to flip the overall median income ranking and cause the paradox.
Linking Incomes and Housing Cost
One reason why this is especially important is the recent shelter cost to income numbers. In Vancouver the proportion of households that spend 30% or more of their income on shelter costs has dropped. The same still holds when looking at tenant and owner households separately. But the “median multiple” metric has increased from 13.3 in 2005-2006 to 13.4 in 2010-2011 and 16.9 in 2015-2016. The median multiple is a poor metric for many reasons, not least because it computes affordability using aggregate data instead of individual level data. Just like incomes, housing prices vary on a distribution and depend strongly on external variables like size, number of bedrooms and housing type. The individual level income-to-shelter data shows that the median multiple misses some important confounding factors, just like in the above income example. What are these? I am not sure. But this is an important question that deserves further attention.
Takeaway
The takeaway is that while overall median household incomes in the City of Toronto are higher than in the City of Vancouver, this masks that the opposite is true when comparing similar households. And is masks that over the course of the past ten years Vancouver has overtaken Toronto when comparing similar households. Which is quite remarkable in it’s own right.
We can dig deeper into this by looking at the whole income distribution, and how it changed over time. We have done this for Vancouver where we showed how the drop in low income households and gain of households in the top income bracket was more pronounced in the City of Vancouver than in other regions in Metro Vancouver or the country-wide movement. It would be interesting to reproduce this for the City of Toronto, and also to dig deeper to understand to what extent low income earners got pushed out of the City of Vancouver, to what extent salaries increased across the board and to what extent this was aided by higher labour force participation of households members. The census data release later this month can speak to that.
As always, the R Notebook underlying this post lives on GitHub. Feel free to download it to reproduce the analysis and adapt it for your purposes.
Reuse
Citation
@misc{medians.2017,
  author = {{von Bergmann}, Jens},
  title = {Playing with {Medians}},
  date = {2017-11-01},
  url = {https://doodles.mountainmath.ca/posts/2017-11-01-medians/},
  langid = {en}
}
