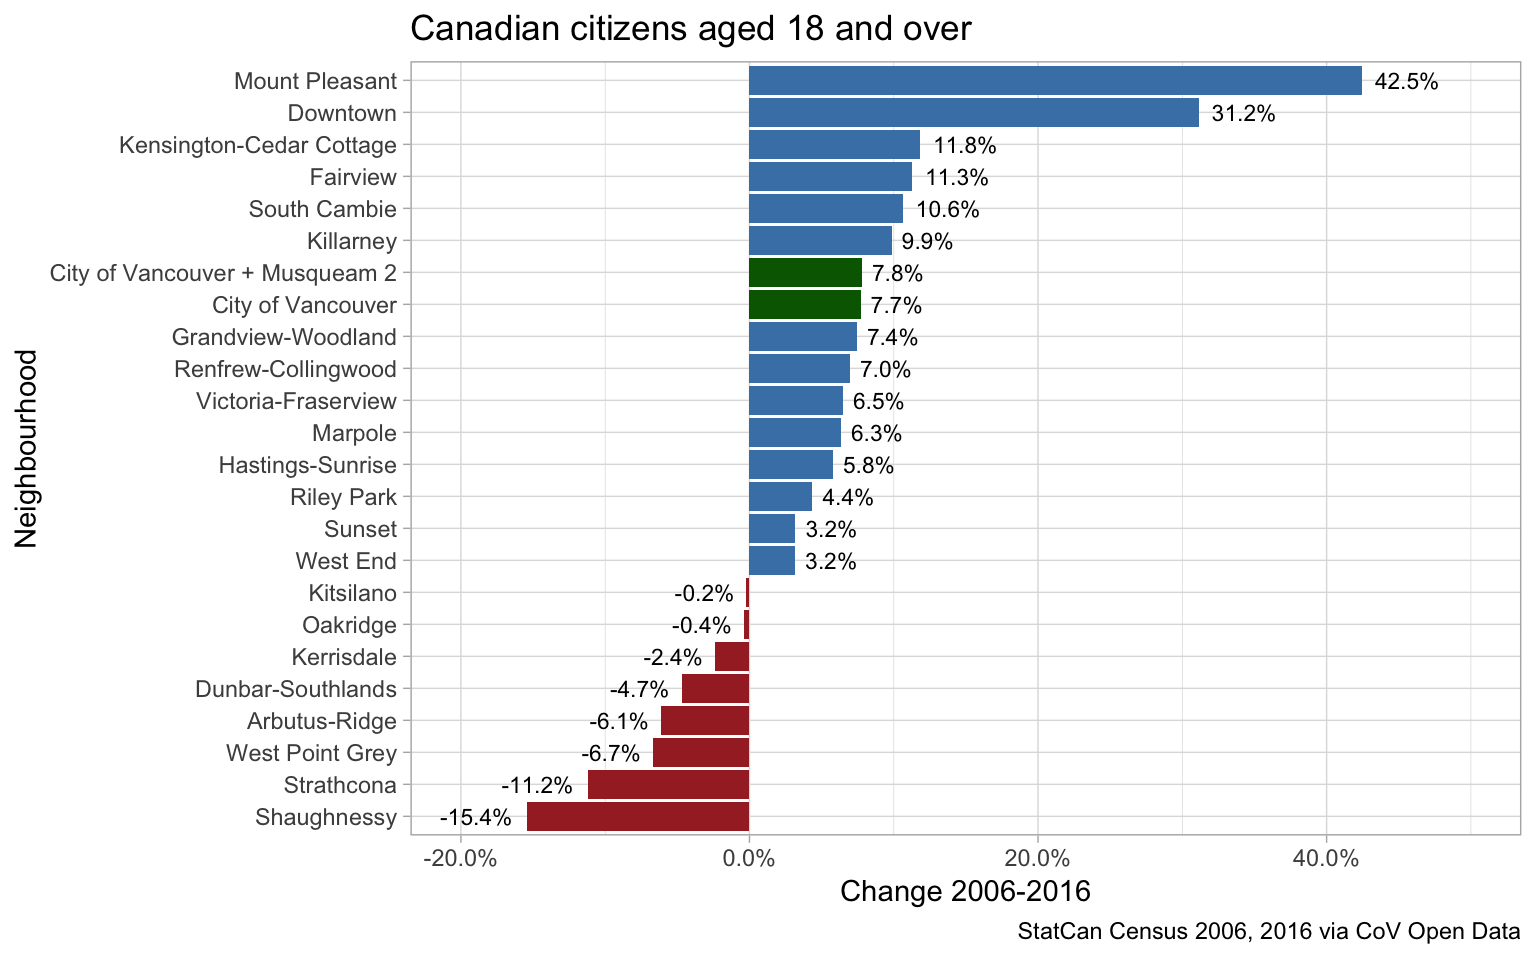
Now three people have asked me about the purported explosion of Canadians 18 and over in Downtown Vancouver, and in particular the claim that eligible voters in the Downtown and West End grew by a combined 70%. And I had to explain three times that while that population grew strongly, it grew by much less than reported. In fact, the number of Canadian citizens 18 years and older in the downtown peninsula only grew by 17.1%. Or maybe 21%, depending how to count. So maybe it’s time for a super-quick blog post, if nothing else it’s a reference people can quote and a way for people to check my code and see what I did.
The census conveniently provides a data field for Canadian citizens 18 and over, so it’s just a simple exercise of grabbing the numbers from 2006 and 2016 and dividing them. This can easily be done in excel or by hand, not sure how one could get this so wrong. However, there are a couple of details to pay attention to.
The 2016 data only considers the population in private households, whereas 2006 considers the population not in institutional dwellings (which is a larger category). That makes comparisons somewhat difficult. On top of that, we know that between 2006 and 2016 some housing that used to be classified as private has been re-classified as collective, in particular some SROs and elderly homes. That means straight-up comparing the 2006 to the 2016 citizen data will be biased in areas where housing got re-classified and where we have non-institutional collective dwellings.
Another caveat is that Musqueam 2 also gets to vote in the City of Vancouver elections, so we want to throw those into the mix and not disenfranchise them as almost happend before.
Getting the data for the city neighbourhoods is easy, it’s available on the Vancouver Open Data Catalogue and we have played with it before and have all the input scripts already set up. Conveniently, the neighbourhood data for Dunbar-Southlands already includes Musqueam 2.
A last caveat is that the 2016 data is already over two years old now, and things will likely have changed a bit in the meantime. Oh, and then there is the issue that Canadian citizens living anywhere in BC that own property in the City of Vancouver also get to vote in Vancouver. Even if they don’t live in Vancouver. Yes, it seems crazy that this is the case, but property ownership gives people lots of privileges, including special voting rights!
Straight-up census numbers
The first approach is to take straight-up census data, graphing the change change in citizens 18 and over as reported in the census and ignore issues around changes in definition and re-classification in dwellings for now.

Total population varies by neighbourhood, so the order changes if we look at the change in total number of citizens 18 and over.

Estimating voters
As mentioned above, there are a couple of issues with the naive census numbers. Some we can’t deal with, we don’t know how many Citizens live in BC outside of Vancouver and own property in Vancouver. But we can try to at least estimate the effects of the change in definitions and classifications in the census, although there is no canconical way of doing this. We first take a look at the change in the population without citizenship information to get an idea by how much this could effect the results.

Downtown and Strathcona stand out, and we have already seen this when previously looking at change in renters by neighbourhood. We don’t know how much collective housing was built in this 10 year timeframe. And we don’t know what share of the population in collective housing are citizens. Negative numbers are a lower bound on people leaving collective housing, positive numbers are an upper bound on people moving into, or getting reclassified as, collective housing. What we don’t know is how many of these are canadian citizens 18 or older.
But we can use this to derive an upper bound on the growth of citizens above the age of 18 by simply adding the non-negative numbers onto our previous graph.

Comparing to the first graph, we notice that Strathcona is in the blue, and downtown has crept up a bit. Combining Downtown and the West end we get an upper bound of a growth of 21.0%, a slightly higher growth rate than naively using census numbers, but still nowhere near the 70% that was reported.
Citizens, voting age, permanent residents and non-permanent residents and collective dwellers
That leaves us with an interesting question of how the neighbourhoods are made up. With respect to voting, we are interested in Canadian citizens 18 and over, Canadian citizens under 18, permanent residents, non_permanent residents and people not in private households. Citizens under 18 will reach voting age some day, and Vancouver council has voted on allowing permanent residents to vote, at least those 18 and older.

Or as share.

The Map
We love maps here, so let’s end by looking at the geographic distribution of the change in eligible voters, naively using the census numbers as an estimate, in each neighbourhood.

As always, the code for this post is on GitHub in case anyone wants to check the code, reproduce the post or adapt it for their own purposes.
Reuse
Citation
@misc{the-rise-and-fall-of-vancouver-eligible-voters.2018,
  author = {{von Bergmann}, Jens},
  title = {The Rise and Fall of {Vancouver} Eligible Voters},
  date = {2018-10-17},
  url = {https://doodles.mountainmath.ca/posts/2018-10-17-the-rise-and-fall-of-vancouver-eligible-voters/},
  langid = {en}
}
