Aaron Licker asked a good question about this very interesting dataset.
twitter-verse where is the data that forms this amazing table from @CMHC_ca: cc @vb_jens @LausterNa @rwittstock pic.twitter.com/iRD65KQdz3
— Aaron Licker (@LGeospatial) November 28, 2018
Unfortunately it is not obvious where to get the raw data, but Keith Stewart at the Vancouver CMHC office was kind enough the share the dataset. So read on to follow my quick look at the data, or just download it if you want to tinker yourself. (French version here).
Moving penalty
The data is interesting because it gives an estimate of the “moving penalty”, that is on average how much more rent a person that is currently renting would have to pay to move to a different purpose-built rental unit in the same CMA.
Of course the exact amount is location specific, and the CMHC estimates for the rents for “vacant” units are not very precise, especially in areas with low vacancy rates. And we don’t know much about the quality and location of the vacant units. The vacancy rate varies geographically across CMAs. For example the City of Vancouver has a lower rate than the CMA average, so this will lead to the vacancy units over-sampling the outer (and less expensive) areas, so the true penalty to move in Vancouver might be higher.
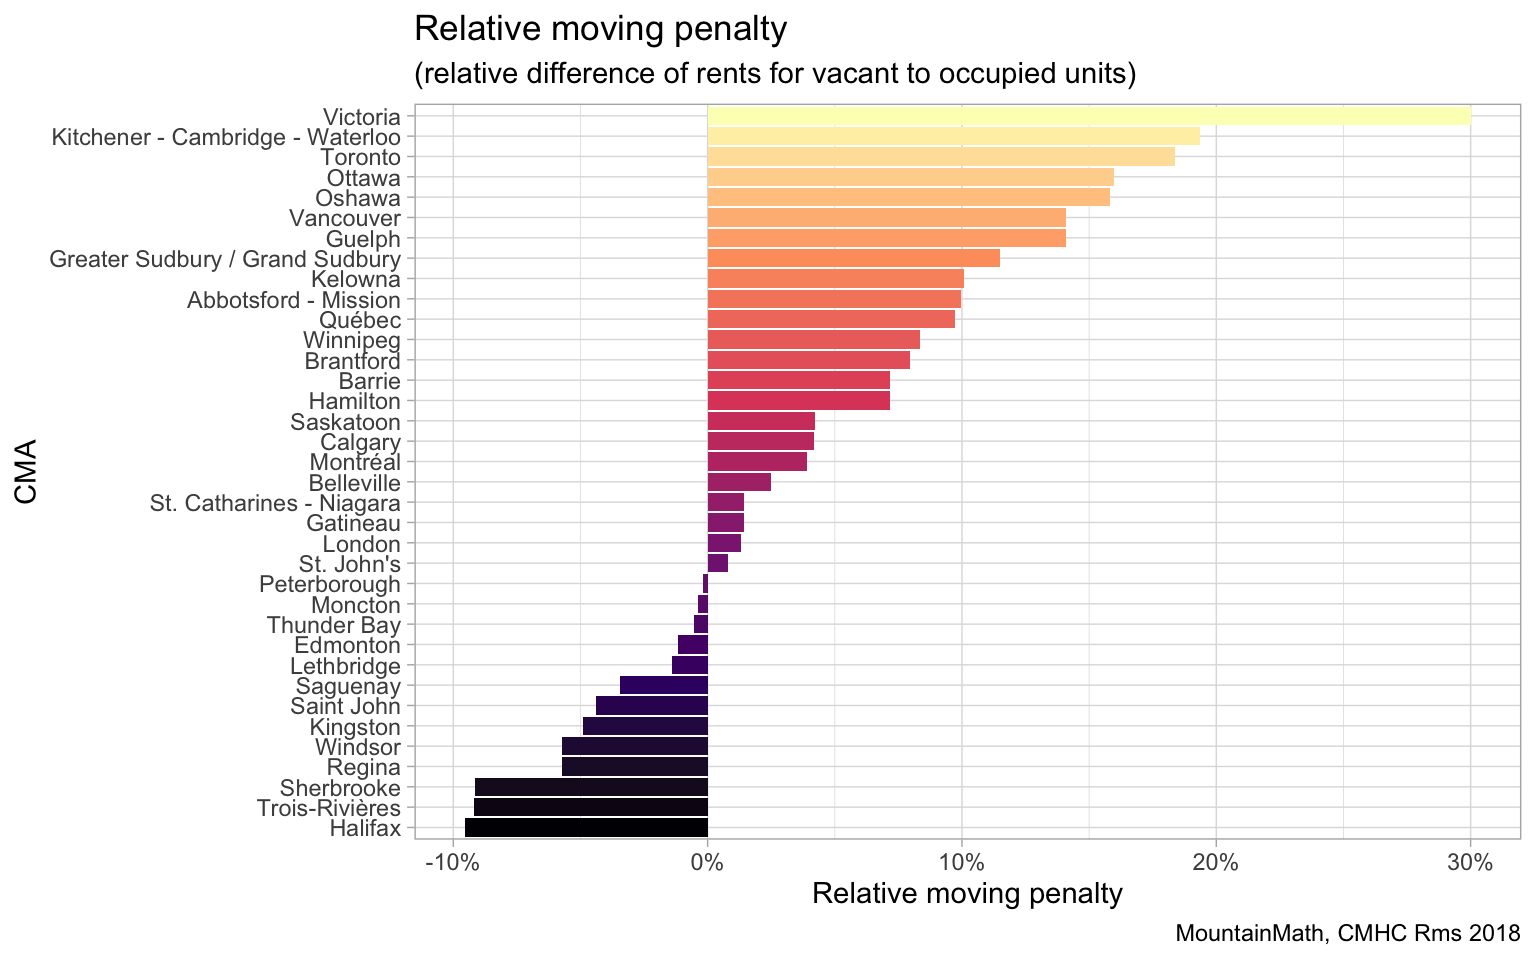
Understanding some of the data caveats, here are the moving penalties by CMA.

This suggests that in Halifax people could lower their rent by almost 10% if they are willing to move, whereas in Victoria people should expect a 30% rent hike if they need to move. Again, these are only estimates, and quality and location of units can have sizable effects on this representation. It could well be that the rentals that are currently vacant in Halifax are simply not very desirable and Halifax has no need for less desirable (and cheaper) rentals.
The same cannot be said for Vancouver, where council is currently in the second day of a public hearing about strengthening renter protections in case of extensive building renovations. Renovations improve the quality of rentals, which is good for renters. But they also increase rents, which is bad for renters. On top of that, in a rent controlled environment with vacancy decontrol like in Vancouver, renters may pay a strong moving penalty that is independent of the quality of the unit and just a function of the time they have lived in their current unit. At the centre of this are “renovictions”, where the landlord conducting extensive renovations that requires the termination of the leases. It is not always clear if these renovations are matter of necessity to prolong the life of the building (which is quite old in many cases), or if it primarily motivated by a combination of the desire to circumvent rent control and capture higher rents for higher quality renovated units.
Of note is that the moving penalty is generally higher in Provinces with rent control.
To better understand this we can correlate the moving penalty with the vacancy rate that we looked at earlier today.

The scatterplot with all bedroom types gets a bit messy, but things get much clearer if we correlate the variables separately by number of Bedrooms. This shows that the moving penalty anti-correlates with the vacancy rate.
To round things off, we can also look at the fixed-sample rent change. Here we expect a high pressure to raise rents in areas with a high moving penalty, which would lead to higher fixed-sample rent increases.

This graph shows that fixed-sample rents indeed correlate with the moving penalty. At some point it is probably worth looking into these relationships more closely.
As always, the code for the analysis is available on GitHub for anyone to reproduce, adapt or appropriate for their own purposes.
Reuse
Citation
@misc{moving-penalty.2018,
  author = {{von Bergmann}, Jens},
  title = {Moving {Penalty}},
  date = {2018-11-28},
  url = {https://doodles.mountainmath.ca/posts/2018-11-28-moving-penalty/},
  langid = {en}
}
