(Joint with Nathan Lauster and cross-posted at HomeFreeSociology)
TLDR
Canadian Census data on “Dwellings Unoccupied by Usual Residents” are frequently misunderstood. Now that data from 2021 are out, we provide a timely explainer and draw upon a variety of resources, including comparisons with US data, Empty Homes Tax data, and zooming in on census geographies, to help people interpret what we can see.
Canada Unoccupied
Given that ongoing occupations are so much in the news, let’s turn the channel to talk about those parts of Canada that are unoccupied!
We have new census data with population, dwelling and household counts. This gives us a first view on how neighbourhoods in Canada have changed. For better or worse, one metric that can be derived from these three census variables is “dwellings not occupied by usual residents,” otherwise known as the difference between dwelling units and households.
This metric is frequently misunderstood and we have devoted a lot of digital ink attempting to clear things up. With new data out we are already seeing bad takes based on this metric in the news. And it only gets worse when looking at social media commentary.
Explainer
What does “not occupied by usual residents mean”? In Canada this metric can be decomposed into two components: 1) dwellings that were unoccupied on census day, and 2) dwellings that were occupied, but by people who have their usual residence elsewhere. This second category includes, for instance, people working and living temporarily in a different city and students that return to their parent’s place at the end of the semester. Out of these two components, actually unoccupied dwellings make up the vast majority of unoccupied by usual resident dwellings, but in some regions, for example college towns, temporarily occupied dwellings can make up half of such dwellings. By way of illustration, for the censuses 2001 through 2016 we have a cross-tabulation on CensusMapper that shows just the unoccupied dwellings, which can additionally be sliced by structural type of dwelling.
So what’s going on with unoccupied dwellings? Social media and many (poorly done) news reports would have us believe these are indicative of some form of “toxic demand” or empty “safety deposit boxes in the sky.” But is this the case?
There are multiple sources of data that can help shed light on the nature of dwellings counted as unoccupied in the census. First, we can put Canadian rates of units not occupied by usual residents in context with US cities, where the ACS collects information on the reason why a dwelling unit may be unoccupied. Second, we can look at a cross tabulation of document type (detailing if the dwelling is occupied by usual residents, temporarily present persons, or unoccupied) and structural type. Third, we can look at relevant administrative data, including the City of Vancouver’s Empty Homes Tax and BC’s Speculation & Vacancy Tax. Finally, we can zoom in and look in more detail at the data newly released from the 2021 Census results.
Comparison to US ACS data

In this infographic we match data from the last Census (2016) to ACS data from the same year. The closest to “toxic demand” or “empty safe deposit boxes in the sky” in the ACS data would appear to be dwellings showing up in green for “seasonal, recreational or occasional use.” These are the sort generally welcomed by vacation destinations like Miami. By contrast, other big cities, like Detroit, see what looks more like a “toxic lack of demand” in “other,” likely abandoned dwellings (showing up in brown), though “other” is a broad term encompassing many possible reasons for vacant dwellings (e.g. recent death of owner). The rest of the vacancies showing up in US data tend to be temporary and transactional (related to sales and rentals). We don’t get this same breakdown in the Canadian data, but we expect the underlying patterns to be similar, suggesting a baseline of vacancies associated with normal transactions; not unoccupied long term, but merely on Census day. Larger variation in occasional and other uses which may reflect longer-term vacancies is layered on top.
Document type by structural type
Refined data from the 2016 Census (not yet available in 2021) also enables us to split out unoccupied units by structural type of dwelling. Let’s take a look at what this looks like for three Canadian cities: the City of Vancouver, City of Toronto, and City of Ottawa.
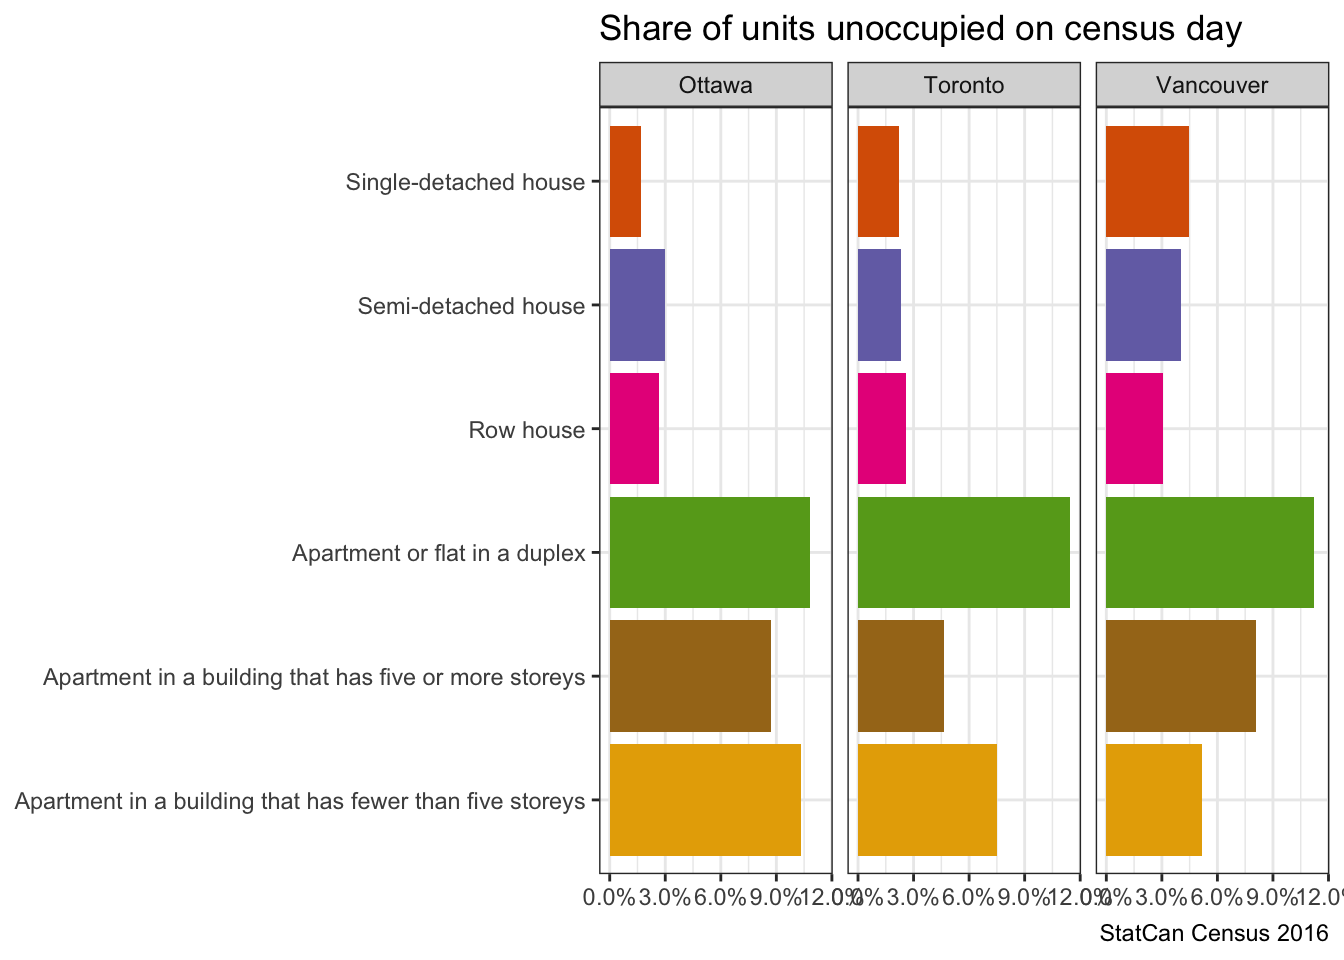
We note that in all three cities, the dwelling type most likely to register as unoccupied is an apartment in a “duplex.” Duplex is the designation the Census gives to buildings when a basement apartment is added to a single-family detached house, turning both the upper and lower unit created into “apartments in a duplex.” The census puts in an effort to find these slippery and often informal kinds of housing. But it’s tricky to do well and keep up with these flexible units. When a homeowner reabsorbs the suite into the main unit or chooses not to rent it out for whatever reason, the suite registers as unoccupied in the census. Accordingly, the distribution of housing stock matters for occupancy rates. Cities with lots of secondary suites mixed into their dwelling stock tend to register with higher rates of unoccupied homes.
Administrative Data
Let’s turn to administrative data from the City of Vancouver’s Empty Homes Tax (EHT) and BC’s Speculation and Vacancy Tax (SVT). While the most recent data from these taxes extend only to 2020, they provide a bridge, of sorts, between the 2016 Census and the 2021 Census, and also establish estimates of the prevalence of problematic long-term vacancies, as defined by the taxes for these years. Of note, the taxes were put in place in 2017 (EHT) and 2018 (SVT) amid the perception that problematic long-term vacancies were widespread, in part extending from misinterpretations of Census data.
Below we plot the percentage of Private Dwellings Unoccupied by Usual Residents from the 2016 and 2021 Census against the percentage of Taxable Properties Containing Dwellings taxed as “Empty” in the publicly reported EHT and SVT data. For EHT, we also note properties declared exempt from taxation but not occupied by an owner or renter. These properties represent possible long-term empty dwellings (as distinct from shorter term empty dwellings that would also be caught by the Census).
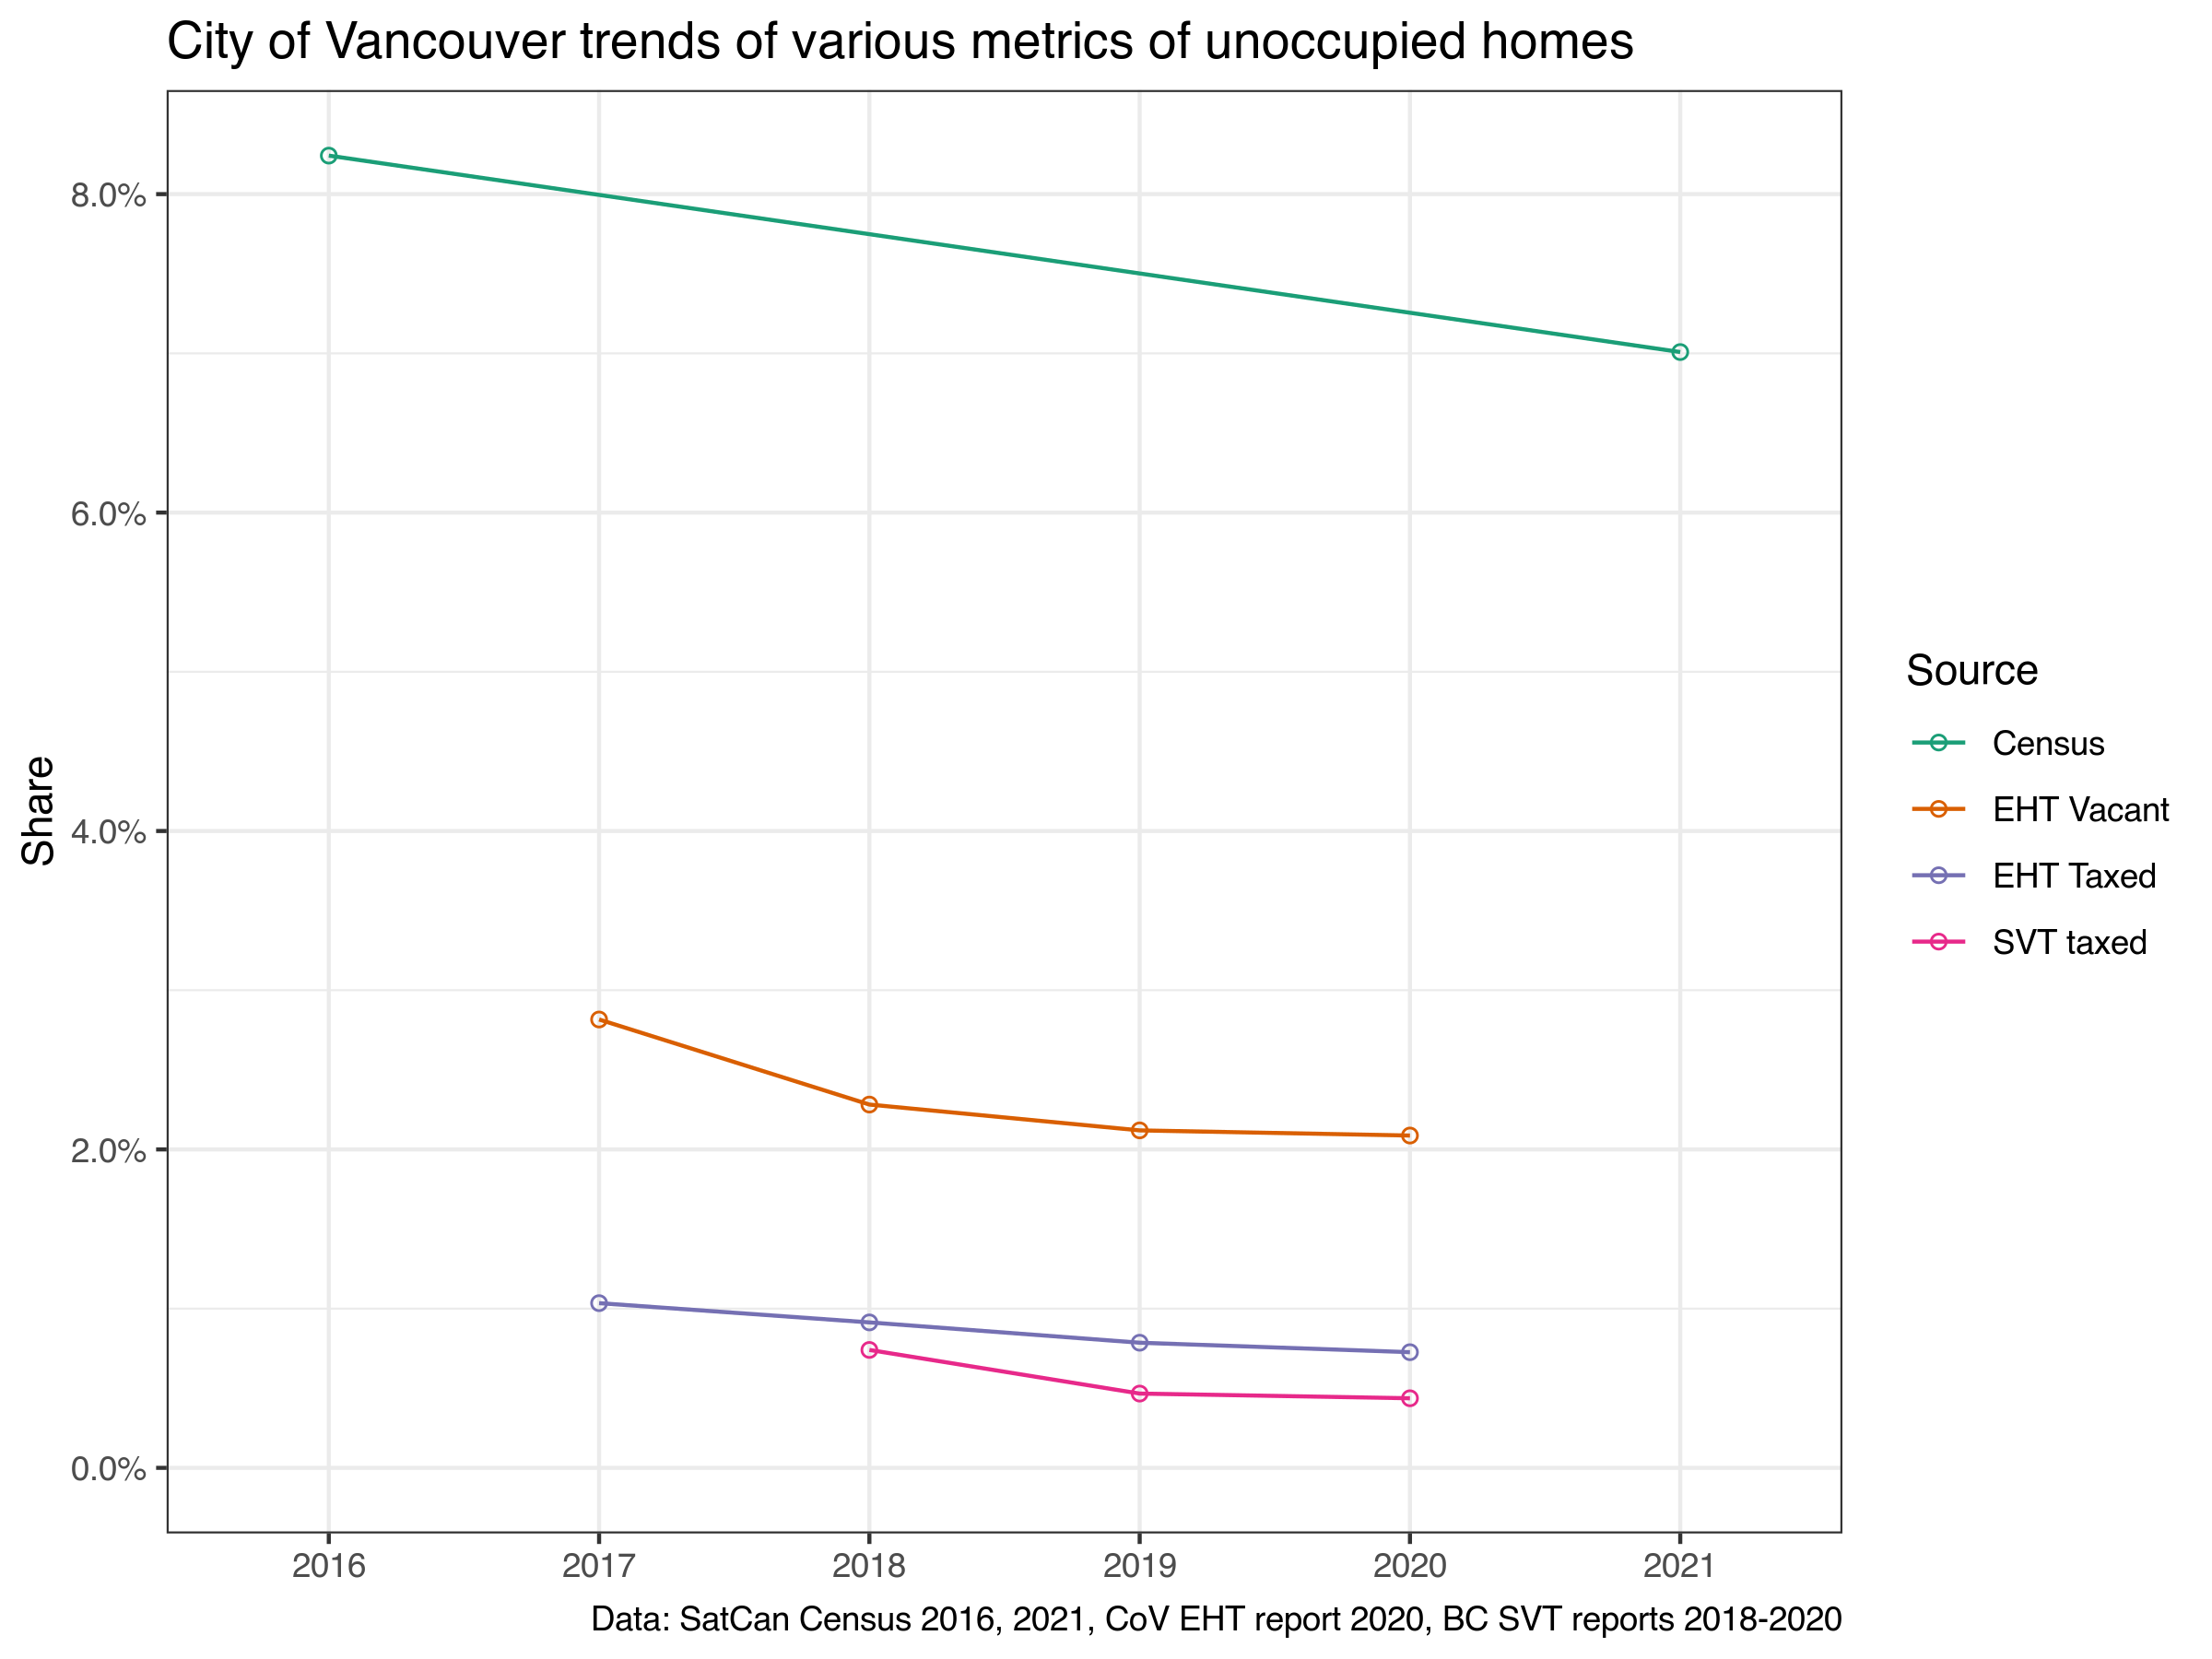 The percentage of dwellings showing up as plausibly vacant in the Empty Homes Tax data is far below the percentage showing up as Unoccupied by Usual Residents in the Census data. This likely reflects a combination of factors, including the Census referring specifically to occupation on Census day, and hence picking up dwellings that were just temporarily vacant. Indeed, most of the dwellings picked up in the EHT data as plausibly vacant are still exempt from taxation. The largest reason for exemption is that the properties changed hands during the tax year, emphasizing the role of regular transactions in driving short-term vacancies.
Properties actually taxed as problematic vacancies are quite rare in the City of Vancouver, declining from just over 1% to just under 1% between 2017 and 2020. Between the Census years spanning that period, the percent of dwellings declared Unoccupied by Usual Residents declined from just over 8% to 7%. Can we suggest that around 1-in-8 dwellings determined to be unoccupied by usual residents on Census day reflect problematic long-term empty dwellings (a.k.a. “toxic demand”)? Tempting, but not quite. For one, our denominators for percentage figures from Census (private dwellings) and tax data (taxable properties) aren’t quite the same. Mostly this reflects the prevalence of single properties containing multiple dwellings, including our “duplexes” discussed above, but also most purpose-built rental apartment buildings. To re-examine the issue, let’s just get rid of denominators and look at raw numbers of dwellings deemed unoccupied by usual residents or deemed empty and taxed as such.
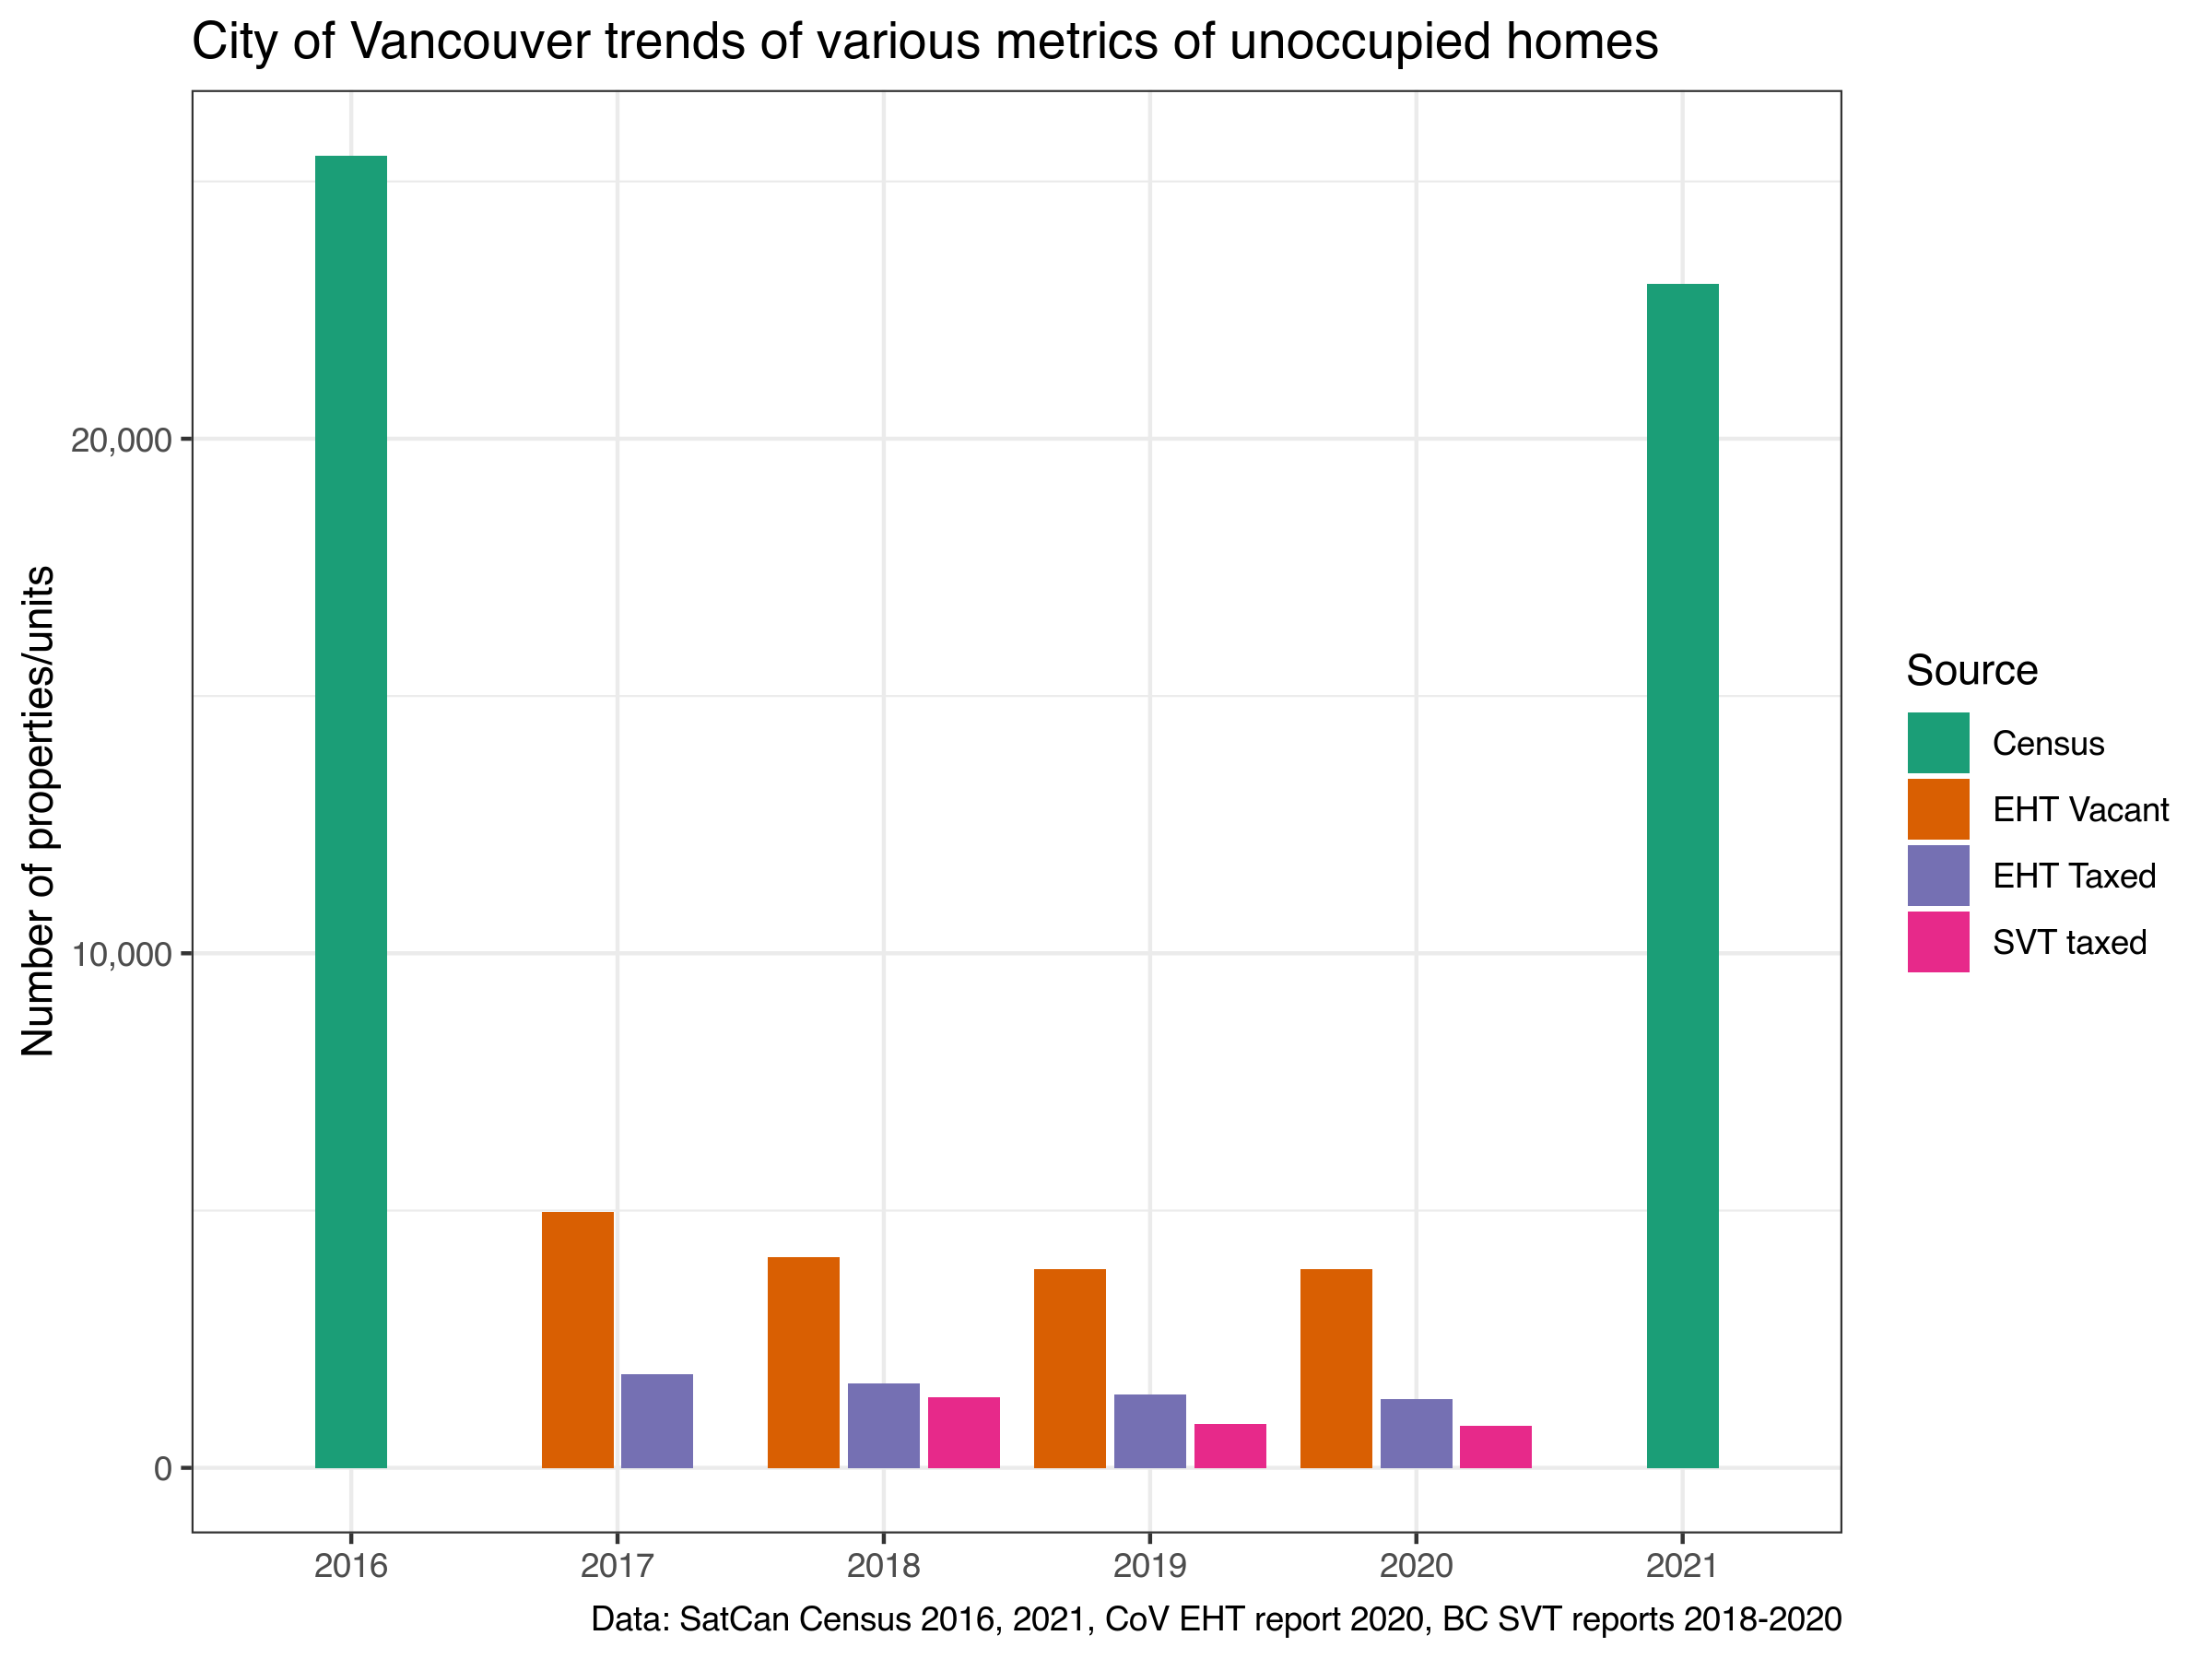
Looking just at raw numbers, it looks like instead of 1-in-8 unoccupied hit with a tax, we get closer to 1-in-12 when the Empty Homes Tax first when into effect in 2017 (matched to 2016 Census), dropping to more like 1-in-15 by 2020 (matched to 2021 Census). For the Speculation and Vacancy Tax, the figures are even lower, declining to one property taxed in 2020 for every twenty-eight dwellings showing up as unoccupied by usual resident in 2021. (It appears to us that the difference between SVT taxed and EHT taxed is largely explained by different reporting standards emphasizing only properties declared as empty for SVT data vs. properties declared, determined, or deemed to be vacant in the EHT data.)
It’s difficult to say what the rate of Dwellings Unoccupied by Usual Residents would look like in the City of Vancouver absent the EHT and SVT. It’s a counterfactual, requiring some thought and many assumptions to work out properly. For instance, we should keep in mind that the 2021 census happened during COVID times, with possible short as well as long term effect of COVID further muddying the waters. But we can say that at this point it appears very little of what shows up as Dwellings Unoccupied by Usual Residents in the Census translates into problematically empty dwellings as defined by the Empty Homes and Speculation & Vacancy Taxes.
Does this mean the Empty Homes Tax is useless? Probably not. And it’s notable that Census data and EHT data agree on a decline in unoccupied by usual resident and vacant dwellings. Returning to the ACS data, it’s apparent that inter-city variation is largest in uses like temporary residences that drive EHT or SVT taxed empties. Once taxes are put in place on long-term vacancies, it likely reduces the proportion of properties used for temporary residence. This, in turn, likely reduces the ratio of properties taxed as problematically empty relative to properties showing up as Unoccupied by Usual Residents in the Census. But as in the Vancouver data, we can see that the overall effect is probably limited. This, quite simply, is because in most cities the vast majority of dwellings showing up as Unoccupied by Usual Residents in the Census are not actually long-term or problematically vacant.
Zooming in on Vancouver
Finally, let’s turn to the geographic distribution of Dwellings Unoccupied by Usual Residents, plotting the new 2021 data for the City of Vancouver at the Census Tract level.
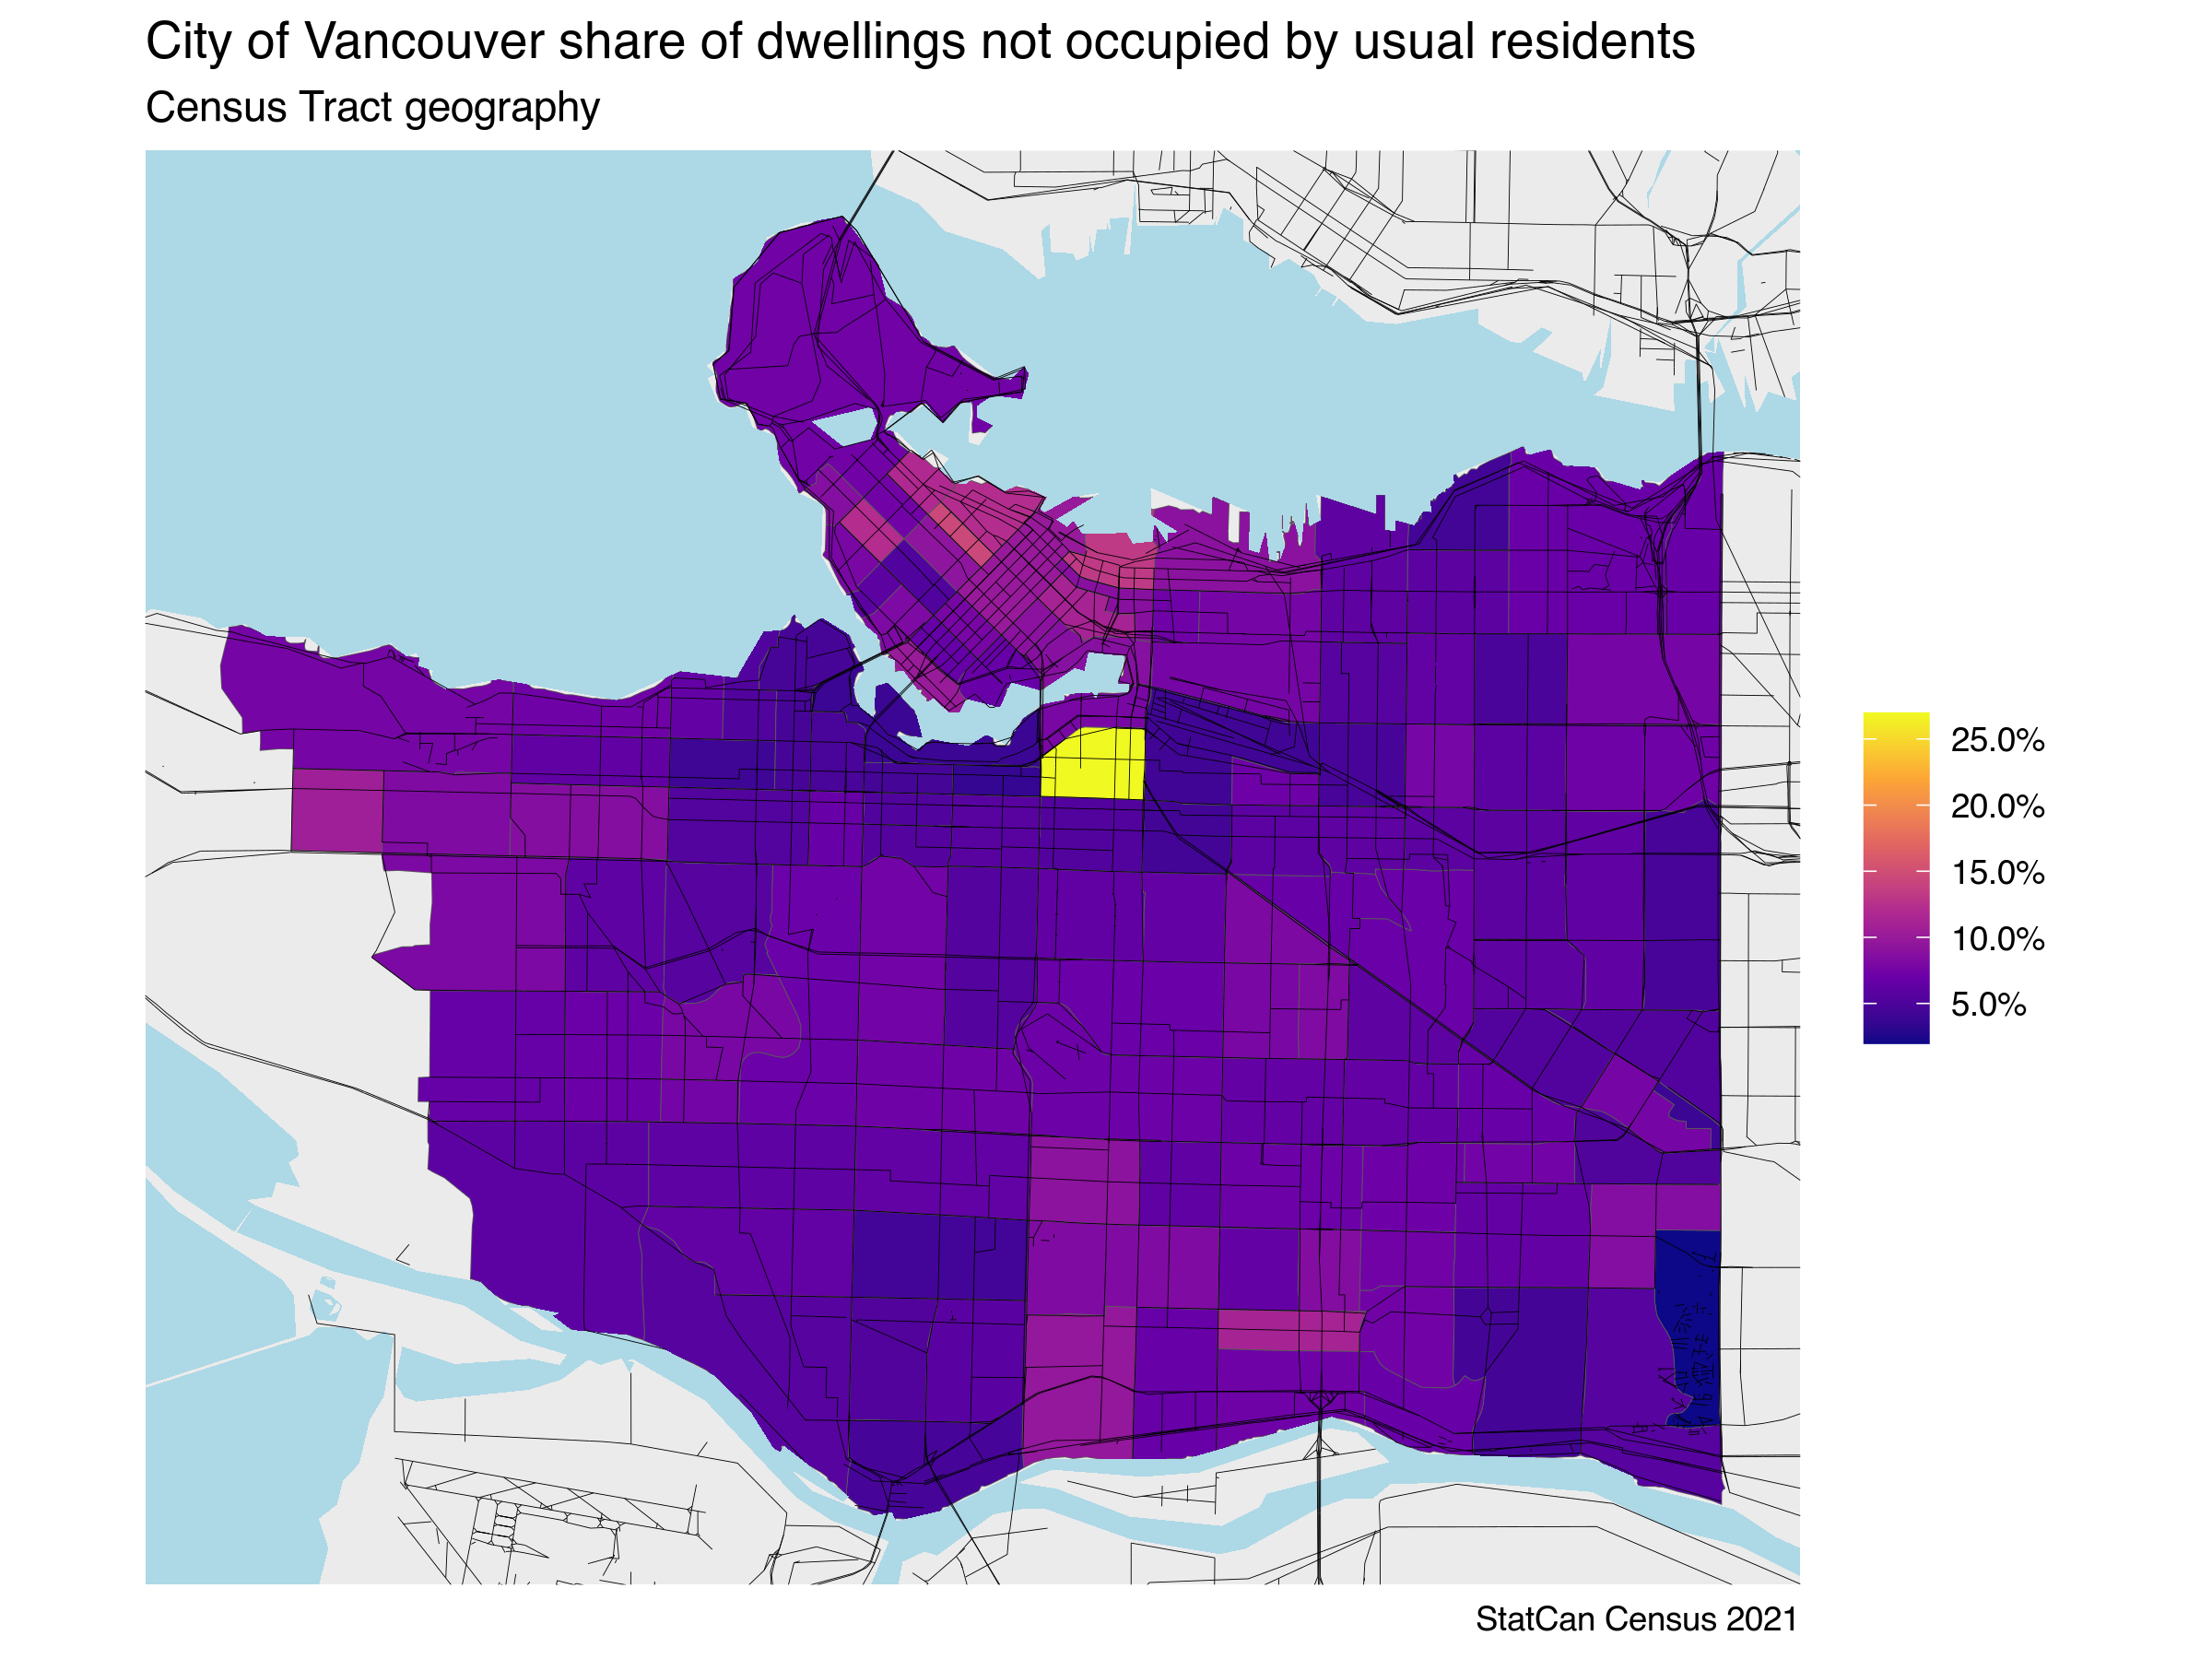
We see the rate of Dwellings Not Occupied by Usual Residents varies throughout the city, but some areas jump out. And just like when the 2016 numbers come out some hapless commentator will inevitably zoom in on the bright areas and complain about empty homes.
One census tract, Census Tract 9330049.05 south of 2nd Ave between Cambie and Main, stands out with 27% of dwellings not occupied by usual residents. Let’s take a closer look and try and get ahead of silly arguments like commentators claiming that “speculation is one of our prime suspects” or running headlines decrying this as a case of empty or underused housing.
Enhance
Tract level household and dwelling counts are summed up from dissemination areas, so let’s switch our map resolution to that finer-grained level census geography.
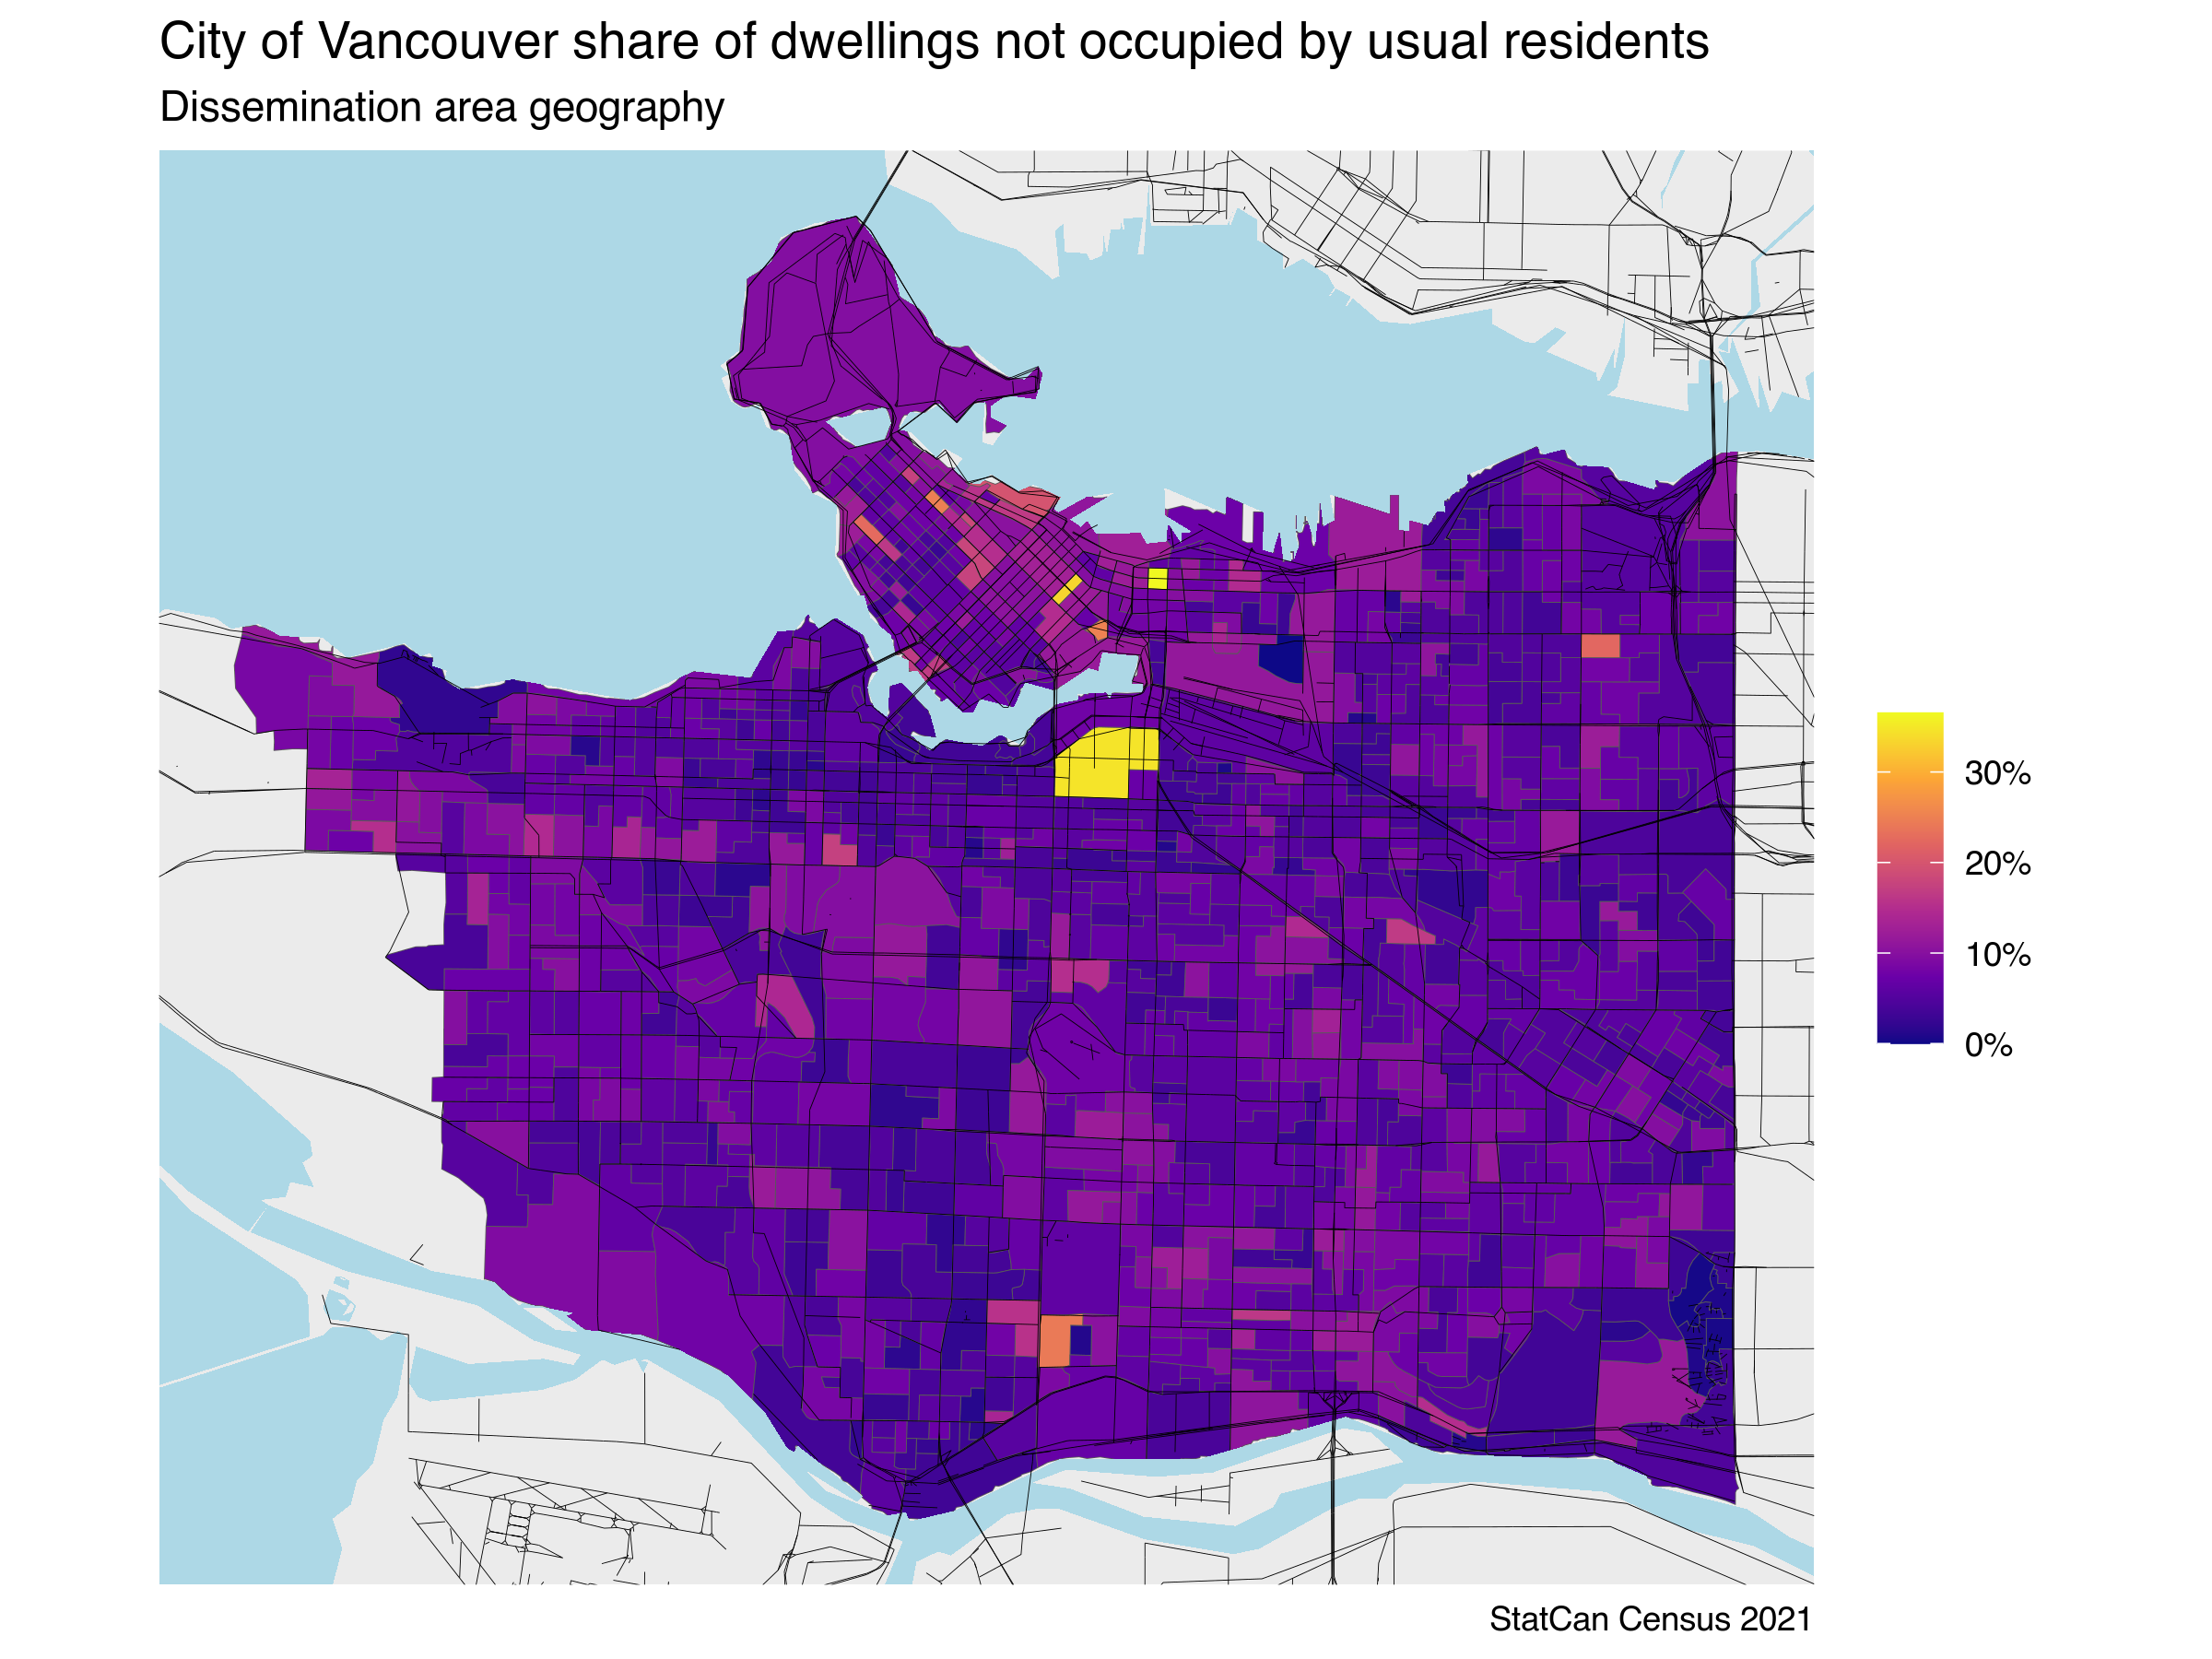
That only added moderate detail, splitting the census tract into two dissemination areas, the larger of the two now sporting a share of 35% dwellings not occupied by usual residents, adding up to 253 “unoccupied” dwellings. Let’s zoom in even more to locate where the census found those “empty” homes.
Enhance more
Dissemination blocks are the finest level of geography for which the census releases this data. So let’s utilize blocks to take an even closer look at our tract of interest and add block counts of dwellings unoccupied by usual residents.
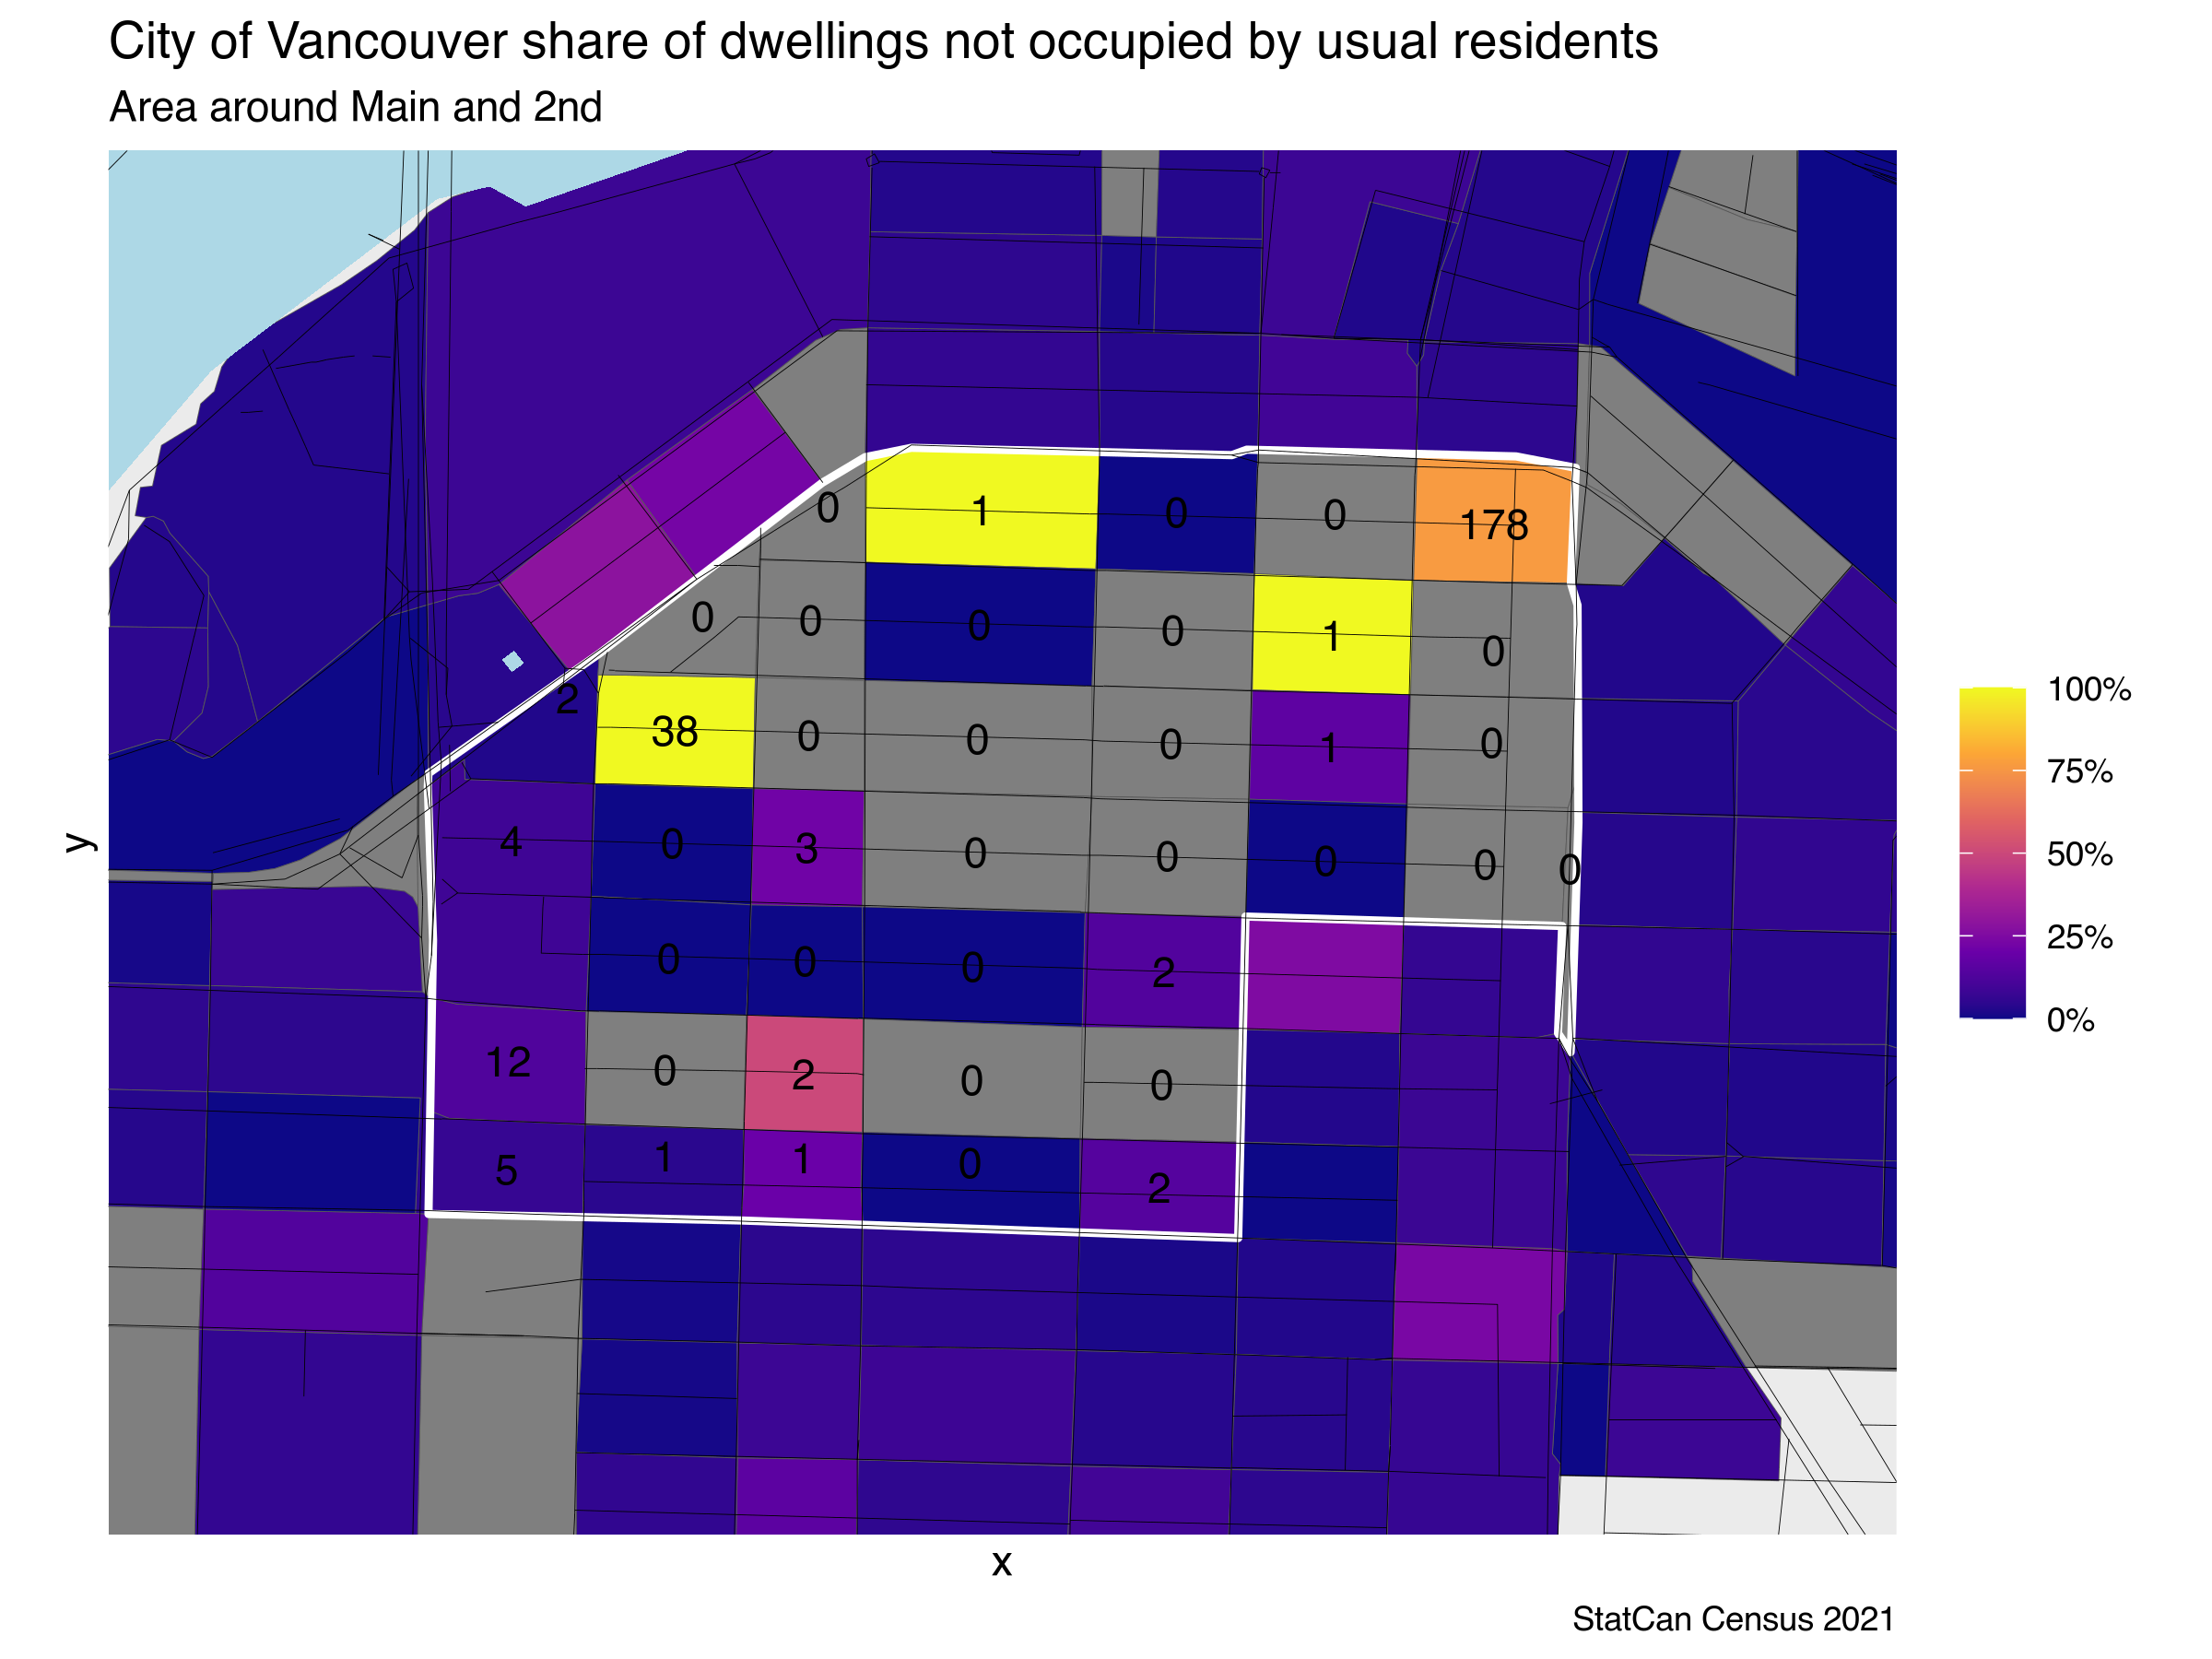
Blocks enable us to pinpoint how the higher level geography numbers were derived and where problematic buildings may be located. Three of the areas show up as 100% unoccupied, but two of them only have a single dwelling unit. These may be live-work spaces in this mostly industrial area. But one block shows up as having 38 dwelling units. And while the block at the corner of Main and 2nd has a lower share of units not occupied by usual residents, the total count comes out at 178. Let’s take a closer look at those two blocks.
Main and 2nd
The building at the southwest corner of Main and 2nd was newly constructed around census day. The census counted 233 dwelling units on this block with no other apparent housing on it, with 178 dwelling units not occupied by usual residents. It’s likely the case that residents simply hadn’t yet moved in to this building that completed quite near to Census day. The effect here is similar to what we witnessed for newly constructed areas in 2016 where an outcry was raised over vacancies picked up by the census data release.
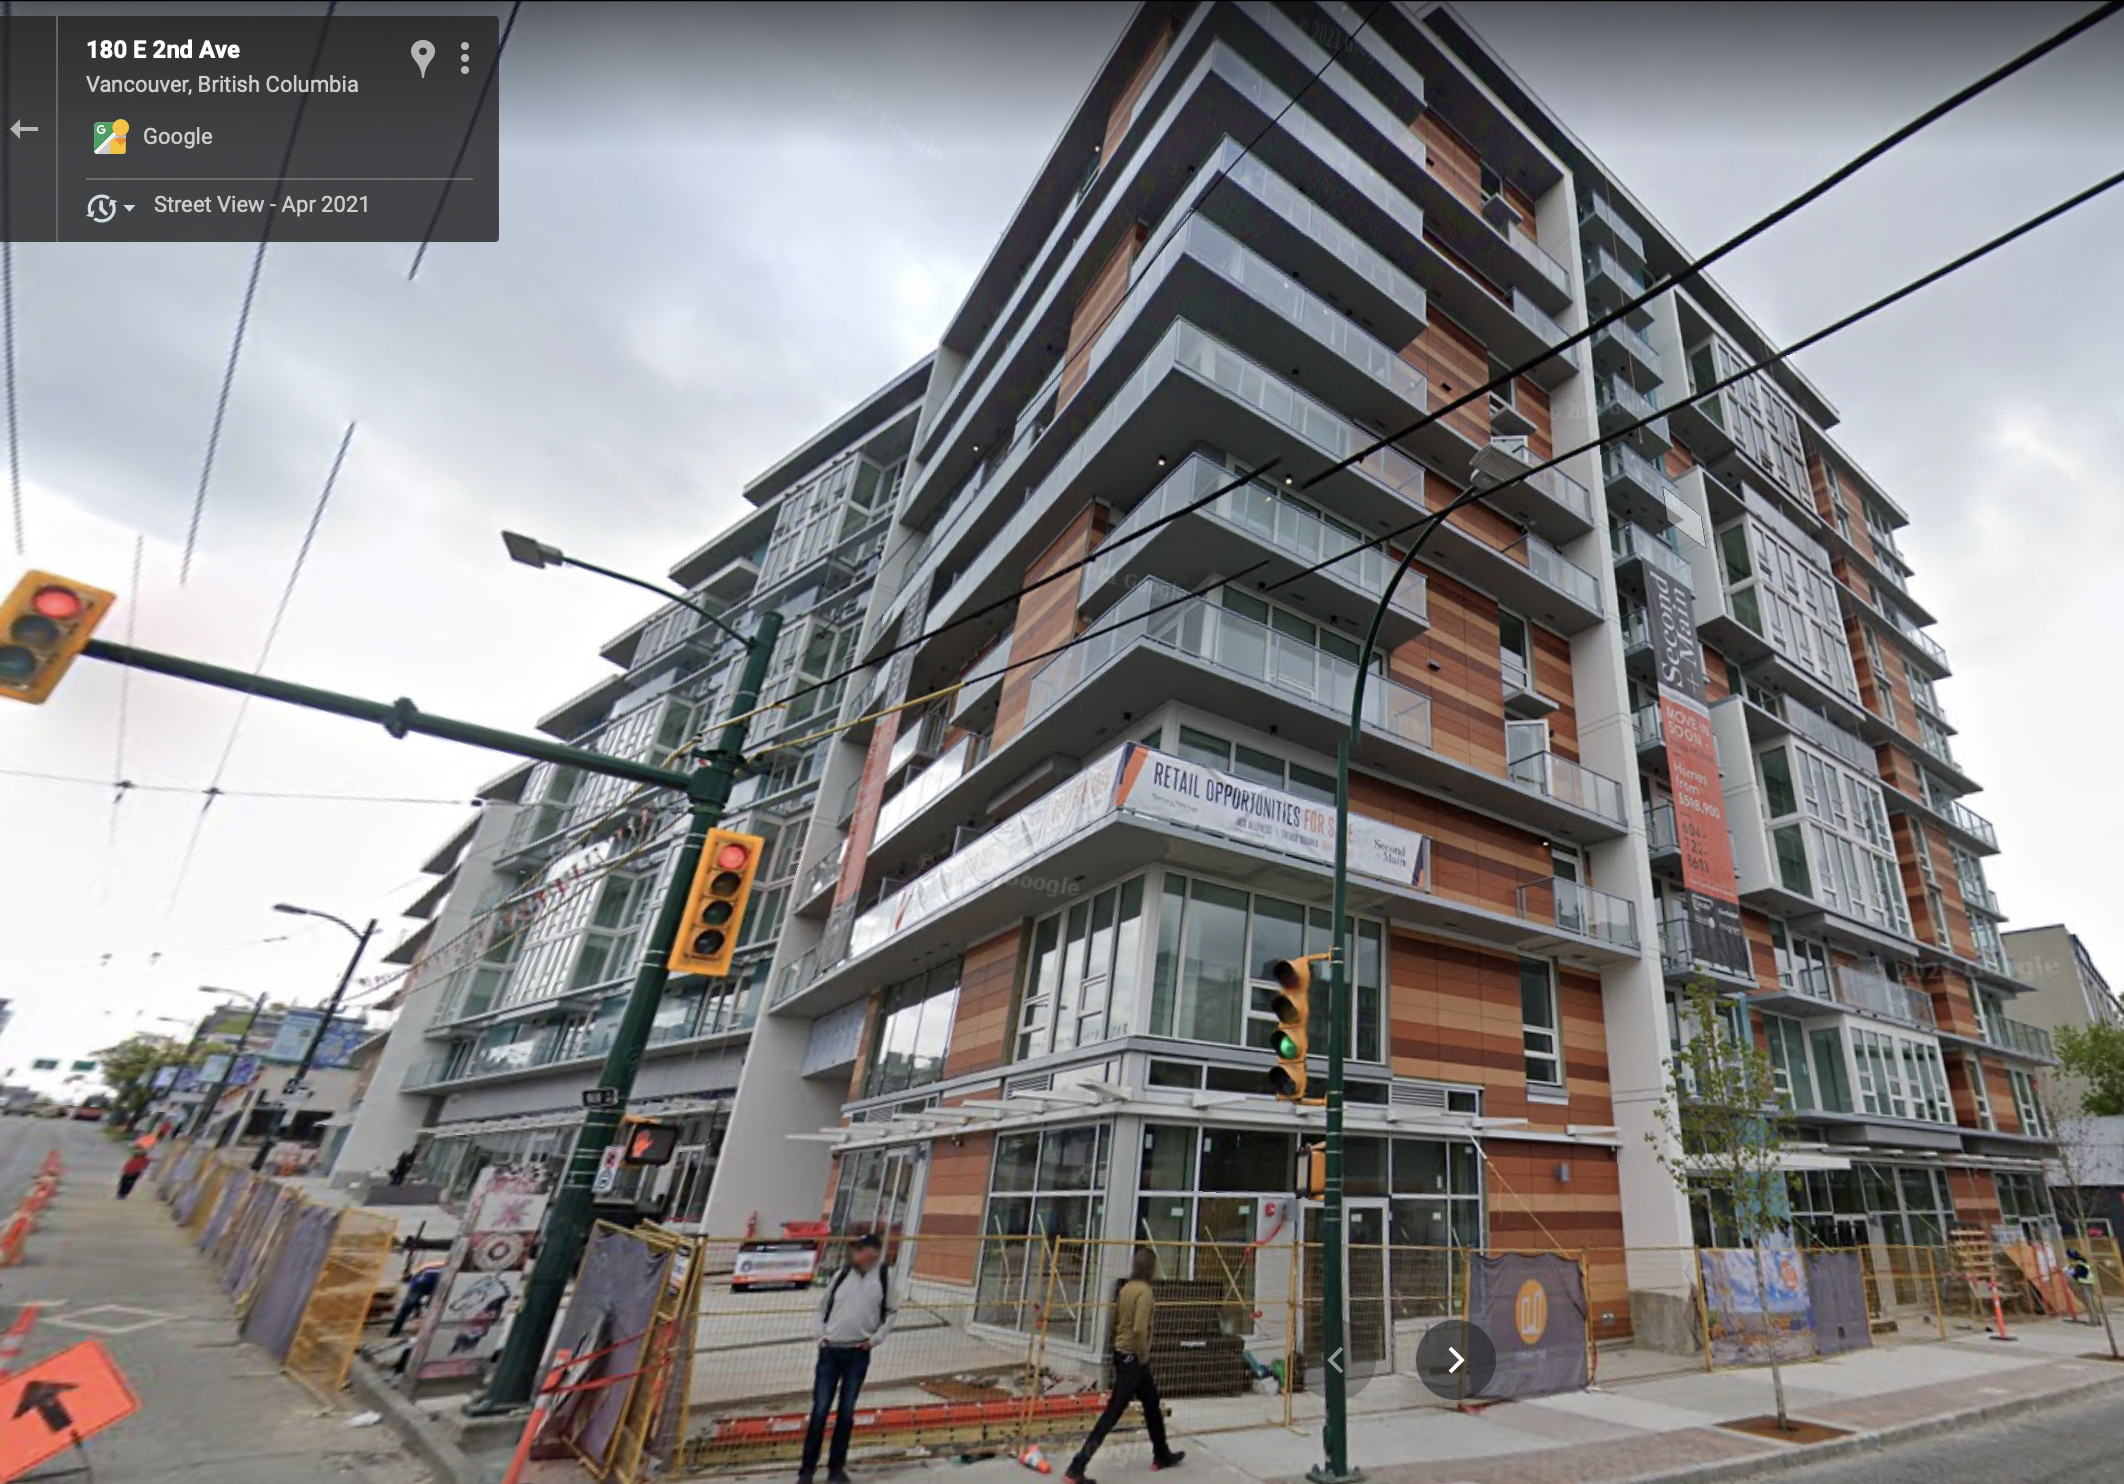
While we know the building is new, we can also perform a quick check with CMHC completions data to see how many units got completed close to census day in 2021. One complication is that CMHC data for 2021 was still reported on 2016 boundaries, and the census tract in question came from 2016 census tract 9330049.01 which was split into four separate tracts in 2021. Doing a quick check at the census tract level from January through June 2016 on census tract 9330049.01 reveals that indeed 263 apartment units completed in April 2021, most of which are likely the ones in the building in question.
Yukon and 5th
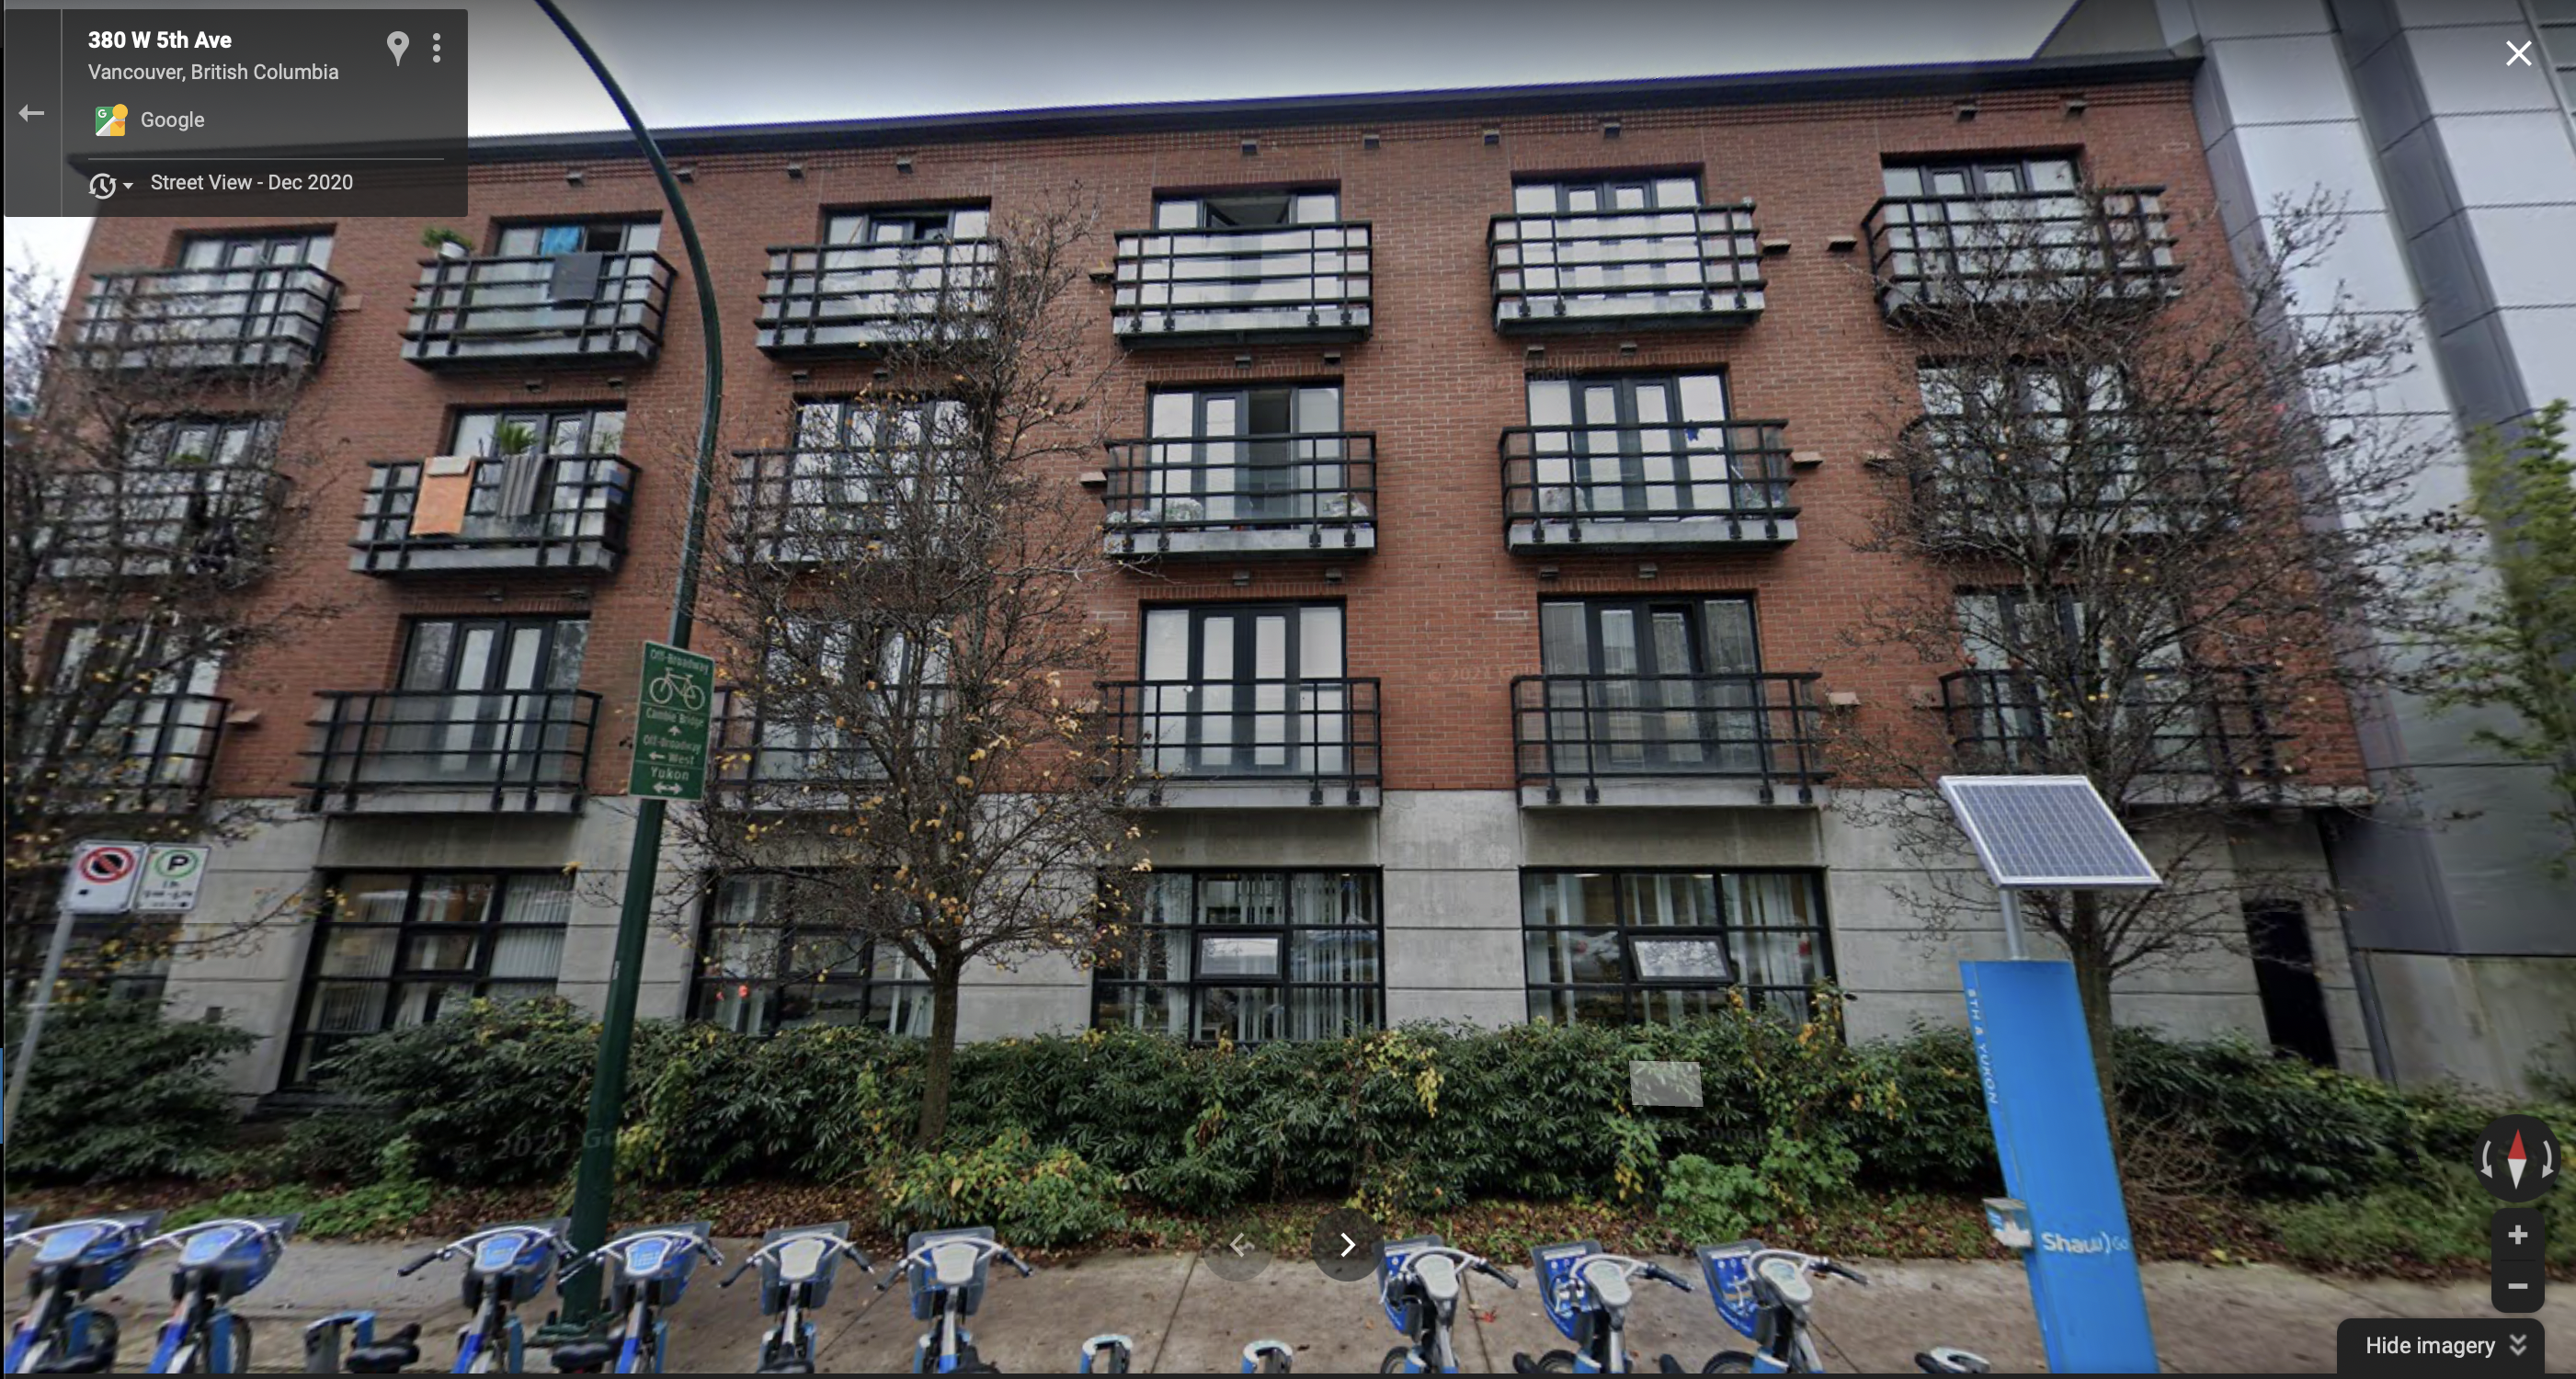
There are 38 dwelling units with nobody living in them at the block with the Yukon Shelter and no other apparent housing units. The shelter states that it is for people in “emergency and transitional situations”, which is why people living there would not be classified as usual residents. This is an example where all these units are very likely lived in as shelter or transitional housing units, just not by people classified as usual residents.
The bigger picture
With these examples under our belt we can start to appreciate some of the complexities of this metric. When the Census counts Dwellings Unoccupied by Usual Residents, it’s a by-product of their primary aim, which is simply to find out where everyone in Canada is living on Census Day. Dwellings are tabulated to provide a frame for finding people. As such, the Census doesn’t care that much about overshooting its count of dwellings (as we see with secondary suites in duplexes). What it cares about is finding people and linking them back to a single residence (which explains how we get dwellings occupied by people who aren’t usual residents). We suggest that Dwellings Unoccupied by Usual Residents can still be an interesting metric, but only when treated with appropriate caution.
So our final takeaway is that when you see commentators throwing out figures on Dwellings Unoccupied by Usual Residents without appropriate cautions, or as a straightforward indicator of Empty Homes, keep in mind that it’s an indicator of something else entirely. It’s an indicator they don’t know much about housing.
As usual, the code for this post, including the code to scrape the data out of the PDFs, is available on GitHub for anyone to reproduce or adapt.
Reproducibility receipt
## [1] "2022-03-29 18:09:01 PDT"## Local: master /Users/jens/Documents/R/mountaindoodles
## Remote: master @ origin (https://github.com/mountainMath/doodles.git)
## Head: [b35bffa] 2022-02-19: rent change vs vacanct rates post## R version 4.1.2 (2021-11-01)
## Platform: aarch64-apple-darwin20 (64-bit)
## Running under: macOS Monterey 12.3
##
## Matrix products: default
## BLAS: /Library/Frameworks/R.framework/Versions/4.1-arm64/Resources/lib/libRblas.0.dylib
## LAPACK: /Library/Frameworks/R.framework/Versions/4.1-arm64/Resources/lib/libRlapack.dylib
##
## locale:
## [1] en_CA.UTF-8/en_CA.UTF-8/en_CA.UTF-8/C/en_CA.UTF-8/en_CA.UTF-8
##
## attached base packages:
## [1] stats graphics grDevices utils datasets methods base
##
## other attached packages:
## [1] mountainmathHelpers_0.1.3 cmhc_0.1.0
## [3] tongfen_0.3.5 cancensus_0.5.0
## [5] sf_1.0-7 forcats_0.5.1
## [7] stringr_1.4.0 dplyr_1.0.8
## [9] purrr_0.3.4 readr_2.1.2
## [11] tidyr_1.2.0 tibble_3.1.6
## [13] ggplot2_3.3.5 tidyverse_1.3.1
##
## loaded via a namespace (and not attached):
## [1] Rcpp_1.0.8.3 lubridate_1.8.0 class_7.3-20 assertthat_0.2.1
## [5] digest_0.6.29 utf8_1.2.2 R6_2.5.1 cellranger_1.1.0
## [9] backports_1.4.1 reprex_2.0.1 evaluate_0.15 e1071_1.7-9
## [13] httr_1.4.2 blogdown_1.8 pillar_1.7.0 rlang_1.0.2
## [17] readxl_1.3.1 rstudioapi_0.13 jquerylib_0.1.4 rmarkdown_2.13
## [21] munsell_0.5.0 proxy_0.4-26 broom_0.7.12 compiler_4.1.2
## [25] modelr_0.1.8 xfun_0.30 pkgconfig_2.0.3 htmltools_0.5.2
## [29] tidyselect_1.1.2 bookdown_0.25 fansi_1.0.3 crayon_1.5.1
## [33] tzdb_0.2.0 dbplyr_2.1.1 withr_2.5.0 grid_4.1.2
## [37] jsonlite_1.8.0 gtable_0.3.0 lifecycle_1.0.1 DBI_1.1.2
## [41] git2r_0.30.1 magrittr_2.0.2 units_0.8-0 scales_1.1.1
## [45] KernSmooth_2.23-20 cli_3.2.0 stringi_1.7.6 fs_1.5.2
## [49] xml2_1.3.3 bslib_0.3.1 ellipsis_0.3.2 generics_0.1.2
## [53] vctrs_0.3.8 tools_4.1.2 glue_1.6.2 hms_1.1.1
## [57] fastmap_1.1.0 yaml_2.3.5 colorspace_2.0-3 classInt_0.4-3
## [61] rvest_1.0.2 knitr_1.38 haven_2.4.3 sass_0.4.1Reuse
Citation
@misc{unoccupied-canada.2022,
  author = {{von Bergmann}, Jens and Lauster, Nathan},
  title = {Unoccupied {Canada}},
  date = {2022-02-14},
  url = {https://doodles.mountainmath.ca/posts/2022-02-14-unoccupied-canada/},
  langid = {en}
}
