The new CMHC Rms data is out today, and it’s been three years since we did our post on vacancy rates and rent change. That post still gets a lot of views, so maybe it’s a good time for an update.
The Rms survey is carried out in October, and the results used to come out in the following month. Checking the date of our post from three years ago it was written on November 28th reporting on the Rms from October 2018. But last year we had to wait until January to get the data, and this year it came out in February. The Rms provides important data that informs a lot of decisions, and I am having a hard time understanding why this can’t be delivered in a more timely fashion.
Additionally, CMHC again failed to release the Rms data on their Housing Market Information Portal until later in the day, the only organized way CMHC data can get accessed, but scattered it across a bunch of multi-line header Excel files. It’s 2022 and apparently CMHC still thinks that xlsx is an acceptable data release format. It is not, and I am scared to think what this says about CMHC’s internal data analysis practices.
Rental stock
Let’s start out with a look at the total purpose-built rental stock across Canadian Cities.

Those CMAs are quite different in size though, let’s look at the portion of dwelling units made up of purpose-built rental, using the fresh 2021 census data as a base.

That paints quite a different picture. Montreal still features prominently, but Toronto Vancouver don’t make it into the top 20. For reference, here is the share of dwelling units that are purpose-built rental in the regions with the highest total number of purpose-built rental units.

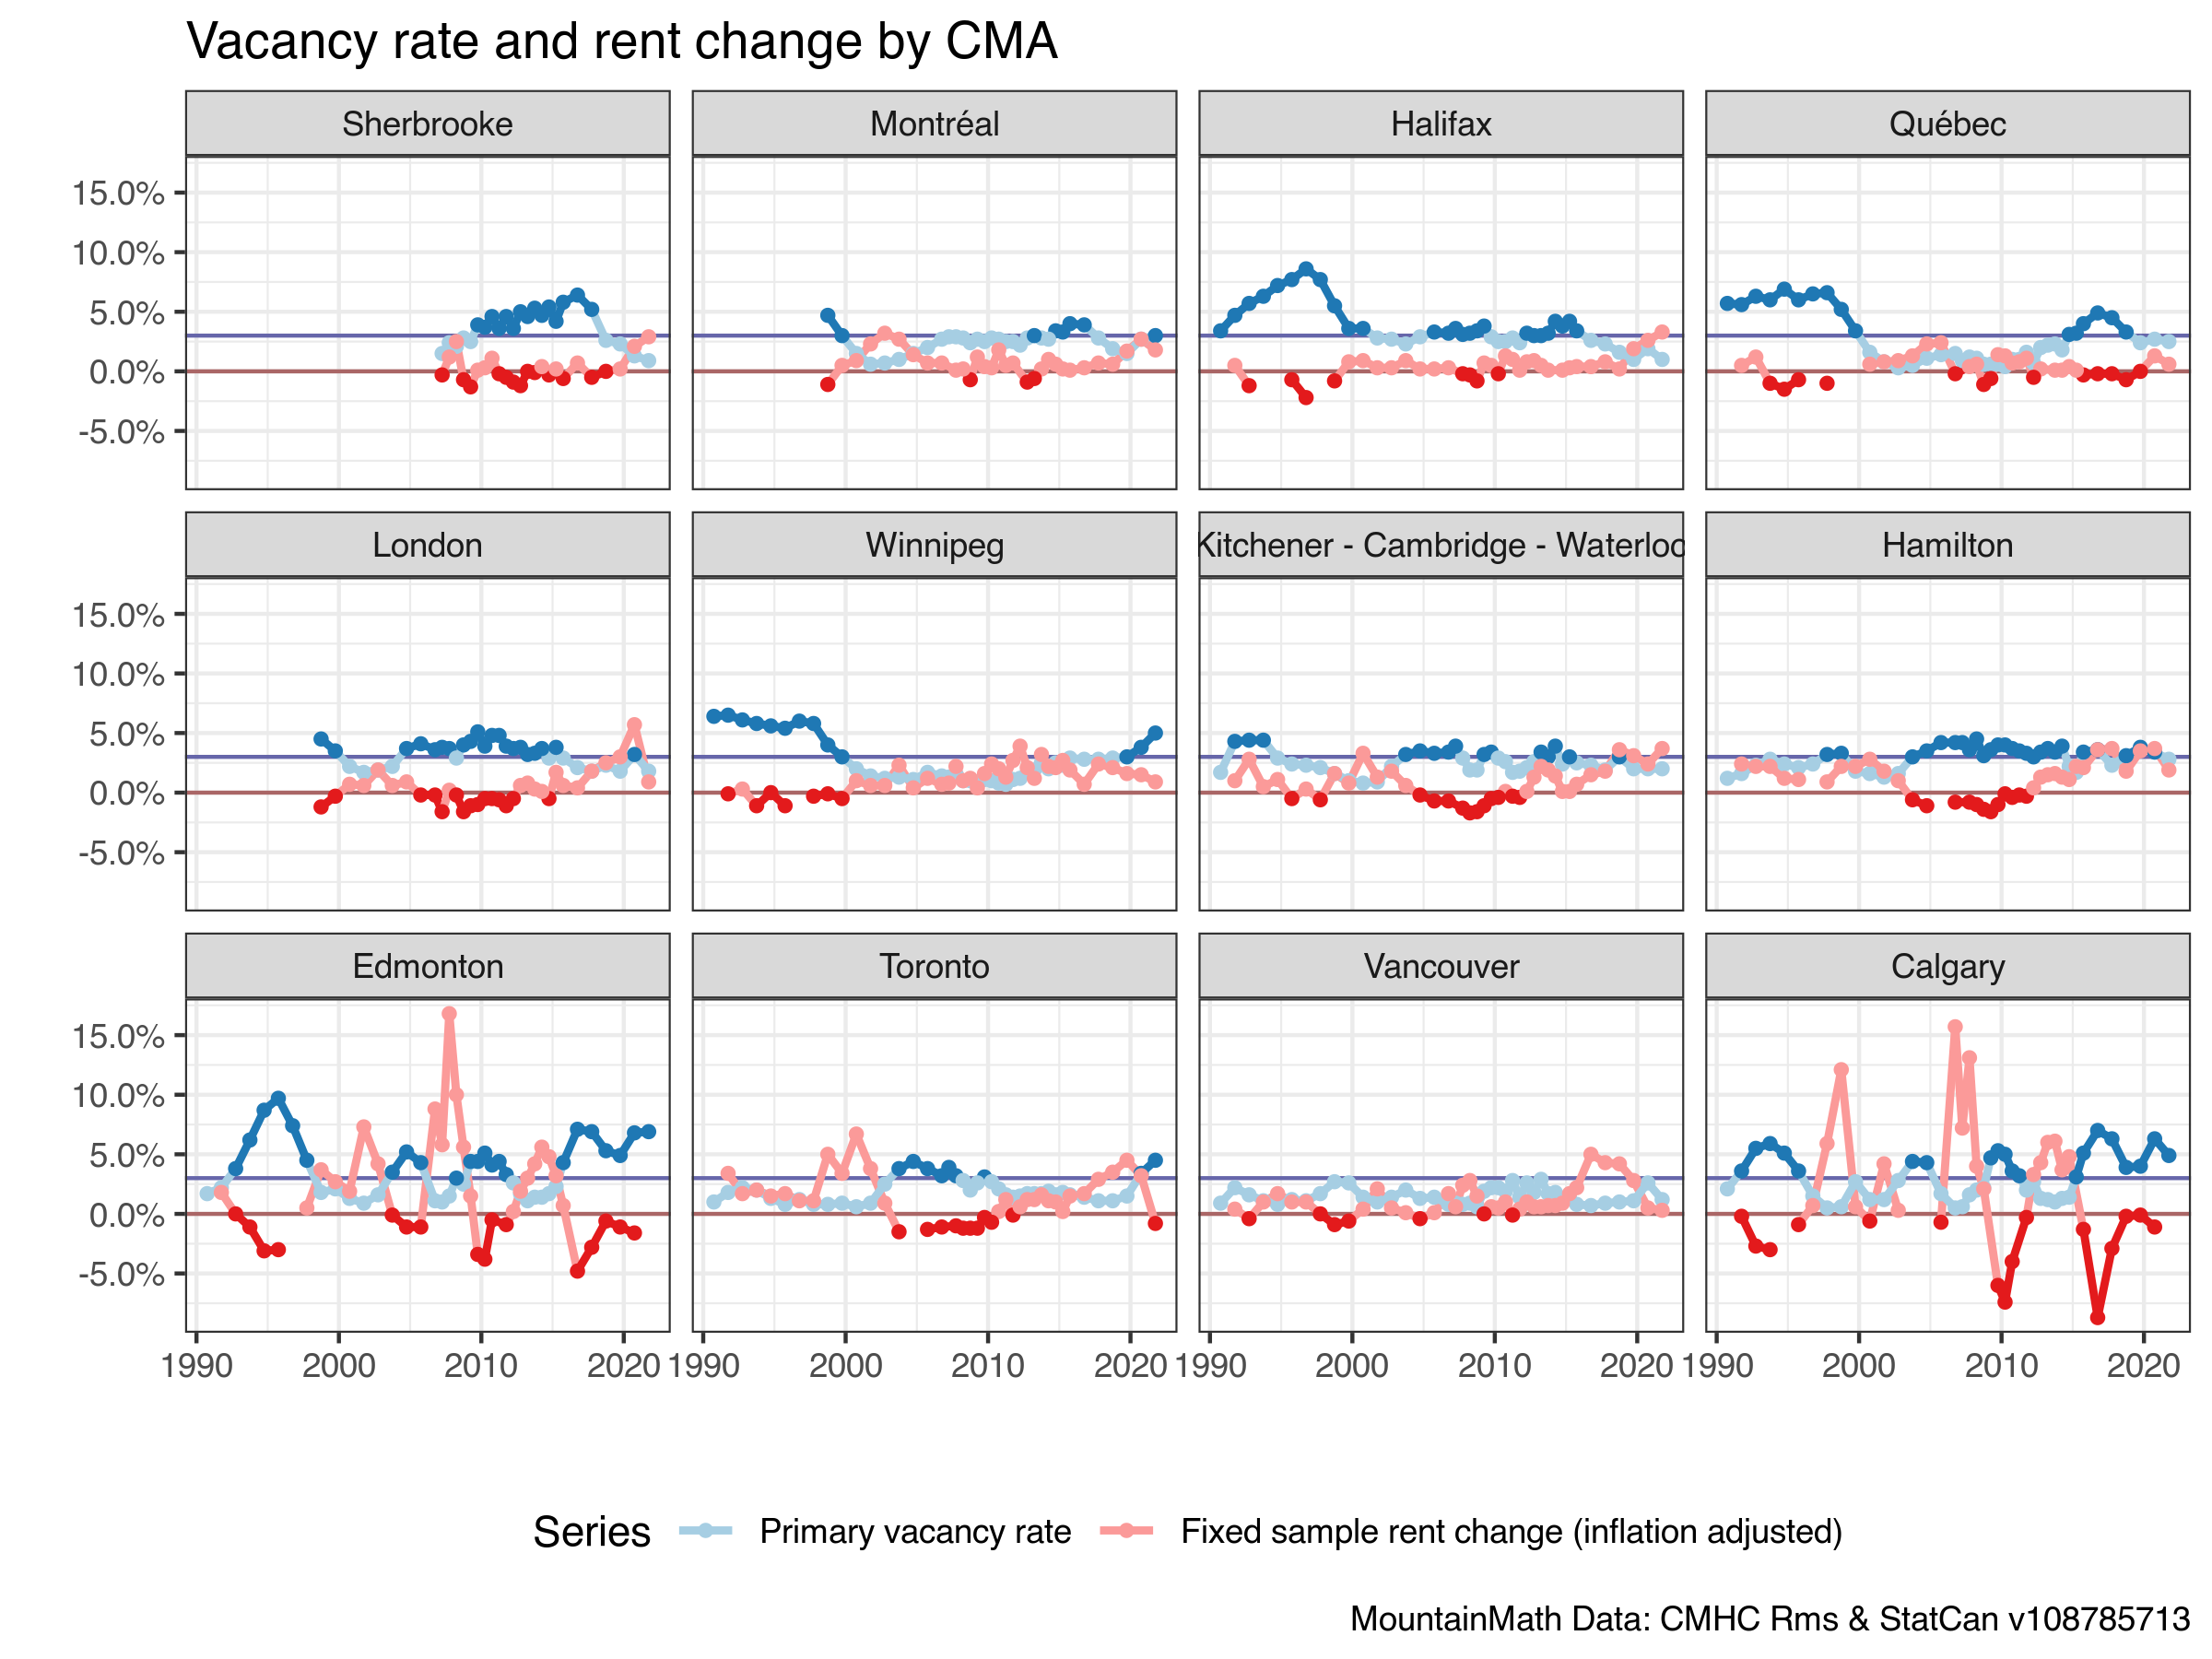
Time for the main act. Our main interest is the Rms vacancy rate, the share of apartment units vacant at the time of the survey and not rented out. US readers should note that this differs from the definitions used in the US where a unit will also be considered vacant if it’s rented but the renter has not moved in yet or has already moved out. We will compare this to the fixed sample rent change, the the change in average rent for a common set of units across two consecutive years. This can be thought of as some sort of Case-Shiller index for rentals, it is not skewed by addition of new stock or changes in composition of rental units. One important consideration is rent control. Rent control legislation varies across Canada and across time, with many provinces having implemented rent increase moratoriums during COVID times. And correspondingly the ability of landlords to increase rents of existing renters also varies, although rents are free to change arbitrarily after turnover.
This is essentially a redo of the graph from our post three years ago, with three more years of data and also added data points for the April survey for the years where CMHC surveyed units twice a year. We break the time series for years where there was no reliable estimate for a period longer than one year.
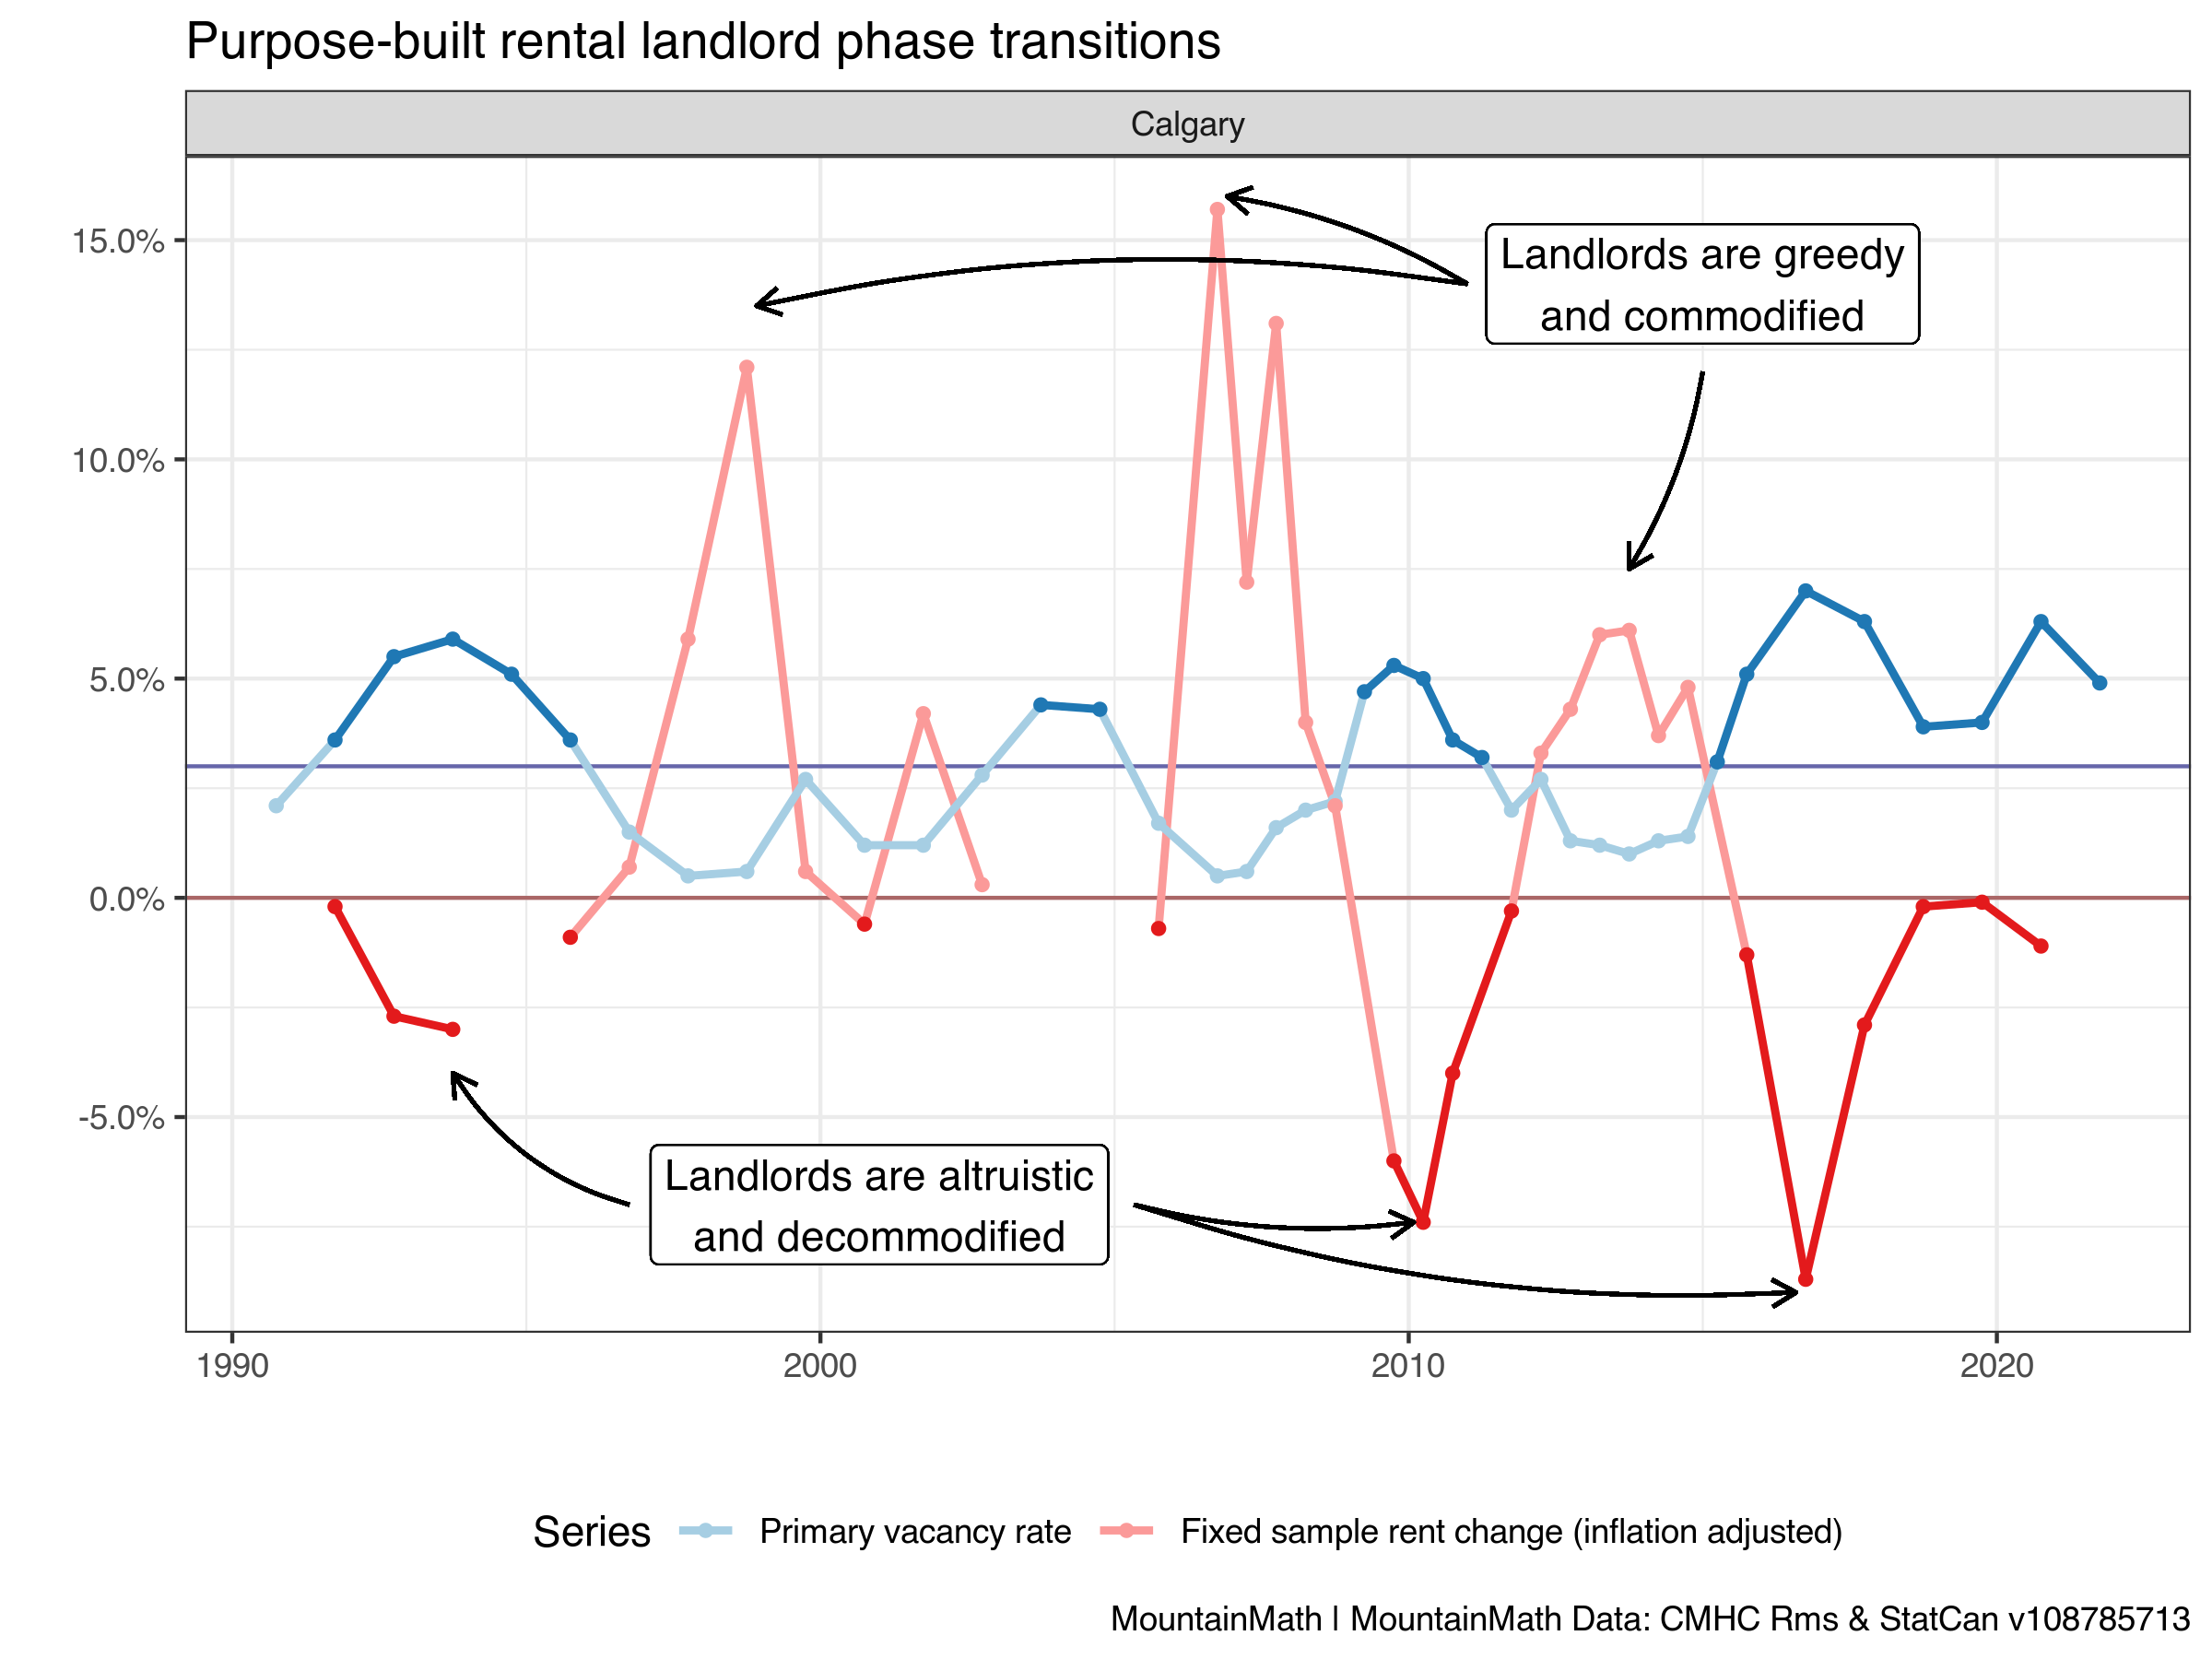
 Generally it is well-understood that vacancy rates drive rent changes. Theory says it should and the correlations are strong. The reverse, assuming that increasing rents lowers the vacancy rate is absurd. But in theory there could be hidden confounders, and I still sometimes see people look at these correlations and refuse to see a causal picture, because “economics 101 does not apply to housing” or some other obscure reason. Unfortunately I haven’t seen anyone try to explain what could confound these estimates, other than some vague reference to “greedy landlords”, “financialization” or “commodification” of housing. This view proposes a that landlord behaviour is a hidden confounder that drives rent changes. Calgary or Edmonton provide good case studies because of the lack of rental control, relatively elastic housing supply, and strong economic shocks.

It is difficult to take this seriously unless people can provide a good explanations of why landlords go through these changes. And the mechanism how this would impact vacancy rates also remains unexplained.
The rest of the rental supply
So far we have only talked about purpose-built market rentals. The main reason for this is that we have longer time lines and better quality data for purpose-built rental, and the idea is that purpose-built and “artisanal rentals” are fungible, so there should not be too much of a different. But in e.g. Vancouver that’s only a small fraction of the rental market. A question that gets brought up a lot is how representative is this really? Can we take the purpose-built rental market as a good barometer of the overall rental market? Theory says so, but it’s good to check the data. CMCH also survey the condo market vacancy rate, but data quality is much poorer.
Let’s compare the purpose-built vacancy rate to the condo vacancy rate.

Overall they line up reasonably well. The condo vacancy rate is much more noisy, but it does capture the general ups and downs of the purpose-built rental vacancy rate. We shoud also note that the condo supply generally differs significantly from the purpose-built rental supply, it tends to be newer and even when controlling for age condos tend to be higher quality. On the other hand, they come with reduced security of tenure.
Regional variation in vacancy rates
Lastly we want to take a quick look at the regional variation in Vacancy rates.
 This pretty much puts us back to pre-pandemic vacancy rates, with Port Moody being an outlier and not representative for rents in the survey zone as the next graph shows.
We can take it down to finer geographies, although data gets more wonky and prone to effects of e.g. new rental buildings coming online during the survey month. The CMHC Survey Zones might strike a good balance between geographic resolution in the central areas and accuracy.

As always, the code for the analysis is available on GitHub for anyone to reproduce, adapt or appropriate for their own purposes.
Reproducibility receipt
## [1] "2022-02-18 16:58:33 PST"## Local: master /Users/jens/Documents/R/mountaindoodles
## Remote: master @ origin (https://github.com/mountainMath/doodles.git)
## Head: [d9602a5] 2022-02-18: census quirks## R version 4.1.2 (2021-11-01)
## Platform: aarch64-apple-darwin20 (64-bit)
## Running under: macOS Monterey 12.2.1
##
## Matrix products: default
## BLAS: /Library/Frameworks/R.framework/Versions/4.1-arm64/Resources/lib/libRblas.0.dylib
## LAPACK: /Library/Frameworks/R.framework/Versions/4.1-arm64/Resources/lib/libRlapack.dylib
##
## locale:
## [1] en_CA.UTF-8/en_CA.UTF-8/en_CA.UTF-8/C/en_CA.UTF-8/en_CA.UTF-8
##
## attached base packages:
## [1] stats graphics grDevices utils datasets methods base
##
## other attached packages:
## [1] mountainmathHelpers_0.1.3 cancensus_0.5.0
## [3] cansim_0.3.10 cmhc_0.1.0
## [5] forcats_0.5.1 stringr_1.4.0
## [7] dplyr_1.0.8 purrr_0.3.4
## [9] readr_2.1.1 tidyr_1.2.0
## [11] tibble_3.1.6 ggplot2_3.3.5
## [13] tidyverse_1.3.1
##
## loaded via a namespace (and not attached):
## [1] Rcpp_1.0.8 lubridate_1.8.0 assertthat_0.2.1 digest_0.6.29
## [5] utf8_1.2.2 R6_2.5.1 cellranger_1.1.0 backports_1.4.0
## [9] reprex_2.0.1 evaluate_0.14 highr_0.9 httr_1.4.2
## [13] blogdown_1.6 pillar_1.6.4 rlang_1.0.1 readxl_1.3.1
## [17] rstudioapi_0.13 jquerylib_0.1.4 rmarkdown_2.11 munsell_0.5.0
## [21] broom_0.7.12 compiler_4.1.2 modelr_0.1.8 xfun_0.28
## [25] pkgconfig_2.0.3 htmltools_0.5.2 tidyselect_1.1.1 bookdown_0.24
## [29] codetools_0.2-18 fansi_1.0.2 crayon_1.4.2 tzdb_0.2.0
## [33] dbplyr_2.1.1 withr_2.4.3 grid_4.1.2 jsonlite_1.7.3
## [37] gtable_0.3.0 lifecycle_1.0.1 DBI_1.1.2 git2r_0.29.0
## [41] magrittr_2.0.1 scales_1.1.1 cli_3.1.0 stringi_1.7.6
## [45] farver_2.1.0 fs_1.5.1 xml2_1.3.3 bslib_0.3.1
## [49] ellipsis_0.3.2 generics_0.1.1 vctrs_0.3.8 tools_4.1.2
## [53] glue_1.6.1 hms_1.1.1 fastmap_1.1.0 yaml_2.2.1
## [57] colorspace_2.0-2 rvest_1.0.2 knitr_1.36 haven_2.4.3
## [61] sass_0.4.0Reuse
Citation
@misc{vacancy-rates-and-rent-change-2021-update.2022,
  author = {{von Bergmann}, Jens},
  title = {Vacancy Rates and Rent Change, 2021 Update},
  date = {2022-02-18},
  url = {https://doodles.mountainmath.ca/posts/2022-02-18-vacancy-rates-and-rent-change-2021-update/},
  langid = {en}
}
